Correspondências devem ser enviadas para: [email protected]
ISSN on-line: 1806-9290 www.sbz.org.br
R. Bras. Zootec., v.35, n.2, p.343-351, 2006
Grazing management strategies for massaigrass-forage peanut pastures.
2. Productivity, utilization and sward structure
1Carlos Mauricio Soares de Andrade2, Rasmo Garcia3, Judson Ferreira Valentim2, Odilon Gomes Pereira3
1 Part of the Doctorate thesis of the first author, with financial support by Fapemig and Embrapa. 2 Embrapa Acre, CP 321, CEP: 69908-970, Rio Branco, AC.
3 Animal Science Department, UFV, granted by CNPq.
ABSTRACT- This study was carried out to evaluate the productivity, utilization and sward structure of a mixed massaigrass
(Panicum maximum x P. infestum, cv. Massai) and forage peanut (Arachis pintoi Ac 01) pasture, intermittently stocked at
three daily herbage allowance levels (9.0, 14.5 and 18.4% of live weight). In each grazing cycle, dry matter (DM) accumulation rates, defoliation intensity (%), grazing depth (%) and grazed horizon (cm) were evaluated. The structure of massaigrass tussocks was characterized in both dry and rainy seasons by measuring its pre-grazing morphological composition and post-grazing height and density (tussocks/m). Pastures submitted to higher herbage allowance (HA) levels showed higher productivity, but were less efficiently utilized. On average, over the experimental period, DM accumulation rates increased linearly from 56.8 to 81.3 kg/ha/day as HA levels increased from 9.0 to 18.4% of live weight. However, defoliation intensity and grazing depth declined linearly with increasing HA levels. During the dry season, pre-grazing morphological composition of massaigrass was characterized by 41% of green leaf blades, 10% of pseudostems and 49% of dead material, irrespective of HA levels. In the rainy season, however, it showed higher percentage of green leaf blades and lower percentage of pseudostems when submitted to lower HA levels, although there were not differences in relation to percentage of dead material. The structure of massaigrass tussocks tended to deteriorate at high HA levels.
Key Words: Arachis pintoi, defoliation intensity, grazing depth, legume, morphological composition, Western Amazon
Estratégias de manejo do pastejo para pastos consorciados de capim-massai
e amendoim forrageiro. 2. Produtividade, utilização e estrutura do pasto
RESUMO - Este estudo foi realizado para avaliar a produtividade, utilização e estrutura de uma pastagem consorciada de capim-massai (Panicum maximum x P. infestum, cv. Massai) e amendoim forrageiro (Arachis pintoi Ac 01), submetida a três níveis de oferta diária de forragem (9,0; 14,5 e 18,4% do PV), sob lotação rotacionada. A cada ciclo de pastejo, avaliou-se a taxa de acúmulo de matéria seca (MS), a intensidade de desfolha (%), a profundidade de pastejo (%) e o horizonte pastejado (cm). A estrutura das touceiras do capim-massai foi caracterizada nos períodos seco e chuvoso quanto à composição morfológica pré-pastejo e à altura e densidade (touceiras/m) pós-pastejo. Pastagens submetidas a maiores níveis de oferta de forragem (OF) apresentaram maior produtividade, porém foram utilizadas com menor eficiência. Na média do período experimental, a taxa de acúmulo de MS da pastagem aumentou linearmente de 56,8 para 81,3 kg/ha/dia com o aumento dos níveis de OF de 9,0 para 18,4% do PV. A intensidade de desfolha e a profundidade de pastejo, no entanto, reduziram linearmente com o aumento dos níveis de OF. No período seco, a composição morfológica do capim-massai se caracterizou por apresentar 41% de lâminas foliares verdes, 10% de pseudocolmo e 49% de material morto, independentemente dos níveis de OF. No período chuvoso, o capim-massai apresentou maior porcentagem de lâminas foliares verdes e menor de pseudocolmo nas pastagens submetidas a menores níveis de OF, não diferindo quanto à porcentagem de material morto. Houve, portanto, tendência de deterioração da estrutura das touceiras do capim-massai com o uso de maiores níveis de OF.
Palavras-chave: Amazônia Ocidental, Arachis pintoi, composição morfológica, intensidade de desfolha, leguminosa, profundidade de pastejo
Introduction
As a result of the evaluation of a large collection of
Panicum maximum accessions since 1984, Embrapa already released in Brazil the cultivars Tanzânia (Embrapa, 1990),
height, higher tiller density and narrow and erect leaves, that bend on tips (Lempp et al., 2001b; Valentim et al., 2001). Some characteristics that contributed to the release of this cultivar include: a) high drymatter production potential; b) high leaf/stem ratio; c) vigorous root system, enabling good adaptation to water deficit and to adverse soil conditions such as compaction and low fertility; d) smaller phosphorus demand and higher aluminum tolerance than other P. maximum cultivars; and, e) higher resistance to spittlebug as compared to cultivars ‘Tanzânia’, ‘Mombaça’ and ‘Tobiatã’ (Valentim & Moreira, 1994; Euclides et al., 2000; Lempp et al., 2001b; Valentim et al., 2001). However, grazing studies comparing cultivars ‘Massai’, ‘Tanzânia’ and ‘Mombaça’ showed inferior performance of beef steers on massaigrass pastures (Euclides et al., 2000; Brâncio et al., 2003b). Available forage and diet selected by the animals on massaigrass pastures presented lower crude protein content and digestibility as well as higher neutral and acid detergent fiber, and lignin levels, than on tanzaniagrass or mombaçagrass pastures (Lempp et al., 2001b; Brâncio et al., 2002, 2003b), although the three cultivars did not differ in dry matter intake (Brâncio et al., 2003b). Some studies have shown that some anatomical characteristics of massaigrass leaf blades hinder its digestion (Lempp et al., 2000, 2001a).
One alternative to overcome the forage quality deficiency of massaigrass pastures would be to associate it with a high quality forage legume. Forage peanut (Arachis pintoi) is a tropical legume that shows good palatability and high nutritional value, dry matter digestibility between 60 and 70%, crude protein content between 13 and 25%, and low condensed tannin levels (Lascano, 1995). Several studies have shown that mixing forage peanut with tropical grass species increases considerably (20 to 100%) the performance and productivity of beef and dairy cattle in relation to the respective grass-only pastures (Hernandez et al., 1995; Lascano, 1995; González et al., 1996; Pereira et al., 1996; Lascano et al., 1999), especially in the case ofB. humidicola, which is recognized by its low protein level (Lascano & Euclides, 1998). In Costa Rica, the annual live weight gain of beef steers on a mixedB. brizantha andA. pintoi pasture was up to 937 kg/ha, surpassing in 30% the live weight gain of the steers on the grass-only pasture (Hernandez et al., 1995).
In a previous paper, it was demonstrated that forage peanut can be successfully associated with massaigrass in the Western Brazilian Amazon as long as pre-grazing sward height is maintained shorter than 65-70 cm to avoid excessive shading to the legume (Andrade et al., 2006). However, some other factors need to be analyzed when defining grazing management strategies, such as sward structure and pasture productivity and utilization.
Sward structure can be defined as the distribution and arrangement of the aboveground plant parts within a community or as the form that forage is available to grazing animals. It is a determinant characteristic for growth and competition dynamics in plant communities (plant-environment and plant-plant interactions), as well as for ingestive behavior of grazing animals (plant-animal interaction) (Laca & Lemaire, 2000; Carvalho et al., 2001). Thus, an important consideration when defining grazing management strategies, especially for tropical pastures, is how these strategies modify sward structure and how these modifications affect the dynamics of sward components and animal selection. Grazing management strategies that maximize forage accumulation but also contribute to deteriorate sward structure (Parsons et al., 1988) or to lower the persistence of some forage species, even over a medium to a long period of time, are undesirable.
The aim of this work was to study the effect of herbage allowance and season of the year on forage productivity and utilization of a mixed massaigrass and forage peanut pasture, as well as on the structure of massaigrass tussocks.
Material and Methods
This experiment was carried out at the Experimental Research Station of Embrapa Acre (10°01’59" S and 67°42’13" W), in Rio Branco, AC, Brazil. Soil, climate and other characteristics of the experimental area were presented in Andrade et al. (2006).
Pre- and post-grazing sward height (cm) and forage mass (kg/ha of DM) measurements were described in Andrade et al. (2006). Dry matter (DM) accumulation rates (kg/ha/day), in each grazing cycle, were calculated dividing total forage mass accumulated (kg/ha of DM) during the rest period by the duration of the rest period (days). Defoliation intensity (%), in each grazing cycle, was calculated as the difference between pre- and post-grazing forage mass, divided by pre-grazing forage mass in the respective grazing cycle. Grazed horizon (cm), in each grazing cycle, was calculated as the difference between pre- and post-grazing sward height (cm). Grazing depth (%) was calculated dividing grazed horizon by the pre-grazing sward height in each of the grazing cycles. These variables could not be calculated for the first quarter of the experimental period (Oct/Dec 2002), when only pre-grazing sward height and forage mass were measured.
It is important to highlight that the technique used to calculate defoliation intensity, grazed horizon and grazing depth does not allow for the separation of the forage effectively ingested by the grazing animals from that lost in the grazing process. It is also important not to confound defoliation intensity with efficiency of herbage utilization, which in a grazing system can be defined as the proportion of gross leaf tissue production that is removed by the animals before entering the senescent state (Lemaire & Chapman, 1996). This latter parameter obviously can only be measured by tissue flow studies. Therefore, parameters describing sward utilization in this study should be interpreted as indicators of the relative intensity of pasture utilization.
Mean post-grazing height of massaigrass tussocks was evaluated in July 2003. For that, a rope was stretched out diagonally on each experimental unit, and all tussocks under the rope were measured for height (cm) and counted. An estimate of tussock density (tussocks/m) was obtained by dividing the number of tussocks by the length (m) of the rope. The relative distribution of tussocks was also calculated in the following height classes: 0-15 cm; 16-30 cm; 41-60 cm; 61-75 cm; and, 76-90 cm.
Pre-grazing morphological composition of massaigrass tussocks was characterized in August 2003 (dry season) and December 2003 (rainy season). For that, a representative tussock was selected in each experimental unit, clipped to a 5 cm stubble height and divided into green leaf blades, pseudostems (leaf sheath + culm) and dead material. Samples were oven-dried at 80°C, for 48 hours, and weighed.
Analyses of variance for DM accumulation rate, defoliation intensity, grazing depth and grazed horizon
were run according to a split-plot in time design, with main plots in a randomized complete block design. Three daily herbage allowance levels represented main plots, with four periods (quarters) representing subplots. Significant interactions (P<0.05) were conveniently broken down. Variables showing significant effect of herbage allowance were analyzed by linear regression. The choice of the best-fit equation was based on the coefficient of determination and on the significance of the regression coefficients. Periods were compared by the Tukey test at the 5% level. The effect of herbage allowance on sward structure variables was analyzed by linear regression.
Results and Discussion
Pasture productivity and utilization
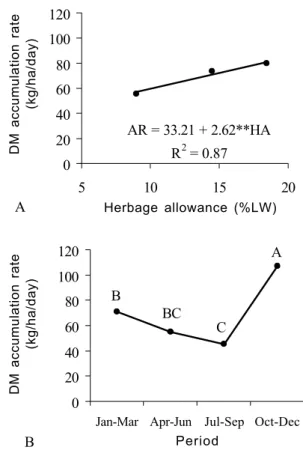
There was no interaction (P>0.05) between herbage allowance (HA) and period of the year for DM accumulation rates and therefore just main effects were analyzed. Over the experimental period, average DM accumulation rates
Figure 1 - Variation in DM accumulation rates as a function of herbage allowance (A) and period of the year (B). ** Significant by F test at the 1% level. Means with the same letters are not different by the Tukey test at the 5% level.
AR = 33.21 + 2.62**HA R2 = 0.87 0
20 40 60 80 100 120
5 10 15 20
Herbage allowance (%LW)
DM accumulation rate
(kg/ha/day)
A
0 20 40 60 80 100 120
Jan-Mar Apr-Jun Jul-Sep Oct-Dec Period
DM accumulation rate
(kg/ha/day)
BC
A
C
B
B
Herbage allowance (%LW)
Period
DM accumulation rate
(kg/ha/day)
DM accumulation rate
increased linearly from 56.8 to 81.3 kg/ha/day as HA levels increased from 9.0 to 18.4% LW (Figure 1A). A reduction in pasture productivity under high grazing intensities has also been showed on continuously stocked dwarf elephantgrass cv. ‘Mott’ pastures (Almeida et al., 2000), as well as on rotationally stocked mombaçagrass (Gomes, 2001) and Brachiaria brizantha-A. pintoi (Ibrahim & Mannetje, 1998) pastures. However, some studies (Uebele, 2002) have showed higher DM accumulation rates when pastures were submitted to higher grazing intensity. Parsons et al. (1988) showed that rotationally stocked pastures present higher gross DM production when managed at higher forage mass (lower grazing intensity). However, the result regarding net DM production is dependent on the senescence rate during the regrowth period. Therefore, the interaction between grazing intensity and duration of the rest period may have favored the productivity of pastures stocked at higher HA levels in the present study.
As shown in a previous paper (Andrade et al., 2006), pastures stocked at lower HA levels presented lower percentages of massaigrass and higher percentages of A. pintoi, weeds and bare ground. Therefore, although increased percentage of A. pintoi usually enhances pasture productivity by increasing soil nitrogen availability (Thomas, 1995), over the short period of time this study was carried out it could not compensate for the other undesirable sward modifications. It is also probable that soil nitrogen availability was not limiting the productivity of this mixed pasture after the long period (nine years) since its establishment.
Higher DM accumulation rates occurred in the Oct/Dec period, followed by Jan/Mar and Apr/Jun (Figure 1B). As expected, the lowest rates occurred in Jul/Sep, the driest period of the year in Acre. In general, the annual DM production was distributed along the year in the following way: 25% in Jan/Mar, 20% in Apr/Jun, 17% in Jul/Sep and 38% in Oct/Dec. These results are in agreement with clipping studies carried out in Acre (Valentim & Moreira, 1994). However, this seasonality of forage production is smaller than that verified in São Paulo, where Uebele (2002) measured the following distribution of DM production on a mombaçagrass pasture: 44, 17, 10 and 29%, for the same periods, respectively.
Annual DM production was 20.4, 26.8 and 29.2 t/ha, from the lowest to the highest HA level, respectively. Besides the favorable climatic and edaphic conditions prevailing in the State of Acre, the high productivity of this mixed pasture can also be attributed to the high productive capacity of massaigrass andA. pintoi. When comparing the
productivity of 25 genotypes of P. maximum, Valentim & Moreira (1994) showed that massaigrass outyielded mombaçagrass and tanzaniagrass by 12 and 16%, respectively.Arachis pintoi accessions have shown annual DM production up to 20 t/ha and DM accumulation rates up to 80 kg/ha/day (Sales et al., 2002).
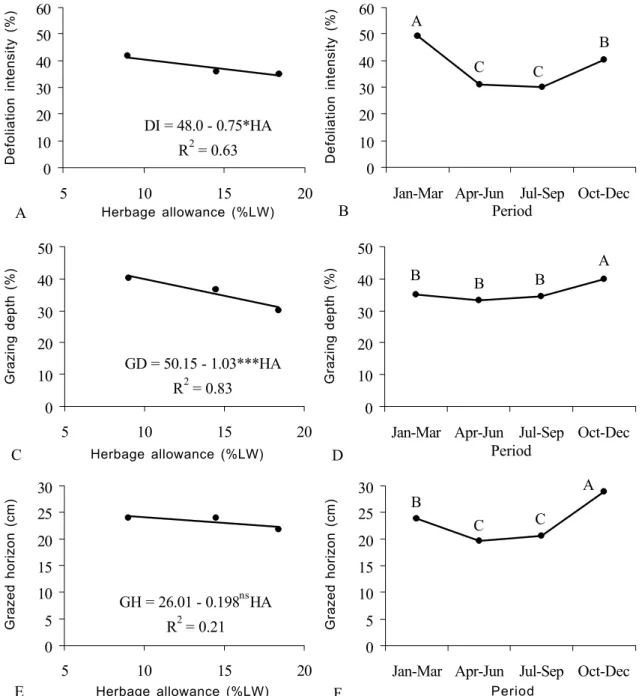
There was no interaction (P>0.05) between herbage allowance and period of the year for defoliation intensity, grazing depth or grazed horizon of the massaigrass-forage peanut pasture. On average, over the experimental period, defoliation intensity and grazing depth decreased linearly from 41.2 to 34.2% (Figure 2A) and from 40.9 to 31.1% (Figure 2C), as HA levels increased from 9.0 to 18.4% LW, respectively. However, there was no effect of herbage allowance on grazed horizon (Figure 2E), whose average value was 23.2 cm. This means that, in each grazing cycle, a similar sward layer was removed in all treatments, regardless of pre-grazing sward height or forage mass. In fact, this kind of response is not unexpected on pastures stocked at different HA levels, since taller swards are utilized less intensively and the shorter ones more intensively (lower herbage allowance and favorable sward structure), resulting in a relatively constant grazed horizon of the swards.
Defoliation intensity and grazed horizon data showed larger variation among the different periods of the year than among the HA levels, with lower values occurring during the driest season, between April and September (Figures 2B and 2F). Variation in grazing depth was somewhat different as it remained relatively constant from January to September, but increased in the Oct/Dec period (Figure 2D). Defoliation intensity showed high correlation with pre-grazing forage mass (r = 0.88), while grazed horizon correlated with pre-grazing sward height (r = 0.96). Brâncio et al. (2003a) found a similar relationship for grazed horizon and pre-grazing sward height when evaluating three P. maximum cultivars. Sward utilization is influenced by stocking density (Lemaire & Chapman, 1996) and also by sward structure, because high proportion of pseudostem and dead material affects negatively the grazing behavior of ruminants, limiting forage intake (Brâncio, 2000; Sollenberger & Burns, 2001). Therefore, the lower values for defoliation intensity and grazed horizon during the dry season were caused by the less favorable sward structure (Figure 5), combined with the lower stocking densities applied in this period, as a result of the lower pre-grazing forage masses (Andrade et al., 2006).
Jan/Mar period (average of 49.3%), outyielding that verified in Oct/Dec (average of 40.1%), probably because higher forage losses occurred in that period due to excessive trampling, since the experimental technique did not allow to discriminate the forage lost from that effectively ingested by the grazing animals.
The results of the present study confirmed that pastures grazed at higher HA levels present higher forage production efficiency (Figure 1A) but lower herbage utilization efficiency (Figures 2A and 2C), and vice-versa, as shown by Hodgson (1990) for temperate pastures.
Sward structure
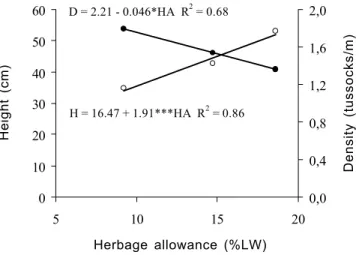
In July 2003, nine months after the onset of the experi-mental period, the effect of herbage allowance on the structure of massaigrass tussocks was quite evident. Under lower HA levels massaigrass showed lower post-grazing height but higher tussock density (Figure 3). This inverse relationship between size and density of massaigrass tussocks is similar to that shown for tiller size and density in temperate (Hodgson, 1990) and tropical grasses (Almeida et al., 2000; Sbrissia et al., 2001). In the present study, the smaller grass height was certainly associated to smaller DI = 48.0 - 0.75*HA
R2 = 0.63 0
10 20 30 40 50 60
5 10 15 20
Herbage allowance (%LW)
Defoliation intensity (%)
A
0 10 20 30 40 50 60
Jan-Mar Apr-Jun Jul-Sep Oct-Dec
Period
Defoliation intensity (%)
A
B
C
B
C
GD = 50.15 - 1.03***HA
R2 = 0.83 0
10 20 30 40 50
5 10 15 20
Herbage allowance (%LW)
Grazing depth (%)
C
0 10 20 30 40 50
Jan-Mar Apr-Jun Jul-Sep Oct-Dec
Period
Grazing depth (%)
B
A B
B
D
GH = 26.01 - 0.198nsHA
R2 = 0.21 0
5 10 15 20 25 30
5 10 15 20
Herbage allowance (%LW)
Grazed horizon (cm)
E
0 5 10 15 20 25 30
Jan-Mar Apr-Jun Jul-Sep Oct-Dec
Period
Grazed horizon (cm)
B
C C
F
A
Figure 2 - Variation in defoliation intensity, grazing depth and grazed horizon as a function of herbage allowance and period of the year. ns, *, *** Not significant by F test at the 5% level, and significant at 5% and 0.1%, respectively. Means with the same letters,
for each variable, are not different by the Tukey test at the 5% level. Herbage allowance (%LW)
Herbage allowance (%LW)
Herbage allowance (%LW) Period
Grazed horizon (cm) Grazed horizon (cm)
Grazing depth (%) Grazing depth (%)
individual tiller size, but the same cannot be affirmed about tiller density. Recruitment of massaigrass seedlings was not observed during the experimental period, therefore the increase in tussock density under lower HA levels was probably associated with the division of big tussocks (large diameter) into two or more smaller ones. This resulted in more spaces among grass plants, facilitating the growth of A. pintoi and weeds in these spaces (Andrade et al., 2006).
In this grazing cycle, average post-grazing height of massaigrass increased from 35 to 53 cm, from the lowest to the highest HA level, respectively (Figure 3). However, pastures showed high spatial heterogeneity in relation to massaigrass height, even at the lowest HA level, where 80% of the tussocks presented post-grazing height between 16 and 45 cm, within the range from 9 to 60 cm (Figure 4). At the highest HA level, 70% of the tussocks presented post-grazing height superior to 45 cm, within the range from 21 to 90 cm. Tropical bunchgrass pastures are typically spatially heterogeneous (Laca & Lemaire, 2000), especially in the case of this mixed pasture that was established 12 years ago.
Animals tended to select against tussocks with height well above the average which generally presented high proportion of dead material, mainly at the highest HA level. When comparing the cultivars ‘Massai’, ‘Tanzânia’ and ‘Mombaça’ under grazing, Brâncio (2000) demonstrated that massaigrass tended to show higher proportion of dead material and the distribution of these dead leaves was interlaced with green leaves, hindering animal selection. The structure of massaigrass plants, with thin and long leaves and high tiller density, helps to explain this fact. In the present study, leaf blades as long as 120 cm, and only 8 mm wide, were measured in massaigrass plants at the Figure 3 - Post-grazing height (?) and density (?) of massaigrass tussocks as a function of herbage allowance, in July 2003.
Figure 4 - Relative distribution of post-grazing height classes of massaigrass tussocks, as a function of herbage allowance, in July 2003.
highest HA level. As these leaves senesce, they tend to remain interlaced with live leaves. Although massaigrass produces lower proportion of stems than otherP. maximum
cultivars (Valentim & Moreira, 1994), the basal portion of its leaf blades presents high proportion of central rib that works as a stem in elevating the leaves into more illuminated sward layers, especially in taller plants. Therefore, the presence of a dense residue of dead plus live leaves, with a high proportion of lignified central ribs, has the same negative effect on grazing behavior, and consequently on forage intake, as stemmy swards. Therefore, to avoid sward structure deterioration and its consequences, grazing management of massaigrass pastures should assure high utilization efficiency.
Pre-grazing morphological composition of massaigrass was evaluated in August (dry season) and December (rainy season) of 2003. In August, morphological composition of massaigrass plants was similar (P>0.05) at the different HA levels. Average composition was 41% of green leaf blades, 10% of pseudostems and 49% of dead material (Figure 5). In Campo Grande, Brâncio et al. (2003a) found similar values for three P. maximum cultivars under grazing, including massaigrass, during the dry season. In December, massaigrass presented lower percentage of green leaf blades (GL = 88.62 – 2.148*HA; R2 = 0.64) and higher percentage of pseudostems (ST = – 12.38 + 1.701***HA; R2 = 0.93) as HA levels increased (Figure 5). However, percentage of dead material did not differ (P>0.05) among HA levels, averaging 30%.
The sampling procedure – choice of tussocks presenting average height – was appropriate to characterize the average morphological composition of the grass in each treatment. However, it was not effective in characterizing the heterogeneity
H = 16.47 + 1.91***HA R2 = 0.86
D = 2.21 - 0.046*HA R2 = 0.68
0 10 20 30 40 50 60
5 10 15 20
Herbage allowance (%LW)
Height (cm)
0,0 0,4 0,8 1,2 1,6 2,0
Density (tussocks/m)
Height (cm)
Herbage allowance (%LW)
Density (tussocks/m)
0 10 20 30 40 50
0-15 cm 16-30 cm 31-45 cm 46-60 cm 61-75 cm 76-90 cm Height classes
% of tussocks
9.0%LW 14.5%LW 18.4%LW
Height classes
of the pastures, because it was evident the high proportion of “deteriorated” tussocks, with higher percentage of dead ma-terial, at the highest HA level. As these tussocks usually were taller than average, they were not sampled.
Morphological composition of massaigrass was better during the period of higher herbage growth (December), when it showed higher percentage of green leaves and lower of dead material, in relation to the dry season (Figure 5). This is a well-known characteristic of tropical grasses in our environments, and similar seasonal variation has been shown for P. maximum cultivars in the Cerrado region of Brazil (Euclides et al., 1999; Brâncio et al., 2003a).
In August, although morphological composition of massaigrass was similar among treatments, its total forage mass was higher at the highest HA levels (Figure 5). Consequently, forage mass of each component (kg/ha of DM) increased linearly with increasing HA levels, according to the
following equations: green leaf blades (GL = 127.4 + 88.70***HA; R2 = 0.91); pseudostem (ST = - 10.86 + 23.86***HA; R2 = 0.87); dead material (DM = - 133.3 + 127.5**HA; R2 = 0.80). The same occurred in December: green leaf blades (GL = 575.1 + 191.6*HA; R2 = 0.70); pseudostem (ST = - 1,376.5 + 155.6***HA; R2 = 0.97); dead material (DM = - 969.4 + 198.1**HA; R2 = 0.86). The increase in mass of pseudostem and dead material at the highest HA levels indicates lower utilization efficiency of massaigrass under these treatments, favoring the accumulation of these components in the sward as grazing cycles elapses. In comparison with August, pre-grazing forage mass of green leaf blades increased at all HA levels in December (Figure 5), due to higher herbage growth rate in this period. However, forage mass of pseudostems increased only at the 14.5 and 18.4% LW treatments, while forage mass of dead material just increased at the highest HA level. Therefore, at the lowest HA level seasonal variation in Figure 5 - Relative and absolute pre-grazing morphological composition of massaigrass, as a function of herbage allowance, in August
and December of 2003.
Dead material Pseudostem Green leaf blade
0 20 40 60 80 100
9.0 14.5 18.4
Herbage allowance (%LW)
Forage mass (%)
0 20 40 60 80 100
9.0 14.5 18.4
Herbage allowance (%LW)
Forage mass (%)
0 2,000 4,000 6,000 8,000 10,000
9.0 14.5 18.4
Herbage allowance (%LW)
Forage mass (kg/ha)
0 2,000 4,000 6,000 8,000 10,000
9.0 14.5 18.4
Herbage allowance (%LW)
Forage mass (kg/ha)
August 2003
Forage mass (kg/ha)
Forage mass (%)
Forage mass (kg/ha)
Herbage allowance (%LW) Herbage allowance (%LW)
Herbage allowance (%LW)
August 2003
Herbage allowance (%LW)
December 2003
percentage of dead material occurred due to a dilution effect, caused by the highest grass growth during the rainy season. At the highest HA level, the increase in mass of pseudostems and dead material from August to December indicates a low utilization efficiency of massaigrass and deterioration of sward structure.
Conclusions
Mixed massaigrass and forage peanut pastures present high productivity under the environmental conditions of the Western Brazilian Amazon.
To avoid the deterioration of the structure of massaigrass tussocks, grazing management strategies should ensure a high utilization efficiency of the sward.
Literature Cited
ALMEIDA, E.X.; MARASCHIN, G.E.; HARTHMANN, O.E.L. et al. Oferta de forragem de capim-elefante anão ‘Mott’ e a dinâmica da pastagem.Revista Brasileira de Zootecnia, v.29, n.5, p.1281-1287, 2000.
ANDRADE, C.M.S.; GARCIA, R.; VALENTIM, J.F. et al. Grazing management strategies for massaigrass-forage peanut pastures. 1. Dynamics of sward condition and botanical composition .
Revista Brasileira de Zootecnia, v.35, n.2, p.334-342, 2006. BRÂNCIO, P.A. Comportamento animal e estimativas de consumo por bovinos em pastagens de Panicum maximum
Jacq. (cultivares Tanzânia, Mombaça e Massai). V i ç o s a , M G : U n i v e r s i d a d e F e d e r a l d e V i ç o s a , 2 0 0 0 . 2 7 8 p . T e s e (Doutorado em Zootecnia) - Universidade Federal de Viçosa, 2 0 0 0 .
BRÂNCIO, P.A.; NASCIMENTO JR., D.; EUCLIDES, V.P.B. et al. Avaliação de três cultivares de Panicum maximum Jacq. sob pastejo. Composição química e digestibilidade da forragem. Revista Brasileira de Zootecnia, v.31, n.4, p.1605-1613, 2002. BRÂNCIO, P.A.; EUCLIDES, V.P.B.; NASCIMENTO JR., D. et al.
Avaliação de três cultivares de Panicum maximum Jacq. sob pastejo: disponibilidade de forragem, altura do resíduo pós-pastejo e participação de folhas, colmos e material morto.
Revista Brasileira de Zootecnia, v.32, n.1, p.55-63, 2003a. BRÂNCIO, P.A.; NASCIMENTO JR., D.; EUCLIDES, V.P.B. et al. Avaliação de três cultivares de Panicum maximum Jacq. sob pastejo: composição da dieta, consumo de matéria seca e ganho de peso animal. Revista Brasileira de Zootecnia, v.32, n.5, p.1037-1044, 2003b.
CARVALHO, P.C.F.; RIBEIRO FILHO, H.M.N.; POLI, C.H.E.C. et al. Importância da estrutura da pastagem na ingestão e seleção de dietas pelo animal em pastejo. In: REUNIÃO ANUAL DA SOCIEDADE BRASILEIRA DE ZOOTECNIA, 38., 2001, Piracicaba. Anais... Piracicaba: Sociedade Brasileira de Zootecnia, 2001. 1 CD-ROM
EMPRESA BRASILEIRA DE PESQUISA E AGROPECUÁRIA -EMBRAPA. Centro Nacional de Pesquisa de Gado de Corte.
Capim Tanzânia-1: uma opção para a diversificação das pastagens. Campo Grande, 1990. 1 folder.
EMPRESA BRASILEIRA DE PESQUISA E AGROPECUÁRIA -EMBRAPA. Centro Nacional de Pesquisa de Gado de Corte.
Mombaça. Campo Grande, 1993. 1 folder.
EUCLIDES, V.P.B.; MACEDO, M.C.M.; VALÉRIO, J.R. et al. Cultivar Massai (P a n i c u m m a x i m u m) uma nova opção forrageira: características de adaptação e produtividade. In:
REUNIÃO ANUAL DA SOCIEDADE BRASILEIRA DE ZOOTECNIA, 37., 2000, Viçosa, MG. Anais… Viçosa, MG: Sociedade Brasileira de Zootecnia, 2000. 1 CD-ROM EUCLIDES, V.P.B.; THIAGO, L.R.L.S.; MACEDO, M.C.M. et al.
Consumo voluntário de forragem de três cultivares de Panicum
maximum sob pastejo.Revista Brasileira de Zootecnia, v.28,
n.6, p.1177-1185, 1999.
GOMES, M.A. Efeitos de intensidades de pastejo e períodos de ocupação da pastagem na massa de forragem e nas perdas e valor nutritivo da matéria seca do capim-mombaça (P a n i c u m m a x i m u m Jacq. cv. Mombaça). Pirassununga: Universidade de São Paulo, 2001. 93p. Dissertação (Mestrado em Zootecnia) - Universidade de São Paulo, 2001.
GONZÁLEZ, M.S.; VAN HEURCK, L.M.; ROMERO, F. et al. Producción de leche en pasturas de estrella africana (Cynodon
nlemfuensis) solo y asociado con Arachis pintoi oDesmodium
ovalifolium. Pasturas Tropicales, v.18, n.1, p.2-12, 1996.
HERNANDEZ, M.; ARGEL, P.J.; IBRAHIM, M.A. et al. Pasture production, diet selection and liveweight gains of cattle grazing
Brachiaria brizantha with or without Arachis pintoi at two
stocking rates in the Atlantic Zone of Costa Rica. Tropical Grasslands, v.29, p.134-141, 1995.
H O D G S O N , J . Grazing management: science into practice. Harlow: Longman Scientific & Technical, 1990. 203p. IBRAHIM, M.A.; MANNETJE, L.’t. Compatibility, persistence
a n d p r o d u c t i v i t y o f g r a s s - l e g u m e m i x t u r e s i n t h e h u m i d tropics of Costa Rica. 1. Dry matter yield, nitrogen yield and botanical composition. Tropical Grasslands, v.32, n.2, p . 9 6 - 1 0 4 , 1 9 9 8 .
LACA, E.A.; LEMAIRE, G. Measuring sward structure. In: MANNETJE, L.’t; JONES, R.M. (Eds.) Field and laboratory methods for grassland and animal production research. Wallingford: CAB International, 2000. p.103-121.
LASCANO , C.E. Valor nutritivo y producción animal de Arachis forrajero. In: KERRIDGE, P.C. (Ed.) Biología y agronomia de especies forrajeras de Arachis. Cali: CIAT, 1995. p.117-130. LASCANO, C.E.; EUCLIDES, V.P.B. Calidad nutricional y producción animal en las pasturas de Brachiaria. In: MILES, J.W.; MAASS, B.L.; VALLE, C.B. (Eds.) Brachiaria: biología, agronomía y mejoramiento. Cali: CIAT, 1998. p.116-135. LASCANO, C.E.; RUIZ, G.A.; VELÁSQUEZ, J. et al. Validation of
Arachis pintoi as a forage legume in commercial dual purpose
cattle farms in forest margins of Colombia. In: I N T E R N AT I O N A L G R A S S L A N D C O N G R E S S , 1 8 , 1 9 9 7 , Winnipeg.Proceedings… Saskatoon: CFC/CSA/CSAS, 1999. Session 24, p.31-32.
LEMAIRE, G.; CHAPMAN, D. Tissue flows in grazed plant communities. In: HODGSON, J.; ILLIUS, A.W. (Ed.) The ecology and management of grazing systems. Wallingford: CAB International, 1996. p.3-36.
LEMPP, B.; EUCLIDES, V.P.B.; MORAIS, M.G. et al. Avaliações do resíduo da digestão de três cultivares de Panicum maximum. In: REUNIÃO ANUAL DA SOCIEDADE BRASILEIRA DE ZOOTECNIA, 37., 2000, Viçosa, MG. Anais... Viçosa, MG: Sociedade Brasileira de Zootecnia, 2000. 1 CD-ROM LEMPP, B.; EUCLIDES, V.P.B.; MORAIS, M.G. et al. Observation
of bundle sheat digestion of P a n i c u m m a x i m u m Jacq. In: INTERNATIONAL GRASSLAND CONGRESS, 19., 2001, São Pedro. P r o c e e d i n g s … São Paulo: Sociedade Brasileira de Zootecnia, 2001a. 1 CD-ROM.
LEMPP, B.; SOUZA, F.H.D.; COSTA, J.C.G. et al.Capim-massai (Panicum maximum cv. Massai): alternativa para diversificação de pastagens. Campo Grande: Embrapa Gado de Corte, 2001b. 9p. (Embrapa Gado de Corte. Comunicado Técnico, 69). PARSONS, A.J.; JOHNSON, I.R.; HARVEY, A. Use of a model to
PEREIRA, J.M.; SANTANA, J.R.; RESENDE, C.P. Alternativas para aumentar o aporte de nitrogênio em pastagem formada por capim humidícola (B r a c h i a r i a h u m i d i c o l a (Rendle) Schweickt). In: REUNIÃO ANUAL DA SOCIEDADE BRASILEIRA DE ZOOTECNIA, 33., 1996, Fortaleza.Anais...
Fortaleza: Sociedade Brasileira de Zootecnia, 1996. p.38-40. SALES, M.F.L.; VALENTIM, J.F.; CARNEIRO, J.C. Introdução e
avaliação de acessos de amendoim forrageiro em Rio Branco, Acre. In: REUNIÃO ANUAL DA SOCIEDADE BRASILEIRA DE ZOOTECNIA, 39., 2002, Recife. Anais... Recife: Sociedade Brasileira de Zootecnia, 2002. 1 CD-ROM
SBRISSIA, A.F.; SILVA, S.C.; CARVALHO, C.A.B. et al. Tiller size/ population density compensation in Coastcross grazed swards.
Scientia Agricola, v.58, p.655-665, 2001.
SOLLENBERGER, L.E.; BURNS, J.C. Canopy characteristics, ingestive behaviour and herbage intake in cultivated tropical grasslands. In: INTERNATIONAL GRASSLAND CONGRESS, 19., 2001, São Pedro. Proceedings… São Paulo: Sociedade Brasileira de Zootecnia, 2001. 1 CD-ROM
THOMAS, R.J. Roles of legumes in providing N for sustainable t r o p i c a l p a s t u r e s y s t e m s . P l a n t a n d S o i l, v . 1 7 4 , n . 1 - 2 , p . 1 0 3 - 1 1 8 , 1 9 9 5 .
Recebido: 20/09/04 Aprovado: 17/10/05
UEBELE, M.C. P a d r õ e s d e m o g r á f i c o s d e p e r f i l h a m e n t o e p r o d u ç ã o d e f o r r a g e m e m p a s t o s d e c a p i m - M o m b a ç a submetidos a regimes de lotação intermitente. Piracicaba: Escola Superior de Agricultura Luiz de Queiroz, 2002. 79p. Dissertação (Mestrado em Agronomia) - Escola Superior de Agricultura Luiz de Queiroz, 2002.
VALENTIM, J.F.; CARNEIRO, J.C.; MOREIRA, P. et al. Capim-massai (P a n i c u m m a x i m u m Jacq.): nova forrageira para a diversificação das pastagens no Acre. Rio Branco: Embrapa Acre, 2001. 16p. (Circular Técnica, 41)
VALENTIM, J.F.; MOREIRA, P. Adaptação, produtividade, c o m p o s i ç ã o m o r f o l ó g i c a e d i s t r i b u i ç ã o e s t a c i o n a l d a produção de forragem de ecotipos de P a n i c u m m a x i m u m