Doi: https://doi.org/10.25186/.v15i.1684
Moisture dynamic sorption isotherms and thermodynamic properties of
parchment specialty coffee (Coffea arabica L.)
Gentil Andres Collazos-Escobar1 , Nelson Gutiérrez-Guzmán1 , Henry Alexander Váquiro-Herrera2 , Claudia Milena Amorocho-Cruz1 1Universidad Surcolombiana, Centro Surcolombiano de Investigación en Café/CESURCAFE, Departamento de Ingeniería Agrícola, Neiva, Colombia 2Universidad del Tolima, Facultad de Ingeniería Agronómica, Ibagué, Tolima, Colombia
Contact authors: [email protected], [email protected], [email protected], [email protected]
Received in November 22, 2019 and approved in July 28, 2020 ABSTRACT
Sorption isotherms represent an efficient and valuable tool for predicting the equilibrium moisture content of foods under different humidities and tem-peratures; thus, they are useful for determining shelf-life and safe storage conditions. The aims of this study were to determine the sorption isotherms of parchment specialty coffee at water activity values of 0.1−0.8 and temperatures of 25, 30, and 40 °C using the dynamic dew point method. The experimental sorption data were modeled using 12 different equations to represent the dependence of equilibrium moisture content on water activity and temperature. Thermodynamic properties were also obtained from the experimental data. The results showed a type II sigmoid shape according to Brunauer-Emmett-Teller (BET) classification, and the double log polynomial (DLP) equation successfully modeled the effects of temperature on the sorption isotherms, obtaining a good fit (R2
adj = 0.99 and RMSE = 0.1 % dry basis). The dynamic dewpoint isotherm (DDI) method was advantageous for modelling due to its high availability of
experimental data. Thermodynamic analyses showed that the net isosteric heat of sorption, Gibbs free energy, and sorption entropy decreased as equilibrium moisture content increased, and the compensation theory provided evidence that the sorption process was controlled by enthalpy (Tβ > Thm).
Key words: Water activity; equilibrium moisture content; hygroscopicity; non-spontaneous; molecular ordering; compensation theory.
1 INTRODUCTION
Coffee is one of the largest globally traded commodities and basic products exported by developing countries (Velasquez et al., 2018). Due to their sensorial attributes, including aroma, body, and reputation, coffees, such as Colombian coffee, have become highly differentiated products (Özdestan et al., 2013). The market for this type of product is constantly growing, driven by changes in consumer preferences (Tolessa et al., 2016). Specialty coffees are characterized as being products with outstanding quality attributes and are generally destined for specialized markets where their prices can reach up to six times those of traditional coffees (Tapiero; Trujillo; Gutiérrez, 2017). To this end, preservation of these desirable sensory qualities is significant and highly dependent on the storage conditions of the coffee (Borém et al., 2013).
Coffee beans are highly hygroscopic, readily absorbing moisture when exposed to the environment during storage (Iaccheri et al., 2015). The moisture content of parchment coffee beans should be 10–12 % wet basis (% w.b.) for safe, long-term storage (Ghosh; Venkatachalapathy, 2015), and according to the Specialty Coffee Association of America (2019), the water activity (aw) of specialty green coffee beans should be < 0.7. A moisture content > 12.5% w.b. creates a number of undesirable consequences, including microbial growth, mycotoxin formation, and an altered sensorial quality of the final product (Barbin et al., 2014), while too low of a moisture content results in weight and economic losses. Therefore,
storage conditions represent one of the most important factors in maintaining final product quality (Borém et al., 2013). An important indicator of coffee quality is moisture content, especially in Colombia, where this parameter is difficult to control during storage due to the high humidity of the Central Mountain Range where the majority of Colombian coffee is grown (Donovan; Foster; Parra, 2019).
For proper parchment coffee handling and storage, knowledge of properties such as water sorption isotherms, which describe the relationship between the equilibrium moisture content and the water activity at constant temperature and pressure (Bastioğlu; Koç; Ertekin, 2017), are efficient and valuable tools for the prediction of safe storage (humidity and temperature) conditions and product shelf-life. Another application of sorption isotherms is the calculation of thermodynamic properties useful for estimating energies required for processes related to enthalpy, entropy (excitation states), and Gibbs free energy (spontaneity) (Monte et al., 2018). Isotherms are commonly produced using either a desiccator or climatic chamber in the laboratory (Yin et al., 2018); however, this method is lengthy and introduces possible errors through the combined effects of fungi activity, deterioration reactions, and variations in temperature and humidity during the course of the experiment (Zhang; Sun; Zhang, 2017). These drawbacks have been overcome by the development of automated dynamic water vapor sorption instruments. According to Schmidt and Lee (2012), the advantages of the dynamic dewpoint isotherm (DDI) method compared to the saturated salt slurry isotherm
method are: increased analysis speed, increased availability of experimental sorption data (often > 75 data points per isotherm), prevention of microorganism growth, and the opportunity to explore material properties. Furthermore, the sorption isotherms of specialty parchment coffee have yet to be reported.
It is important to understand the hygroscopic properties of dried coffee beans based on their heterogeneous material condition (green versus parchment) to establish the best storage conditions for guaranteed quality, since the initial state of the coffee is the raw material for subsequent stages of coffee processing. The aims of this study were to: 1) determine sorption isotherms at temperatures of 25, 30, and 40 °C and water activities of 0.1–0.8 using the DDI method; 2) evaluate the ability of mathematical models to represent the dependence of the sorption isotherms on water activity and temperature; and 3) determine the net isosteric heat of sorption, Gibbs free energy, sorption entropy, and enthalpy-entropy compensation of dried coffee beans.
2 MATERIAL AND METHODS 2.1 Coffee samples
Seven specialty coffee samples of Colombia and Castillo variety (Coffea arabica L.), from different farmers from the Huila region of Colombia, were wet processed, and underwent sensory analysis according to the Specialty Coffee Association of America (SCAA) methodology (SCAA, 2015) by four expert panelists at the South Colombian Coffee Research Center (CESURCAFÉ) (Di Donfrancesco; Gutierrez;
Chambers, 2014). The samples, receiving cup scores between 84 and 87.5, were considered high-quality specialty coffees.
2.2 Sorption isotherms 2.2.1 Initial moisture content
Moisture content was determined by drying 5 × 10‒3 kg
of each sample in an oven (UF55, Memmert GmbH + Co.KG, Schwabach, Germany) at 105 °C for 24 h (Rendón; Garcia; Bragagnolo, 2014).
2.2.2 Experimental determinations of the sorption isotherms
For the development of the DDI method, 3.5× 10⁻³ kg of
specialty parchment coffee was placed inside a vapor sorption analyzer (Aqualab VSA, Decagon Devices, Inc., Pullman, WA). Working isotherms were obtained in the water activity range of 0.1–0.8, at intervals of 0.01 aw, at temperatures of
25, 30, and 40 °C, in triplicate, under an air flow of 6 L h-1.
The initial moisture content, % dry basis (% d.b.), and water activity values were 12 ± 0.1 and 0.586 ± 0.016, respectively.
2.2.3 Modelling the sorption isotherms
The sorption isotherms of the specialty parchment coffee were mathematically represented using twelve models (Table 1), where Xe is the equilibrium, moisture content (%
d.b.), aw is the water activity, A, B, and C are the
Guggenheim-Anderson-de Boer (GAB) model parameters (Oliveira et al., 2017), T is the absolute temperature (K), and bi are the empirical model parameters.
Table 1: Mathematical models used to represent the specialty parchment coffee sorption isotherms*.
Model Mathematical expression Reference
Modified GAB (1) e
w
w w w AB C / T a X 1 B(a ] 1 B a B C / T a (Oliveira et al., 2017) Oswin (2) 2 b w e 1 w a X b 1 a (Monte et al., 2018)Smith (3) Xe b b ln 1 a1 2
w
(Shigehisa; Inoue; Kumagai, 2015)Chung-Pfost (4) Xeb b ln lna1 2
w
(Mousa et al., 2012)Caurie (5) Xeexp b b a
1 2 w
(Sormoli; Langrish, 2015)Iglesias and Chirife (6) e 1 2 w w a X b b 1 a (Sormoli; Langrish, 2015)
White and Eyring (7) e
1 2 w 1 X b b a (Sormoli; Langrish, 2015) Peleg (8) b1 b3 e 0 w 2 w X b a b a (Khawas; Chandra, 2017) DLP (9) 2 3 e 0 1 2 3 w X b b x b x b x x ln( ln a ) (Shittu et al., 2015) Continue...
2.2.4 Parameter estimations and statistical analyses
MATLAB R2019b (The MathWorks Inc., Natick, MA) was used to identify the model parameters and calculate the 95% confidence intervals of the parameters of the non-linear regression analyses. The adjusted coefficient of determination (R2
adj) and root mean square error (RMSE%) in percentage
(Equation 13), were used to determine the goodness of fit of the statistics, with high R2
adj (>0.98) and low RMSE (<10%
d.b.) values considered to be a reasonable fit (Sormoli and Langrish, 2014; Bastioğlu et al., 2017).
two temperatures (Equation 15). Gibbs free energy (ΔG) was obtained using Equation 16, and the entropy of sorption (ΔS) was calculated using Equation 17.
Model Mathematical expression Reference
Kuhn (10) e 1 2 w b X b lna (Domian et al., 2018)
Polynomial (11) Xeb0b a1 wb a2 w2b a3 w3 (Mousa et al., 2012) Yanniotis and Blahovec (12) e w w
0 1 w 2 3 w a a X b b a b b a (Bensebia; Allia, 2016)
*In all cases, a linear dependence of temperature on the bi parameter was assumed (biT + bi.1) (Collazos-Escobar; Gutiérrez-Guzmán; Vaquiro, 2019).
Table 1: Continuation. (13)
N 2 exp est i 1 1 RMSE% X X 100 N
Where Xexp and Xest are the experimental and estimated
equilibrium moisture content (% d.b.), respectively. N is the number of experimental data points.
2.3 Fourier-transform infrared (FTIR) spectroscopy
To obtain biochemical fingerprints of the coffee samples, an FTIR spectrophotometer (Cary 630, Agilent Technologies, Santa Clara, CA) was used. Attenuated total reflectance (ATR)-FTIR measurements were performed under dry atmospheric and room temperature (20 ± 0.5 °C) conditions (Bahamon; Parrado; Gutiérrez-Guzman, 2018). The dried coffee beans were threshed and ground separately. The ground green and parchment coffee beans (5 × 10‒4 kg) were then placed in the sampling accessory
and pressed. Background measurements were obtained from readings of the accessory without sample. All the spectra were recorded within the range of 4000–650 cm−1, using an 8 cm−1
resolution, scan rate of 20, and background correction. All samples were analyzed in triplicate.
2.4 Thermodynamic properties
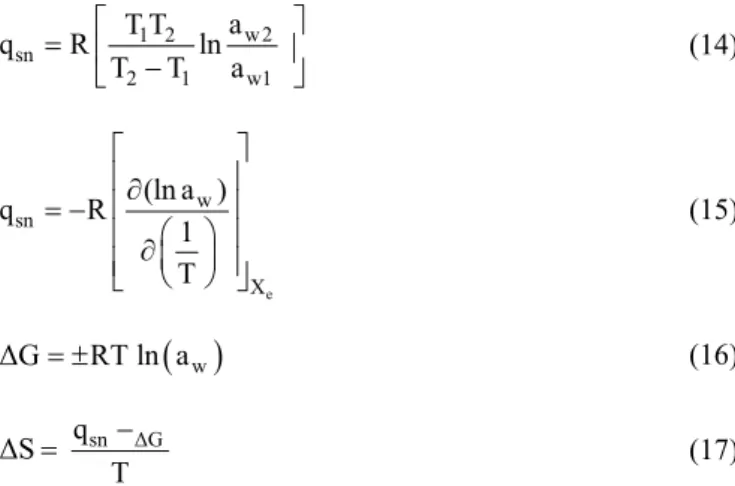
Thermodynamic properties were calculated from the experimental moisture sorption isotherm data. The net isosteric heat of sorption, or enthalpy of sorption, (qsn), was calculated
using the Clausius-Clapeyron equation (Equation 14) using the slope of the plot of ln(aw) versus 1/T (Domian et al., 2018).
The qsn was also calculated by integrating Equation 14 between
e w sn X (ln a ) q R 1 T w2 1 2 sn 2 1 w1 a T T q R ln T T a
w ΔG RT ln a sn ΔG q ΔS T sn β q T ΔS ΔG (14) (15) (16) (17) where, aw is water activity; R is the universal gas constant ofwater vapor (8.314 × 10⁻³ kJ mol−1 K−1); and T is the absolute
temperature (K).
2.5 Compensation theory
According to Červenka, Hloušková and Žabčíková (2015), the enthalpy-entropy compensation theory assumes a linear relationship between qsn and ΔS, as shown in Equation 18.
(18) where, Tβ is the isokinetic temperature (K). If Tβ is greater than the harmonic temperature (Thm),the sorption process is
enthalpy driven; otherwise, the process is considered to be entropy controlled (Bensebia; Allia, 2016). Thm was calculated
by Equation 19 where nt is the total number of isotherms. (19) t t hm n i 1 1 n T 1 T
3 RESULTS AND DISCUSSION
Table 2 shows the four mathematical models which best fit the results considering the effects of temperature on the sorption isotherms.
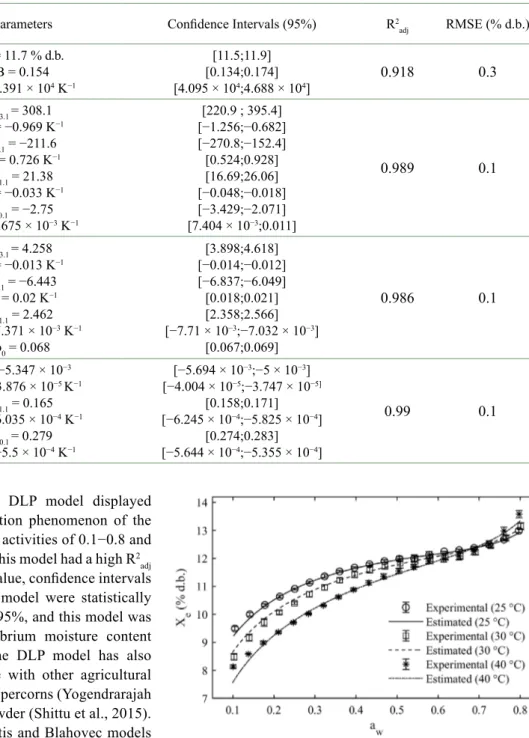
As shown in Table 2, the DLP model displayed the best representation of the sorption phenomenon of the specialty parchment coffee at water activities of 0.1−0.8 and temperatures of 25, 30, and 40 °C. This model had a high R2
adj
(0.99) and low RMSE (0.1% d.b.) value, confidence intervals showed that all parameters of the model were statistically significant at a confidence level of 95%, and this model was practical for predicting the equilibrium moisture content at all experimental conditions. The DLP model has also been adjusted successfully for use with other agricultural products, including whole black peppercorns (Yogendrarajah et al., 2015) and starch albumen powder (Shittu et al., 2015). The GAB, polynomial, and Yanniotis and Blahovec models had lower goodness of fits compared to the DLP model, although their parameters were statistically significant. The eight additional models (Oswin, Smith, Chung-Pfost, Caurie, Iglesias and Chirife, White and Eyring, Peleg, and Kuhn) showed poor fits compared to the models in Table 2, having lower R2
adj and higher RMSE values, and should therefore not
be considered for describing the sorption process of specialty parchment coffee.
The experimental working isotherms and modelled data using the DLP equation at 25, 30, and 40 °C are shown in Figure 1.
As seen in Figure 1, the DLP model well predicts the majority of the experimental data and is highly able to describe the sorption process. The DDI isotherms exhibit a typical type II sigmoid-shape curve according to BET classification, which is characteristic of non-porous and macroporous materials (Inglezakis; Poulopoulos; Kazemian, 2018). This form has also been reported for DDI sorption isotherms of green coffee
Table 2: Estimated model parameters and statistical results
Models Parameters Confidence Intervals (95%) R2
adj RMSE (% d.b.) GAB Modified A = 11.7 % d.b. B = 0.154 C = 4.391 × 10⁴ K−1 [11.5;11.9] [0.134;0.174] [4.095 × 10⁴;4.688 × 10⁴] 0.918 0.3 Yanniotis and Blahovec b3.1 = 308.1 b3 = −0.969 K−1 b2.1 = −211.6 b2 = 0.726 K−1 b1.1 = 21.38 b1 = −0.033 K−1 b0.1 = −2.75 b0 = 9.675 × 10⁻³ K−1 [220.9 ; 395.4] [−1.256;−0.682] [−270.8;−152.4] [0.524;0.928] [16.69;26.06] [−0.048;−0.018] [−3.429;−2.071] [7.404 × 10⁻³;0.011] 0.989 0.1 Polynomial b3.1 = 4.258 b3 = −0.013 K−1 b2.1 = −6.443 b2 = 0.02 K−1 b1.1 = 2.462 b1 = −7.371 × 10⁻³ K−1 b0 = 0.068 [3.898;4.618] [−0.014;−0.012] [−6.837;−6.049] [0.018;0.021] [2.358;2.566] [−7.71 × 10⁻³;−7.032 × 10⁻³] [0.067;0.069] 0.986 0.1 DLP b3 = −5.347 × 10⁻³ b2 = −3.876 × 10⁻⁵ K−1 b1.1 = 0.165 b1 = −6.035 × 10⁻⁴ K−1 b0.1 = 0.279 b0 = −5.5 × 10⁻⁴ K−1 [−5.694 × 10⁻³;−5 × 10⁻³] [−4.004 × 10⁻⁵;−3.747 × 10⁻⁵] [0.158;0.171] [−6.245 × 10⁻⁴;−5.825 × 10⁻⁴] [0.274;0.283] [−5.644 × 10⁻⁴;−5.355 × 10⁻⁴] 0.99 0.1
Figure 1: Experimental sorption isotherms and modelled data
from the DLP model as a function of equilibrium moisture content at 25, 30, and 40 °C.
beans (Iaccheri et al., 2015) and green and pulped coffee, and coffee cherry fruit (Corrêa et al., 2010). Similar isotherm forms have also been reported for other agricultural products, including Malaysian paddy (Mousa et al., 2012), rosemary leaves (Bensebia; Allia, 2016), green and roasted yerba mate (Červenka; Hloušková; Žabčíková, 2015), and dry persimmon leaves (Martínez-Las Heras et al., 2014).
All isotherms at the same temperature showed increased equilibrium moisture content with increased water activity. Statistically significant differences (95%) in the moisture contents of the isotherms at 25, 30, and 40 °C for water activity values from 0.1–0.5 were confirmed by analysis of variance. In the water activity range from 0.5 to ≤ 0.75, the isotherm representing 40 °C crossed over, with statistically significant differences (95%) not seen again until the aw = 0.8.
It is widely accepted that the effect of temperature increases on sorption isotherms lead to decreases in equilibrium moisture content (Domian et al., 2018). In Figure 1, for 0.1 < aw < 0.7, increases in temperature led to decreases
in the equilibrium moisture content of the dried coffee beans. This behavior can be explained by the excitation state of water molecules; when temperature is increased the molecules become thermodynamically less stable, leading to a decrease in their attractive forces, thus reducing the moisture content of the product (Monte et al., 2018; Noshad et al., 2012). This sorption behavior has also been reported by Cano-Higuita et al. (2015), Goneli et al. (2013), Mousa et al. (2012), Yogendrarajah et al. (2015), and Bastioğlu et al. (2017).
However, at aw ≥ 0.71, an inverse effect is seen; the
equilibrium moisture content increases with increasing
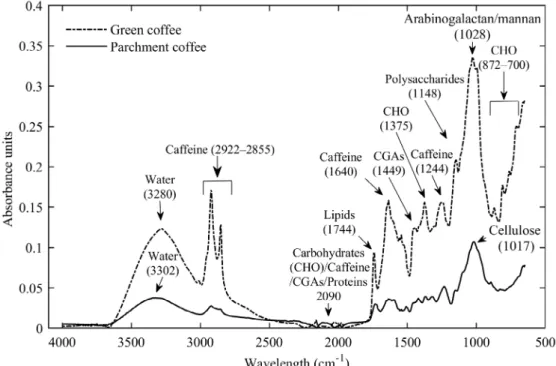
temperature, indicating that the product is more hygroscopic. These results can be explained in terms of the solubilization of sugars in foods at high water activity levels and according to Domian et al. (2018), for water activities > 0.7 water is available as a solvent. Similar trends have been reported for whole black peppercorns (Yogendrarajah et al., 2015), green and roasted yerba mate (Červenka; Hloušková; Žabčíková, 2015), and starch albumen powder (Shittu et al., 2015). The adsorption process was found to be dependent on several highly interrelated factors: the physicochemical properties of the adsorbent (functional groups verified by FTIR spectroscopy), chemical characteristics of the adsorbates, prevailing experimental conditions, and affinity between the adsorbent and adsorbate (Anastopoulos et al., 2017). As seen in Figure 1, the inverse effect of temperature occurs in the region of Xe > 12.4% d.b. and aw ≥ 0.71. In order to support the results obtained in Figure 1, spectra of ground green and parchment coffee in the infrared region of 4000–650 cm−1
were obtained (Figure 2).
As shown in Figure 2, the absorbance peaks of the samples can be associated with the chemical compositions of the materials. According to Wei and Tanokura (2015), the composition of green coffee beans is very complex. For example, arabica green coffee beans contain polysaccharides, oligosaccharides, lipids, free amino acids, proteins, chlorogenic acids, caffeine, trigonelline, fatty acids, and minerals. Furthermore, Melo Pereira et al. (2018) reported that green coffee beans contain insoluble (cellulose and hemicellulose) and soluble (arabinose, fructose, galactose, glucose, sucrose, raffinose, and stachyose) carbohydrates. A comparison of the
FTIR spectra of green and roasted coffee by Craig, Franca and Oliveira (2012) revealed similar, although different intensity, bands at 2920 and 2850 cm−1 which are associated with
caffeine. The band at 1740 cm−1 can be associated with lipids,
while the peaks at 1450–1050 cm−1 can partially be attributed to
chlorogenic acids (CGAs) (occurring at 1450 cm−1 in this work).
Craig et al. (2018) reported that the arabinogalactan/ mannan fraction of green coffee beans occurs at 1066 and 1034 cm−1 (ring vibration), and caffeine occurs at 1643 cm−1 (observed
at 1028 and 1640 cm−1, respectively, in this work). The region
near 2100 cm−1 is related to carbohydrates, caffeine, chlorogenic
acids, and/or proteins (Craig et al., 2015). The wavelengths of 1700–600 cm−1 can be related to carbohydrates, trigonelline, and
chlorogenic acids, while the peak at 1242 cm−1 can be related to
caffeine (Craig; Franca; Oliveira, 2012).
Reis, Franca and Oliveira (2013) also mentioned that carbohydrates exhibit several absorption bands in the 1500– 700 cm−1 region. For the parchment FTIR spectrum, cellulose
exhibits strong bands at 1059 and 1033 cm−1 (ring vibration)
(Craig et al., 2018) (presented as a strong peak at 1017 cm−1
in this work) which can be associated with the lignocellulose composition of the parchment (Ramírez-Martínez et al., 2013), being ∼ 57% cellulose and ∼ 22% lignin (Collazo-Bigliardi; Ortega-Toro; Chiralt, 2018).
In general, the absorbance values were higher for ground green coffee compared to those of ground parchment coffee. Assuming the parchment coffee is a heterogeneous material, the negative effect of temperature (crossing of
isotherms with increased temperature at aw > 0.71) may be
due to carbohydrate solubility, which also occurs for green coffee. According to Ghosh and Venkatachalapathy (2015), the moisture content of parchment coffee beans should be in the range of 10–12 % w.b.
Using the DLP equation, equilibrium moisture contents at the critical water activity value (aw = 0.7), where dissolution
occurs and the features of specialty coffee no longer exist, were calculated. These values were: 12.41% d.b. (11.039% w.b.) at 25 °C, 12.42% d.b. (11.04% w.b.) at 30 °C, and 12.45% d.b. (11.071% w.b.) at 40 °C. Additionally, at the lowest, safe water activity value (aw = 0.5), the equilibrium moisture contents were: 11.94% d.b. (10.66% w.b.) at 25 °C, 11.78% d.b. (10.538% w.b.) at 30 °C, and 11.44% d.b. (10.265% w.b.) at 40 °C. Based on these results, to maintain their specialty properties, it is necessary for the coffee samples to be stored in an environment with a relative humidity (RH) ≥ 50% but < 70% at temperatures of 25–40 °C.
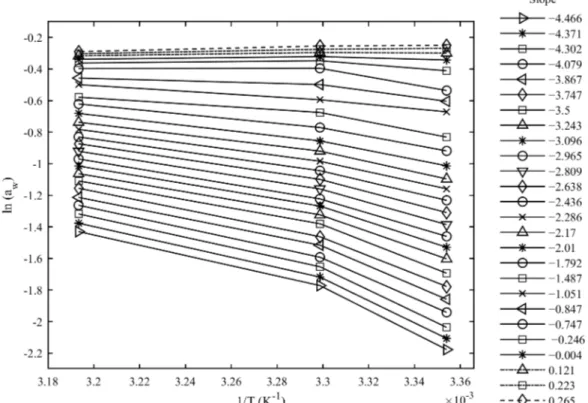
Figure 3 shows the plots and slopes of the net isosteric heats of sorption of the dried coffee beans calculated using Equation 14.
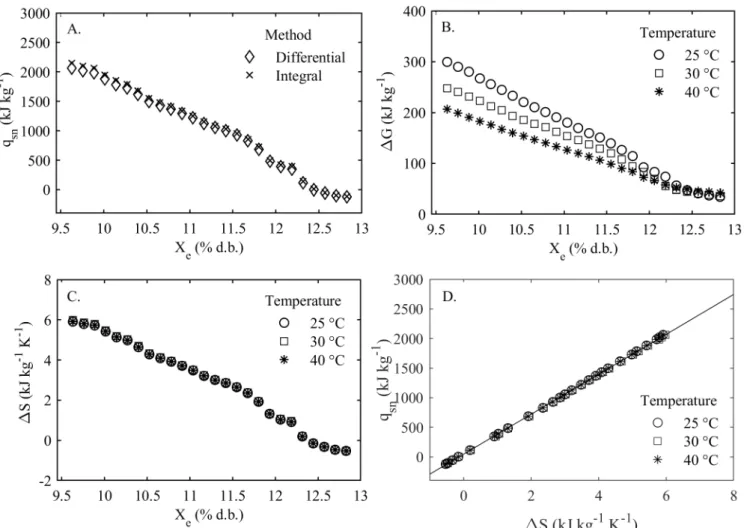
The three positive slope values correspond to the crossing isotherm values occurring at water activities > 0.71. Multiplication of these positive inverse effect values by ‒R produces negative net isosteric heat of sorption values (Figure 4A) which are the result of transitions and solubilizations of sugars (Domian et al., 2018). Figure 4 presents the results of the thermodynamic analyses of the specialty parchment coffee.
The net isosteric heat of sorption provides important information about the energetic changes that occur in food as a function of equilibrium moisture content (Viganó et al., 2012). As seen in Figure 4A, the qsn values decreased as the equilibrium moisture content increased. This behavior indicates that sorbent-sorbate interactions are strong at low equilibrium moisture content values and weaken with increasing moisture content. This is due to increases in the equilibrium moisture content leading to active site occupation and sorption occurring at the less active sites, as evidenced by lower heat of sorption values (Noshad et al., 2012).
The results observed in Figure 4A are similar to values reported by Goneli et al. (2013) in green and pulped coffee, and coffee cherry fruits. According to Domian et al. (2018), the negative values of qsn at high equilibrium moisture
contents can be explained by the inverse effect behavior of the sorption isotherm with temperature, which is due to the solubility of food sugars, and is not normal sorption behavior. The ΔG values provide a criterion to evaluate the spontaneous (ΔG < 0) or non-spontaneous (ΔG > 0) nature of water sorption (Bastioğlu et al., 2017), and are related to
the amount of energy required to convert water molecules from vapor state to a solid surface, or vice versa (Teixeira; Andrade; Devilla, 2018).
Figure 4B shows positive ΔG values, indicating that the sorption process was non-spontaneous. According to Goneli et al. (2013), ΔG is related to the energy required for the product layers to become available for sorption. At high equilibrium moisture contents, low amounts of energy are required to make the sites available for sorption because they are already available, which is characteristic of an endothermic process. The ΔG values obtained using Equation 16 showed similar trends for green coffee at temperatures of 20, 30, and 40 °C for equilibrium moisture contents of 9.5–12.4% d.b., except for the last three data points where crossing of ΔG with temperature occurs.
These values correspond to aw > 0.70, thus, the results can be explained as being due to the negative effect behavior of temperature on the sorption isotherms. Increases in temperature reduce the amount of energy required to transfer water molecules from solid surface to vapor state, thus reducing the non-spontaneity of the sorption process. This result can be
Figure 4: (A) Net isosteric heat of sorption, (B) Gibbs free energy, (C) sorption entropy, and (D) theory of compensation for specialty dried coffee beans as a function of equilibrium moisture content.
explained in terms of the increase in temperature providing kinetic energy to the water molecules (Bastioğlu et al., 2017).
Entropy can be considered in terms of the order/disorder of adsorbed molecules (Cano-Higuita et al., 2015). Figure 4C shows the relationship between sorption entropy and equilibrium moisture content. It can be seen that increases in moisture content lead to decreases in sorption entropy, and the effect of temperature is insignificant. Similar sorption entropy values were reported by Goneli et al. (2013). The negative values of ΔS at high equilibrium moisture contents can be explained by the inverse effect behavior of the sorption isotherm. This behavior was also reported by Červenka, Hloušková and Žabčíková (2015) in green and roasted yerba mate, and in this work, these values were attributed to the incremental dissolution of sugar with incremental increases in temperature.
The enthalpy-entropy compensation theory was verified. Through linear regression of the data in Figure 4D (R2
= 0.9998), the Tβ parameter was 337.5 K for dried coffee beans. The trendline showed a high level of linearity, indicating that the theory of compensation was most likely valid (Monte et al., 2018). To confirm the compensation theory, a Thm value of
304.69 K was calculated, showing that Tβ > Thm,indicating that enthalpy controls the sorption process, which was supported by the ΔG parameter of the linear relationship showing non-spontaneity.
4 CONCLUSIONS
The sorption isotherm behavior of the parchment coffee beans exhibited a type II, or S-shaped, form, which is common for non-porous and macroporous food products.
The sorption process was found to be dependent on temperature, with equilibrium moisture content values decreasing with increasing temperature at aw = 0.1–0.7. The
DLP model was able to satisfactorily demonstrate the effects of temperature on the sorption isotherms, having a good fit (R2
adj
= 0.99 and RMSE = 0.1 % dry basis) for specialty parchment coffee at water activities of 0.1‒0.8 and temperatures of 25, 30, and 40 °C. Therefore, the results obtained from this valuable tool are able to accurately predict equilibrium moisture content for establishment of optimal storage conditions of coffee.
The hygroscopic equilibria curves obtained using the DDI method offer a high availability of experimental sorption data, wide working range, and good precision, providing a significant advantage for modelling experimental data. Being detailed and high in resolution, this method can facilitate the adjustment of models to the tendencies of the adsorption/ desorption zones and enable expressions for general conditions representative of sorption phenomena to be obtained.
Water activities > 0.7 showed possibilities of sugar dissolution and affinity effects between water-coffee, which were verified using ATR-FTIR spectroscopy. These effects
led to an inverse effect of temperature (crossing of sorption isotherms), which suggests future research about this widely reported behavior occurring at high levels of water activity should be performed.
Thermodynamic property analyses revealed that net isosteric heat of sorption, Gibbs free energy, and sorption entropy decreased with increasing equilibrium moisture content, providing evidence that the sorption process was non-spontaneous. Enthalpy-entropy compensation theory results suggested that the sorption process was controlled by enthalpy, which corresponds to results previously reported for coffee beans from other cultivars.
5 ACKNOWLEDGEMENTS
This work was supported by the South Colombian Coffee Research Center, CESURCAFÉ.
6 REFERENCES
ANASTOPOULOS, I. et al. A review for coffee adsorbents.
Journal of Molecular Liquids, 229:555-565, 2017.
BAHAMON, M. A. F.; PARRADO, L. X.; GUTIÉRREZ-GUZMÁN, N. ATR-FTIR for discrimination of espresso and American coffee pods. Coffee Science, 13(4):550-558 2018.
BARBIN, D. F. et al. Application of infrared spectral techniques on quality and compositional attributes of coffee: An overview. Food Research International, 61:23-32, 2014.
BASTIOĞLU, A. Z.; KOÇ, M.; ERTEKIN, F. G. Moisture sorption isotherm of microencapsulated extra virgin olive oil by spray drying. Food Measure, 11:1295-1305, 2017. BENSEBIA, O.; ALLIA, K. Analysis of adsorption–
desorption moisture isotherms of rosemary leaves.
Journal of Applied Research on Medicinal and Aromatic Plants, 3(3):79-86, 2016.
BORÉM, M. F. Evaluation of the sensory and color quality of coffee beans stored in hermetic packaging. Journal of
Stored Products Research, 52:1-6, 2013.
CANO-HIGUITA, D. M. Influence of alternative drying aids on water sorption of spray dried mango mix powders: A thermodynamic approach. Food and Bioproducts
Processing, 93:19-28, 2015.
ČERVENKA, L.; HLOUŠKOVÁ, L.; ŽABČÍKOVÁ, S. Moisture adsorption isotherms and thermodynamic properties of green and roasted Yerba mate (Ilex paraguariensis). Food Bioscience, 12:122-127, 2015.
COLLAZO-BIGLIARDI, S.; ORTEGA-TORO, R.; CHIRALT, B. A. Isolation and characterization of microcrystalline cellulose and cellulose nanocrystals from coffee husk and comparative study with rice husk.
Carbohydrate Polymers, 191:205-215, 2018.
COLLAZOS-ESCOBAR, G. A.; GUTIÉRREZ-GUZMÁN, N.; VAQUIRO, H. H. A. Modeling dynamic adsorption isotherms and thermodynamic properties of specialty ground roasted-coffee (Coffee Arabica L.). Coffee
Science, 14(1):93, 2019.
CORRÊA, P. C. et al. Moisture sorption isotherms and isosteric heat of sorption of coffee in different processing levels. International Journal of Food Science and
Technology, 45(10):2016-2022, 2010.
CRAIG, A. P.; FRANCA, A. S.; OLIVEIRA, L. S. Evaluation of the potential of FTIR and chemometrics for separation between defective and non-defective coffees. Food
Chemistry, 132(1):1368-1374, 2012.
CRAIG, A. P. et al. Mid infrared spectroscopy and chemometrics as tools for the classification of roasted coffees by cup quality. Food Chemistry, 245:1052-1061, 2018.
CRAIG, A. P. et al. Fourier transform infrared spectroscopy and near infrared spectroscopy for the quantification of defects in roasted coffees. Talanta, 134:379-386, 2015. DI DONFRANCESCO, B.; GUTIERREZ, G. N.;
CHAMBERS IV, E. Comparison of results from cupping and descriptive sensory analysis of Colombian brewed coffee. Journal of Sensory Studies, 29(4):301-311, 2014. DOMIAN, E. et al. Effect of carbohydrate type on the
DVS isotherm-induced phase transitions in spray-dried fat-filled pea protein-based powders. Journal of Food
Engineering, 222:115-125, 2018.
DONOVAN, K. N.; FOSTER, A. K.; PARRA, S. C. A. Analysis of green coffee quality using hermetic bag storage. Journal of Stored Products Research, 80:1-9, 2019.
GHOSH, P.; VENKATACHALAPATHY, N. Changes in physico-chemical properties of coffee due to hot air assisted microwave drying. International Journal of
Processing and Post Harvest Technology, 6(1):69-79,
2015.
GONELI, A. L. D. et al. Water sorption properties of coffee fruits, pulped and green coffee. LWT - Food Science and
Technology, 50(2):386-391, 2013.
IACCHERI, E. et al. Different analytical approaches for the study of water features in green and roasted coffee
beans. Journal of Food Engineering, 146:28-35, 2015.
INGLEZAKIS, J. V.; POULOPOULOS, S. G.; KAZEMIAN, H. Insights into the S-shaped sorption isotherms and their dimensionless forms. Microporous and Mesoporous
Materials, 272: 166-176, 2018.
KHAWAS, P.; CHANDRA, D. S. Moisture sorption isotherm of underutilized culinary banana flour and its antioxidant stability during storage. Journal of Food Processing and
Preservation, 41(4):e13087, 2017.
MARTÍNEZ-LAS HERAS, R. et al. Moisture sorption isotherms and isosteric heat of sorption of dry persimmon leaves. Food Bioscience, 7:88-94, 2014.
MELO PEREIRA, V. D. et al. Exploring the impacts of postharvest processing on the aroma formation of coffee beans – A review. Food Chemistry, 272:441-452, 2018. MONTE, L. M. et al. Moisture sorption isotherms of
chitosan-glycerol films: Thermodynamic properties and microstructure. Food Bioscience, 22:170-177, 2018. MOUSA, W. et al. Sorption isotherms and isosteric heats
of sorption of Malaysian paddy. J Food Sci Technol, 51(10):2656-2663, 2012.
NOSHAD, M. et al. Desorption isotherms and
thermodynamic properties of fresh and osmotic–ultrasonic dehydrated quinces. Journal of Food Processing and
Preservation, 37(5):381-390, 2012.
OLIVEIRA, G. H. et al. Roasting, grinding, and storage impact on thermodynamic properties and adsorption isotherms of arabica coffee. Journal of food processing
and preservation, 41(2):e12779, 2017.
ÖZDESTAN, Ö. et al. Differentiation of specialty coffees by proton transfer reaction-mass spectrometry. Food
Research International, 53(1):433-439, 2013.
RAMÍREZ-MARTÍNEZ, A. et al. Water transport in parchment and endosperm of coffee bean. Journal of
Food Engineering, 114(3):375-383, 2013.
REIS, N.; FRANCA, S. A.; OLIVEIRA, S. L. Discrimination between roasted coffee, roasted corn and coffee husks by diffuse reflectance infrared Fourier transform spectroscopy. LWT - Food Science and Technology, 50(3):715-722, 2013.
RENDÓN, M. Y.; GARCIA, S. T. J.; BRAGAGNOLO, N. Impact of chemical changes on the sensory characteristics of coffee beans during storage. Food Chemistry,
SCHMIDT, S. J.; LEE, W. J. Comparison between water vapor sorption isotherms obtained using the new dynamic dewpoint isotherm method and those obtained using the standard saturated salt slurry method. International
Journal of Food Properties, 15(2):236-248, 2012.
SHIGEHISA, T.; INOUE, T.; KUMAGAI, H. Mathematical model of water sorption isotherms of UBC. Fuel
Processing Technology, 131:133-141, 2015.
SHITTU, T. A. et al. Water vapor adsorption characteristics of starch-albumen powder and rheological behavior of its paste. Nigerian Food Journal, 33(1):90-96, 2015. SORMOLI, M. E.; LANGRISH, T. A. G. Moisture sorption
isotherms and net isosteric heat of sorption for spray-dried pure orange juice powder. LWT - Food Science and
Technology, 62(1):875-882, 2015.
SPECIALTY COFFEE ASSOCIATION OF AMERICA SCAA. Coffee standards, water activity standard. 2019. Available on: https://sca.coffee/research/coffee-standards. Access on: 18 August. 2019
SPECIALTY COFFEE ASSOCIATION OF AMERICA SCAA. Protocols: coffee cupping standards, 2015. Available in: http://scaa.
org/?page=resources&d=cupping-standards. Access in: 22 March. 2019
TAPIERO, S. O.; TRUJILLO, B. D.; GUTIÉRREZ, G. N. Aplicación del proceso analítico jerárquico AHP para definir la mejor taza en evaluación de cafés especiales.
Coffee Science, 12(3):374-380, 2017.
TEIXEIRA, P. L.; ANDRADE, E. T. de; DEVILLA, A. I. Isosteric heat, entropy, and Gibbs free energy of pumpkin
seeds (Cucurbita moschata). Engenharia Agrícola, 38(1):97-201, 2018.
TOLESSA, K. et al. Prediction of specialty coffee cup quality based on near infrared spectra of green coffee beans.
Talanta, 150:367-374, 2016.
VELASQUEZ, S. et al. Determination of the complex permittivity of cherry, pulped, green, and roasted coffee using a planar dielectric platform and a coaxial probe between 0.3 and 6 GHz. International Journal of Food
Properties, 21:1332-1343, 2018.
VIGANÓ, J. et al. Role of enthalpy and entropy in moisture sorption behavior of pineapple pulp powder produced by different drying methods. Thermochimica Acta, 528:63-71, 2012.
WEI, F.; TANOKURA, M. Chemical changes in the
components of coffee beans during roasting. In: PREEDY, V. R. Coffee in Health and Disease Prevention, Chapter 10, p.83-91, 2015.
YIN, X. et al. Comparative micro-structure and sorption isotherms of rice straw and wheat straw. Energy and
Buildings, 173:11-18, 2018.
YOGENDRARAJAH, P. et al. Moisture sorption isotherms and thermodynamic properties of whole black
peppercorns (Piper nigrum L.). LWT - Food Science and
Technology, 64(1):177-188, 2015.
ZHANG, L.; SUN, D. W.; ZHANG, Z. Methods for measuring water activity (aw) of foods and its
applications to moisture sorption isotherm studies.
Critical Reviews in Food Science and Nutrition,