An empirical study on the
relationship between the working
capital policies and corporate
profitability
The case of the Portuguese Footwear Sector
Masters Final assignment in the modality of dissertation presented to Católica Porto Business School to obtain the Master´s degree in Finance
by
Adriana da Costa Carvalho
under the orientation of Prof. Luís Krug Pacheco
Católica Porto Business School April 2018
Acknowledgments
At the end of this journey, I can but offer my heartfelt thanks to the persons who have supported me through it.
To my supervisor, Professor Luís Krug Pacheco, for the valuable and patient guidance, advice and encouragement along the path.
To Professor Ricardo Ribeiro, for the availability and willingness to help me when I needed.
To my parents, who have always been by my side, and without whom this dissertation couldn’t have happened.
Last, but not least, to my friends, for the infinite hours they spent listening to me, and for their tireless support.
Abstract
In the sphere of short-term decision-making, the decisions towards working capital hold a critical position.
This study aims to understand if the decisions regarding the working capital policies have an impact on the profitability of firms in the Portuguese Footwear sector. To do so, annual financial data of 737 non-listed firms in the sector was collected, during a range of 10 consecutive years (2007-2016).
The results of the OLS estimations for the first model revealed both a positive relationship between the degree of aggressiveness of working capital asset investment policies and corporate profitability, and a negative relationship between the degree of aggressiveness of working capital financing policies and corporate profitability.
Notwithstanding, through the estimation of the second model, the overall results of the study demonstrated that, if firms in this sector increase the aggressiveness of their working capital management policy, or strategy, namely by reducing the level of working capital to the minimum amount required to run the business, those are likely to obtain lower levels of profitability.
Keywords: Working Capital Policies, Corporate Profitability, Portuguese Footwear Sector.
Index
Acknowledgments ... iii
Abstract ... v
Index ... vii
Index of Tables ... viii
Chapter 1: Introduction ... 11
Chapter 2: Theoretical Framework ... 13
2.1 Managing the Working Capital Components ... 13
2.1.1Cash management ... 14
2.1.2 Inventory management... 16
2.1.3 Receivables management ... 19
2.2Short vs Long-term financing ... 22
2.2.1 Payables Management ... 23
2.3The Cash Conversion Cycle ... 25
Chapter 3: Literature Review ... 26
3.1 Aggressive vs Conservative Working Capital Policy ... 27
3.2 The relationship between profitability and working capital ... 30
Chapter 4: Methodology ... 36
4.1 Data and Sample ... 36
4.2 Hypothesis ... 37
4.3. Variables ... 37
4.3.1Explained and Explanatory Variables ... 38
4.3.2Control Variables ... 42
4.4Regression Models ... 43
Chapter 5: Empirical Results ... 44
5.1 Descriptive Statistic Analysis ... 44
5.2 Regressions Analysis ... 47
5.3 Discussion ... 51
Index of Tables
Table 1: Assessing the clients’ creditworthiness and reducing the effects of
default ... 20
Table 2: Variables used in the study... 38
Table 3: Descriptive Statistics Results ... 44
Chapter 1
Introduction
Often, when managers are planning the future of their company, the long-term financial decisions tend to be set as a top priority, while short-term financial decisions are generally overlooked. Yet, through the years, the analysts have been gathering evidence that short-term decisions are ought to be emphasized, as they constitute a key determinant for corporate success.
In the sphere of short-term decision-making, the decisions towards working capital, given by the difference between the firm’s current assets and current liabilities, hold a critical position. Through working capital, firms are able to finance their day-to-day operations and ensure that they will be capable to meet their short-term obligations. (Preve & Sarria-Allende, 2010).
According to Smith (1980), working capital management has a key role on firm’s profitability, liquidity, risk, and consequently, value. For that reason, it has been a target of close investigations. In addition, the authors that delve into this subject believe that if managers fully understand the role and the determinants of working capital, they can reduce the business risk, and improve performance. (Afza & Nazir, 2007)
Efficient working capital management is a crucial part on the overall corporate strategy to generate and increase shareholder value. Generally, companies try to maintain an optimal level of working capital that maximizes their value (Shin & Soenen, 1998; Deloof, 2003; Afza & Nazir, 2007).
Furthermore, for a large number of companies, a considerable part of the cash is invested in working capital and, more than that, accounts receivable and
several companies have significant amounts accumulated on accounts payable. Thus, it can be expected that the management decisions taken towards these components, would be reflected on corporate profitability. (Deloof, 2003)
Appuhami (2008) adds that, at a time whereby the market competition is constantly increasing, companies that effectively manage their working capital may use it as an element for competitive advantage, as they would be capable to react faster than their competitors to sudden changes in the market, for example sudden variations in the market interest rates.
This study is an extension to the research of Nazir & Afza (2009), as it has the purpose to understand if aggressive/conservative working capital policies have an impact on the profitability of non-listed firms in the Portuguese Footwear sector. In particular, the Portuguese Footwear sector is commonly known for the significance that the working capital components have in the firms’ balance sheet, which makes it suitable to the research purpose.
To do so, the study will be structured as follows. In the next chapter, a theoretical framework is provided, with crucial considerations about working capital management and the required concepts to a clear comprehension of the study. Chapter three concerns the literature review, and provides the published literature regarding the subject, along with a review on the previous published studies about the relationship between working capital and corporate profitability. The fourth chapter includes the methodology, data and sample, variables and features of the regression models used. In the fifth chapter, the empirical results of the study are provided and discussed. At last, chapter six presents the main conclusions of the study, along with the limitations and recommendations for future research.
Chapter 2
Theoretical Framework
2.1 Managing the Working Capital Components
Discussing the working capital policies of a given firm and industry, together with its relationship with corporate performance, is not to be possible without a background of working capital management, as in the literature the concepts of working capital management and working capital policies are intrinsically related.
Hence, the following section aims to theoretically support this study, and so it will focus on giving some important considerations about working capital, how firms should manage each component separately, along with the concepts considered necessary to a clear comprehension of the study.
Following Lamberson (1995), the relevance of working capital management in the literature has been increasing through the years, such that nowadays it should be seen as a crucial piece for every company’s success. Thus, how managers handle it, the attention and time spent on the monitoring process of working capital components and the type of policies applied, can be responsible for a company’s health.
According to Van Horne & Wachowicz (2008) when financial analysts refer to working capital, is the level of current assets of the firm they are concerned with. Working capital represents for a firm, the difference between the level of current assets and current liabilities. Given that, when we talk about working capital management from a financial perspective, we are taking in consideration the
sheet, the required financing to support this level of current assets. Hence, in managing working capital the companies face two crucial issues: to determine what would be the optimal level of investment in current assets; and to define the proper financing term to support it. (Van Horne & Wachowicz, 2008)
Primarily, regarding the optimal level of investment in current assets, the working capital components to be consider are cash and marketable securities, receivables and inventory. Moreover, managers must take in consideration that, in order to reach an optimal level of working capital, they must strike a balance between risk and efficiency, and that such balance cannot exist without continuous monitoring the level of investment in each component. (Afza & Nazir, 2007)
2.1.1 Cash management
When managing cash and marketable securities, it is important to reinforce that usually, ceteris paribus, a firm should accelerate the cash collection and decelerate the payments. This is an intuitive thought, since that doing it, allows managers to obtain and use the money sooner and, simultaneously, delaying payments means having money for a longer period, which can be very useful for firms, as long as it does not harms the relationship and trade credit conditions with the suppliers. (Van Horne & Wachowicz, 2008)
The main reason, according to Preve & Sarria-Allende (2010) for companies to hold assets is the expectation that those assets would generate future cash-flows, or future returns. In this perspective, a firm can, for example, set large receivables and have a diversified and large inventory, in order to attract customers and also improve future sales. Still, if the firm goal is to create and distribute value for their shareholders, what type of motives might the firms have to hold cash? As suggested by Van Horne & Wachowicz (2008) based on John Maynard Keynes’
theory, companies have three distinct motives to hold on cash: transaction, speculative and precautionary motives.
The first motive refers to circumstances when firms may decide to hold cash, or marketable securities, to ensure payments for general expenses, such as wages, taxes or purchases. The second speculative motive is associated with the idea of holding cash, so that the firm may be able to use it to explore future growth opportunities, for example investing in R&D, which will expose the firm to high levels of returns. The precautionary reasons that may lead firms to choose to hold cash are intrinsically related with how risky a firm is. In order to protect the firm from the uncertainty of cash flows, or sudden fluctuations in the business environment, riskier firms will need to hold higher amounts of cash, as their future is more “unpredictable”, than less risky ones. Firms decide to hold cash to ensure they will be able to answer unexpected cash needs such as, for example, a supplier that is going through a recession period, and that usually works with deferred payments, exceptionally, requesting for a prompt payment. (Van Horne & Wachowicz, 2008)
However, holding a high level of cash than the intrinsically necessary amount to hold might bring problems to companies, as it would lead them to incur in opportunity costs. As mentioned by Ross, Westerfield, & Jordan (2010) regardless of the firms holding cash in currency or deposits, the opportunity costs will arise from the interest income the firms would earn in giving the cash another utility, as for example invest it in marketable securities. Following the perspective given by the authors, to determine the optimal amount of cash balance, the companies must achieve a balance between the costs and the benefits of holding cash, which will, for sure, be distinct as we move from one company to another.
As in cash management, managing all working capital components and defining the optimal level of each component to keep, requires companies to continually do a balance of holding a specific amount of every component. We will see that the same happens in inventory management.
2.1.2 Inventory management
When managing inventories, one must primarily consider that, for the majority of the regular manufacturing firms, inventories represent a considerable percentage of their assets, and so it deserves the managers’ best attention. Given that, how should managers behave in managing inventories? The literature regarding the subject defines a set of techniques used for inventory management, and we will, based on Preve & Sarria-Allende (2010) approach briefly expose some of them.
For some companies that operate in market environments that allow them to access and sell goods almost instantly, they find it unnecessary to define a specific inventory policy or technique. Alternatively, these type of companies decides to purchase goods or raw materials, as they need them in the production process. This inventory management technique, often called “Just-In-Time”, might, however, result in several complications for the firms, as if there are atypical demands, or sudden losses in the supply chain the whole production might stop, and the firm won’t be able to answer to the customers’ requests. It is important to consider that this technique might reduce the storage and handling costs of having inventories, but will also highly increase the levels of risk for the firm. (Preve & Sarria-Allende, 2010)
This second technique is frequently used, involves the request for large quantities of goods or raw materials to suppliers. By having a large inventory, managers are supporting the production process, as they guarantee there will be
enough products in stock to answer their current and future customer needs. In the same way, requesting for larger orders usually allows managers to obtain quantity discounts. The literature regarding the subject aims that, due to the mentioned benefits, generally managers are biased to maintain large inventories. Yet, holding a larger level of inventory will clearly increase the costs of carrying of the company, as well as storage and handling costs. (Preve & Sarria-Allende, 2010)
Other firms, instead, go for the Economic Order Quantity (EOQ) technique. This technique aims to reach an optimal level on inventories through the minimization of a firms’ total carrying and shortage costs. According to Ross, Westerfield, & Jordan (2010), to do so, it relies on a set of assumptions:
1) Managers must assume that the firm sells inventories at a fixed rate, until the inventory level reaches zero, and at that moment, the firm will restock at the optimal level;
2) The carrying costs are directly proportional to inventories; 3) Firms never run short on inventory;
4) The firm’s restocking costs are fixed;
Further, from the following parities:
𝑇𝑜𝑡𝑎𝑙 𝐶𝑎𝑟𝑟𝑦𝑖𝑛𝑔 𝐶𝑜𝑠𝑡𝑠 = 𝐴𝑣𝑒𝑟𝑎𝑔𝑒 𝑖𝑛𝑣𝑒𝑛𝑡𝑜𝑟𝑦 ∗ 𝐶𝑎𝑟𝑟𝑦𝑖𝑛𝑔 𝑐𝑜𝑠𝑡𝑠 𝑝𝑒𝑟 𝑢𝑛𝑖𝑡 𝑇𝑜𝑡𝑎𝑙 𝑅𝑒𝑠𝑡𝑜𝑐𝑘𝑖𝑛𝑔 𝐶𝑜𝑠𝑡𝑠 = 𝐹𝑖𝑥𝑒𝑑 𝑐𝑜𝑠𝑡 𝑝𝑒𝑟 𝑜𝑟𝑑𝑒𝑟 ∗ 𝑁𝑢𝑚𝑏𝑒𝑟 𝑜𝑓 𝑜𝑟𝑑𝑒𝑟𝑠
𝑇𝑜𝑡𝑎𝑙 𝐶𝑜𝑠𝑡𝑠 = 𝐶𝑎𝑟𝑟𝑦𝑖𝑛𝑔 𝐶𝑜𝑠𝑡𝑠 + 𝑅𝑒𝑠𝑡𝑜𝑐𝑘𝑖𝑛𝑔 𝐶𝑜𝑠𝑡𝑠
By replacing the average inventory given through a proportion, e.g. Q/2, and replace the other variables on the formula with the provided data, the managers would reach the value of Q* which will be the reorder quantity that minimizes the total inventory cost. (Ross, Westerfield, & Jordan, 2010)
The last technique we find it interesting to explain is the ABC approach. The ABC is an inventory management technique in which the firm divides its inventory in three distinct groups: A, B, and C, based on their weight on inventory value. Items that have a large effect on the inventory value are represented in class A; class B includes items with less effect in the inventory value; and class C, otherwise consists in items that have little effects on the inventory value. This approach allows firms to understand which goods are contributing the most to their inventory total value, class A’s goods, and intuitively establish a stricter control towards them. (Preve & Sarria-Allende, 2010)
Regardless of the adopted technique, generally defining an optimal level of inventories for companies to keep would be extremely hard, since every firm has different orders and production requirements, according to the market segment that it belongs.
Furthermore, Koumanakos (2008) argues that inventories may be seen as both an asset, and a liability. The reason behind that statement is that maintaining a higher level on inventory leads firms to incur in multiple costs, as they are automatically forced to have a physical space to store the goods, which represents increased storage and handling costs, along with more willingness to have possible losses on those goods. However, having a large inventory could also be seen as an advantage over other companies, since that it works as a shield for atypical demands, as well as for an inefficient management. Additionally, shortening inventories to a minimum, would increase the possibility of a breakdown in operations, as if a supplier is exceptionally late, or there are losses in the production process, the company may not be able to deliver the goods in the due date. This scenario could bring severe consequences for firms, as it would harm the relationship with customers, which represents one of the most fundamental pieces on a company’s success. (Koumanakos, 2008)
Hence, as previously mentioned, regardless of the technique the companies select for managing inventories, it is important to highlight that the managers won’t be able to reach the optimal level of inventories to hold without frequently do a balance between the benefits and costs of holding more, or less, inventories. This balance would only be possible through a continuous monitoring process. (Van Horne & Wachowicz, 2008)
2.1.3 Receivables management
Accounts receivable are, among all the current assets of a firm, the ones with a higher liquidity level, for that reason properly managing it becomes imperative.
For every firm, selling a product or service will represent cash entry. Still, some firms decide to charge it in the moment the product is sold, and have immediate cash entry from prompt payment, and others decide to extend credit to their customers, establishing a later due date for collections and creating an account receivable. Usually, everything else constant, the main reason for a firm to grant credit to its customers is that it will help to promote sales, since that late payments are seen as more attractive for customers. However, this practice can result in serious losses, as there is always a possibility the customer does not pay, or pays later than the due date, and from the moment the credit is granted, the firm its totally exposed to credit risk. Thus, when a firm chooses to grant credit to its customers it is crucial to define an appropriate credit policy.
To Van Horne & Wachowicz (2008) when deciding a firms’ credit policy there are some variables that managers must consider such as the length of the credit, what would be the cash discount in case of early payment. There is one, however, which we consider more meaningful to expose, in order not only to define a proper credit policy, but also to understand how managers can reach an optimal level in their accounts receivable: the assessment of the clients’ creditworthiness.
Source: Preve & Sarria-Allende (2010)
According to Preve & Sarria-Allende (2010), to ensure that the clients will meet their obligations on time, firms should assess their customers’ creditworthiness before granting credit, as they are exposed to high levels of risk by borrowing money to a customer whose ability to repay is unknown. Yet, even when managers evaluate the conditions to borrow credit to a client, they are reducing the probability of default, but they are still exposed to this type of risk. For this reason, the authors not only defined a set of steps for assessing a clients’ creditworthiness, as they recommend three different tools to reduce the effects that may arise from default, as follows.
Still, to have an optimal level on accounts receivables, managers face two challenges: not only define an appropriate credit policy, but also defining proper collection procedures, as well.
Assessing Clients’ Creditworthiness Mitigating the Effects of Default
1. Estimate the client’s potential of
future generation of cash flows
2. Analyze the client’s financial
statements
3. Analyze the information generated
in the financial markets
4. Analyze the information contained
in the client’s track record
5. Use some of the available default
prediction models
6. Align the incentives in the firm
1. Diversify the credit portfolio
2. Use techniques to increase the
liquidation value of the receivables
3. Receive contingent payments
“These procedures include such things as letters, faxes, phone calls, personal visits, and legal action. One of the principal policy variables is the amount of money spent on collection procedures.” (Van Horne & Wachowicz, 2008) Everything else constant, the more the firm spends in collection procedures, the less the probability of bad-debt losses to happen, and the shorter the average collection period. In the next section, we will see that some studies concluded that shortening the average collection period is likely to improve corporate performance.
The literature suggests that collection procedures should start as soon as possible, as firms would only benefit with receivables if there is actually cash entry. Nonetheless, managers must also have in mind that the collection procedures cannot start to soon, because if, for example, there is a customer who usually pays on time and is exceptionally late for that specific payment, he dislike to feel pressured, and doing it may harm the relationship with the firm. Managers should highly avoid such situations, because clients are one of the key components to their firms’ success.
Finally, Van Horne & Wachowicz (2008) state that the optimal collection and credit policies would be the ones that match marginal costs to the marginal gains. It won’t be possible to determine those optimal policies without diversifying them together, so that managers are able to balance the costs and gains of each, and understand what would be the type of policy that will maximize their returns. When they do, then they have reached the optimal level on accounts receivable.
2.2 Short vs Long-term financing
In line with Van Horne & Wachowicz (2008), the second issue that firms face in managing working capital, is to determine the proper financing terms that will support the investment in these current assets.
Based on the study of Mishra (2013) there are two different ways of financing the working capital requirements of a firm: resort to long-term or short-term debt. There will clearly be different costs and risks associated with both alternatives, since that each type of debt has different features.
Short-term debt has a maximum of one-year maturity, and it is often seen as debt used to finance a firms’ operating activity. Financing through short-term debt is usually cheaper, because interest rates are lower than the ones settle for long-term debt, according to the interest rate structure, which defines that those increase with maturity. In addition, Sturesson & Källum (2017) add that one may also prefer financing through short-term debt, because the terms are easier to renegotiate, as in the basis is a shorter period of time.
Still, although financing through short-term debt may be less expensive, this type of financing involves a greater amount of risk than the long-term one. This happens, because whenever a company decides to increase the weight of short-term debt in its balance sheet, it is equally increasing its refinancing risk, that arises from the fact the firm may not be capable to refinance its short-term debt obligations at the maturity of the loan. (Van Horne & Wachowicz, 2008)
In accordance to Van Horne & Wachowicz (2008), accounts payable are often used as a source of short-term financing and, since they arise from the firms’ daily operations, tend to increase as the volume of operations increases. Those would be explained with more detail in the subsequent point.
Long-term debt refers to debt obligations with maturity higher than a year - financial instruments such as bonds and debentures are classified as long-term
debt. (Jr. Guerard & Schwartz, 2007) As mentioned, due to their structure, interest rates for long-term debts are higher than the ones for short-term debt, as those increases with maturity. Moreover, Van Horne & Wachowicz (2008) claim that along with the higher costs for a long-term loan, firms may even pay interest over debt in periods when the cash is not necessary, which makes this type of financing clearly costly than short-term debt financing.
On other hand, the financing through long-term debt does not expose a firm to the refinancing risk, because the firm previously locks the terms of the loan until the maturity. Yet, even considering a lower level of risk, long-term financing is expensive and often harder to obtain, once that for firms to contract a long-term loan, they are subject to a meticulous approval process before the bank decides to concede the loan.
In order to decide the type of financing that would be suitable for the firm, a trade-off between the interest costs and risks of financing through short and long-term debt must be done. Managers should also consider other factors, as the business risk, the firms’ ability to generate cash flows, and the current and future economic conditions.
2.2.1 Payables Management
As mentioned in the previous point, accounts payable are frequently used as a short-term source of “financing” 1, especially in business firms. The Portuguese
Footwear sector it’s not an exception, on the contrary, accounts payable are the most common source of financing for firms in this sector and, as we’ll have the opportunity to see further, probably the most determinant factor of the working capital level for firms in this sector, as they carry substantial amounts. For that
reason, it is important to review some considerations regarding payables management.
According to Van Horne & Wachowicz (2008), nowadays most of suppliers that operate with business firms allow their buyers to access the goods without requiring prompt payment. Instead, they extend credit, commonly called trade credit, allowing customers to pay at a pre-established term, and often affording cash discounts for early payments. In these situations, where the buyers pay at term an account payable is created.
Thereby, in many businesses, accounts payable are often seen as a mean of short-term financing, because firms do not need to pay for the goods until after they are delivered. The dynamic makes suppliers more attractive for companies, since they aim to maximize free cash flow and delay cash outflows, which promotes the suppliers sales.
There is, however, a preconceived idea that this type of financing is not costly, but Preve & Sarria-Allende (2010) disagrees. Following the line of the authors, usually the suppliers offer a certain discount to customers who pay the invoices until a given period, e.g. they offer 5% to customers that pay within fifteen days, and else they pay the entire amount in the due date, in 30 days. Hence, when cash discounts are offered but not taken, suppliers are charging a premium of 5% for a fifteen days credit, and by calculating the yearly interest rate implicit in this operation, would conclude that trade credit is, in fact expensive, in this case.
Notwithstanding, there are several advantages in short-term financing through accounts payable, but the one that firms’ prize the most is availability. (Van Horne & Wachowicz, 2008) In accordance the authors, this type of financing does not require firms to spend time in negation processes, since that new accounts payable will gradually replace the old ones, as prior debts are paid and new ones are contracted, as this would only depend on the firms’ need of
financing and will. In addition, compared to other sources of credit, particularly financial credit, late payments have less impact in the buyers’ credit reputation. Therefore, firms must weigh the costs against the benefits of trade credit before using it as a source of financing.
2.3 The Cash Conversion Cycle
The last fragment on this theoretical framework is the concept of Cash Conversion Cycle. This concept was first introduced by Richards & Laughlin (1980) and, in a short way, we can define the Cash Conversion Cycle as being the time span between the moment the company buys raw-materials from the suppliers, sales them as finished consumption goods, and collects the accounts receivables. In other words, the time window between the moment the company spends and collects the cash, which can work as a good representative measure of working capital management, as it indicates the amount of time the cash is stuck in working capital.
As follows, in order to calculate the Cash Conversion Cycle, we need to sum the accounts receivable period to the inventory period and subtract the accounts payables period. Depending on the length of the cycle and the management practices that are applied, this concept can maximize corporate performance and increase the company’s growth.
𝐶𝑎𝑠ℎ 𝐶𝑜𝑛𝑣𝑒𝑟𝑠𝑖𝑜𝑛 𝐶𝑦𝑐𝑙𝑒 (𝐶𝐶𝐶) = 𝐴𝑅𝑃 + 𝐼𝑁𝑃 − 𝐴𝑃𝑃 where: 𝐴𝑐𝑐𝑜𝑢𝑛𝑡𝑠 𝑅𝑒𝑐𝑒𝑖𝑣𝑎𝑏𝑙𝑒 𝑃𝑒𝑟𝑖𝑜𝑑 (𝐴𝑅𝑃) =𝐴𝑐𝑐𝑜𝑢𝑛𝑡𝑠 𝑟𝑒𝑐𝑒𝑖𝑣𝑎𝑏𝑙𝑒 𝑆𝑎𝑙𝑒𝑠 ∗ 365 𝐴𝑐𝑐𝑜𝑢𝑛𝑡𝑠 𝑃𝑎𝑦𝑎𝑏𝑙𝑒 𝑃𝑒𝑟𝑖𝑜𝑑 (𝐴𝑃𝑃) =𝐴𝑐𝑐𝑜𝑢𝑛𝑡𝑠 𝑝𝑎𝑦𝑎𝑏𝑙𝑒 𝑃𝑢𝑟𝑐ℎ𝑎𝑠𝑒𝑠 ∗ 365 𝐼𝑛𝑣𝑒𝑛𝑡𝑜𝑟𝑦 𝑃𝑒𝑟𝑖𝑜𝑑 (𝐼𝑁𝑃) = 𝐼𝑛𝑣𝑒𝑛𝑡𝑜𝑟𝑦 ∗ 365
Since 1980, the authors that turned the Cash Conversion Cycle into a comprehensive model, Richard & Laughlin (1980), suggested that an efficient working capital management would produce shorter Cash Conversion Cycle, which can result in higher corporate returns. (Temtime, 2016)
In the literature, as we will see in next chapter, most of the studies that investigate the relationship between working capital management and profitability use this concept as a comprehensive measure of working capital management. Some of them, like Sabri (2012), also connect the concept with the working capital policy. For that reason, and in order to promote a clearer view of the paper, we find it necessary to expose the given considerations about the Cash Conversion Cycle.
Chapter 3
Literature Review
As previously mentioned, there is an extensive worth reading literature about working capital management and practices, about what should be the optimal level of each one of its components and, specially, what would be the cause-effect relationship between those and corporate profitability. Further, literature also concerns a long debate regarding what should be the managers positioning towards working capital, what kind of policies should the firms adopt, with the main goal of maximizing their returns and create value for the shareholders. Should it be an aggressive policy? Where there are higher expected returns, but the firm it’s also exposed to a high level of risk? Or otherwise, should it follow a more conservative policy with the restriction of lower returns, but,
simultaneously, concerning a lower level of risk? Those questions are an object of this study.
Consequently, many authors developed empirical and theoretical studies with focus on the effects of aggressive or conservative working capital policies and working capital management on corporate profitability, across several industries and countries. Most of the authors found the same significant statistical relationship between the measure of working capital management, mostly the Cash Conversion Cycle, and corporate profitability. Still, the components of the Cash Conversion Cycle have different relationships with corporate profitability so, for this reason, a few of the published studies which will be described below, investigated the effects of each component on the firms’ returns separately.
This chapter aims to expose the published literature regarding the subject. Mainly, it will include crucial literature and considerations about aggressive and conservative working capital practices, or policies, required to understand the results of this study. Moreover, it will also review previous published studies regarding the relationship between both working capital policies, working capital management and corporate profitability.
3.1 Aggressive vs Conservative Working Capital Policy
When considering which type of policy would suit better in a company, managers should have in mind that there is no predesigned perfect policy to adopt. Moreover, the managers’ approach towards working capital shouldn’t be neither fixed nor inflexible, but otherwise be adjustable and versatile, so that when the company faces changes in the external or internal environment or even when the economy conditions change, the strategy may be able to change as well.
need to have in mind that, as every financial decision, a risk-return analysis needs to be consider. (Brigham & Ehrhardt, 2010)
For Nyabuti & Alala (2014) in order to reduce the Cash Conversion Cycle, and increase corporate profitability, a company must define an appropriate working capital policy.
According to Afza & Nazir (2007), if a firm defines either a low level of current assets as percentage of total assets, or, from the financing point of view, a high level of current liabilities as percentage of total liabilities, it is following an aggressive working capital management policy. The managers should carefully define the level of current assets of the firm, because having a low level of current assets will increase the firms’ liquidity risk, but detaining an extreme level of current assets may also decrease firms’ profitability.
Hence, everything else constant, an aggressive working capital policy is associated to a high-risk high-return strategy. Those features make this type of strategy suitable for companies that operate in stable markets with predictable cash flows. (Temtime, 2016) On the other hand, the literatures considers that a conservative working capital policy is safer, since that it supposes a higher investment in current assets, that will reduce the stock out risk, but simultaneously sacrifices profitability, as the corporate returns are expected to be lower. (Weinraub, J. H. & Visscher, 1998) These characteristics make conservative working capital policies more appropriate for companies operating under volatile markets with unpredictable cash flows. (Temtime, 2016)
Moreover, it is important to understand that, when following an aggressive policy, the extra returns that firms are exposed to, are, actually, extra returns by means of costs reduction. As mentioned by Weinraub, J. H. & Visscher (1998), being aggressive towards working capital exposes firms to a higher level of risk, which arises from the fact that, to obtain the same amount on sales, firms will minimize their investment in current assets. When attending the formula of the
Residual Income (RI), we conclude that by reducing a firm’s level of investment in current assets, there would be less invested capital, which will result in a lower capital charge, in absolute values, and therefore in a greater Residual Income.
𝑅𝑒𝑠𝑖𝑑𝑢𝑎𝑙 𝐼𝑛𝑐𝑜𝑚𝑒 (𝑅𝐼) = 𝑁𝑒𝑡 𝑂𝑝𝑒𝑟𝑎𝑡𝑖𝑛𝑔 𝑃𝑟𝑜𝑓𝑖𝑡 𝐴𝑓𝑡𝑒𝑟 𝑇𝑎𝑥𝑒𝑠 (𝑁𝑂𝑃𝐴𝑇) − 𝐼𝑛𝑣𝑒𝑠𝑡𝑒𝑑 𝐶𝑎𝑝𝑖𝑡𝑎𝑙 ∗ 𝑊𝑒𝑖𝑔ℎ𝑡𝑒𝑑 𝐴𝑣𝑒𝑟𝑎𝑔𝑒 𝐶𝑜𝑠𝑡 𝑜𝑓 𝐶𝑎𝑝𝑖𝑡𝑎𝑙 (𝑊𝐴𝐶𝐶)
For instance, to adopt a “Just-in-Time” strategy for inventory management is considered an aggressive working capital policy. This happens, because having an inventory working in a “Just-in-Time” basis, means that the firm would only receive the goods as they are needed in the production process, which logically implies a reduction in the inventory handling, and storage costs, but simultaneously supports an additional level of risk.
When a company decides to operate under this type of inventory management strategy, managers must be aware that any mistake in the supply chain can result in a production breakdown, as well as if there are sudden customers’ requests, the inventory may not be capable to meet the customers’ needs. Still, this type of policy foresees higher returns, as having a shorter inventory reduces the amount of investment in working capital and results in lower capital charges, as explained.
Finally, Temtime (2016) considers that the advantages/disadvantages that arise from the implementation of aggressive/conservative working capital policies highly depend on the management ability to define a policy that is in line with the firms’ internal operations and external environment. In that way, the firms that operate in stable markets and adopt an aggressive working capital policy are likely to have a shorter Cash Conversion Cycle, with higher probability of being profitable. On the other hand, firms that follow a conservative working capital policy, present longer conversion periods for inventory and receivables,
which makes them likely to have a higher Cash Conversion Cycle and, as a result, lower probability of being profitable.
3.2 The relationship between profitability and working
capital
Jose, Lancaster, & Stevens (1996) developed a study where they explored the relationship between the profitability and management of ongoing liquidity needs, here represented by the Cash Conversion Cycle. Using a large sample of companies during a 20-year period, they concluded that, putting the results of multiple regression, data, and correlation analysis together, those suggested that more aggressive liquidity management, through a shorter Cash Conversion Cycle, leads firms in several distinct industries to obtain higher returns.
Shin & Soenen (1998) investigated the relationship between the Cash Conversion Cycle and corporate profitability. They used a large sample of American firms for the period 1975-1994, and their results revealed a strong negative relation between the two measures – which means that, in order to create value for the company and their shareholders, managers should reduce the Cash Conversion Cycle.
Weinraub & Visscher (1998) collected a sample that included financial data from US firms in 10 distinct industry groups to investigate the relative relation between the aggressive and conservative working capital policies among the several industries, during the period 1984-1993. Their findings showed that, between industries, both current asset management policies and liabilities management present significant differences. Moreover, the authors found a strong negative correlation between industry asset and liability policies. The results also indicated that usually, when firms follow an aggressive working
capital asset policy, it tends to be balanced with the use of a conservative financing working capital policy.
Deloof (2003) collected financial data from Belgian non-financial firms during the period 1992-1996, in order to figure the relationship between working capital management and firms’ profitability, using the Cash Conversion Cycle to measure working capital management. The findings showed that if managers reduced the numbers of days of both accounts receivable and inventories to a certain amount, this would lead the firm to have higher returns, as they decrease their storage costs and, simultaneously, are able to have and apply cash earlier. Regarding the accounts payable, the researcher found that there is also a negative relationship between those and profitability, suggesting that firms that pay early to their suppliers seem to be more profitable than the ones that pay later.
Lazaridis & Tryfonidis (2006) collected a sample of companies listed in the Athens Stock Market Exchange from the 2001-2004 period, in order to examine the relationship between working capital management, measured by the Cash Conversion Cycle, and profitability of the firm. The measure of profitability used was gross operating profit, and the findings showed a significant negative correlation between this measure and the Cash Conversion Cycle. Furthermore, they concluded that by efficiently controlling the components of the Cash Conversion Cycle, managers could add value to the shareholders.
In Spain, García-Teruel & Martínez-Solano (2007) have done a research with the purpose to figure the effects of working capital management on corporate profitability of SMEs Spanish firms, for the 1996-2002 period. To do so, the authors decided to use Return on Assets (ROA) as a measure of the firm’s profitability. By regressing the model, evidences showed that there is a statistically significant negative relationship between both inventory period and number of accounts receivable in SMEs, which suggests that by reducing those
Furthermore, as the majority of the exposed studies in this section, results showed that decreasing the length of the Cash Conversion Cycle to an optimum level, would lead SMEs to increase corporate profitability.
Regarding the decision of adopting an aggressive or conservative policy in managing working capital, Afza & Nazir (2007) investigated the relationship between aggressive/conservative working capital policies, its implicit risk, and firm’s profitability. Using a sample of public firms listed at the Karachi Stock Exchange (KSE) for the 1998-2005 period, they found a negative relationship between aggressiveness of the working capital investment and financing policies and profitability. This negative relationship means that, by following an aggressive policy towards working capital, the firm’s returns would be negative. Findings confirm the results of Carpenter & Johnson (1983). Moreover, no significant relationship was found between firm’s risk and the level of current assets and liabilities.
In Pakistan, Nazir & Afza (2009) investigated how working capital management policies, could influence a firm’s profitability. To do so, they collected annual financial from non-financial firms listed on the Karachi Stock Exchange, for the 1998-2005 period. Moreover, the authors estimated the impact of working capital investment and financing policies on firms’ profitability, through separate estimation models, where the profitability measures used were Tobin’s q and Return on Assets. Their findings showed that both working capital investment and financing policies were statistical significant, which indicates that those had an impact on the performance measures. Furthermore, the results found a negative relationship between the rate of aggressiveness of working capital policies and both Return on Assets and Tobin’s Q, suggesting that follow an aggressive investment and financing working capital policy would lead the firm to yield negative returns.
Gill, Biger & Mathur (2010), extended the research made by Lazaridis & Tryfonidis, concerning the relationship between the components of working capital management and profitability. The selected sample includes data from American companies listed on the New York Stock Exchange, through the 2005-2007 period. Gross operating profit was used as a profitability measure, and the results exhibit a negative relationship between accounts receivables and this measure – implying that, if a firm decelerates the process of collecting the receivables, this will lead the firm to decrease their profitability. Despite, a positive relationship between the Cash Conversion Cycle and profitability was found, which suggests that the bigger the length of the Cash Conversion Cycle the higher the firms’ returns – this conclusion differs from the majority of the findings exposed along the other studies. Moreover, results also showed that through an efficient management of the Cash Conversion Cycle, and an ideal level of accounts receivables, managers would be able to increase their firms’ value.
Mathuva (2010) studied the effects of working capital management components on firm’s profitability, as well. To do so, he collected a sample with annual financial data from firms listed on the Nairobi Stock Exchange in Kenya for the 1993-2008 period. Regarding the length of the Cash Conversion Cycle and its components, the results of the study revealed a negative relationship between both the number of days accounts receivables and the Cash Conversion Cycle with profitability, here measure by the net operating profit of the firms. Besides, the author claims that if the managers were able to increase the inventories to a proper level, this would also create value for the shareholders.
Al-Shubiri (2011) explored the relationship between aggressive and conservative working capital practices, risk, and profitability of 59 industrial firms and 14 banks listed on the Amman Stock Exchange, for the 2004-2008
policies, a negative relationship with corporate profitability, suggesting that if firms followed aggressive strategies towards working capital, they would yield negative returns. Further, the relationship between the operating and financial risks and the level of current assets and liabilities was found to be not statistically significant for the given firms.
In Asia, particularly in Thailand, Napompech (2012) collected financial data from a sample of firms listed on the Stock Exchange of Thailand, during the 2007-2009 period. The aim of this research was to study the effects of working capital management on firm’s profitability, which was represented by the correspondent measure, gross operating profit. Results showed that, with concern to the Cash Conversion Cycle, there is a negative relationship between the gross operating profit and both receivables collection period and inventory conversion period. Those conclusions confirm the ones exposed by Samiloglu & Demirgunes (2008), for example, meaning that a shorter Cash Conversion Cycle could lead managers to increase the firms’ profitability. Moreover, the researcher also concluded that the firms’ profitability, measured by the gross operating profit, continuously changes as we move from one industry to another.
Al-Mwalla, M. (2012), developed a study that included financial annual data from firms listed in Amman Stocks Market, for the 2001-2009 period, in order to understand the impact of the working capital aggressive and conservative policies on the firms’ returns and value. The findings showed a positive relationship between a conservative investment policy and firms’ profitability, meaning with this that following a conservative investment policy has a positive impact on corporate performance. Further, regarding the financing policy, the findings were that having an aggressive financing policy affects negatively corporate profitability.
In the Latvian context, Arbidane & Ignatjeva (2012) investigated the relationship between the working capital management components and
profitability of Latvian firms. To do so, the authors collected data from the annual reports of the analyzed firms, for the 2004-2010 period. Results revealed significant negative correlation between the component receivables collection period and the Return on Assets, and a less significant one between gross operating profit and receivables collection period. Still, they concluded that the Cash Conversion Cycle and Return on Assets also presented a negative, but insignificant coefficient.
Sabri (2012) studied the impact of a lower or a higher Cash Conversion Cycle on the profitability of a small sample of Jordanian industrial firms listed at the Amman Stock Exchange, for the 2000-2007 period. The results of this study showed that a reducing the length of the Cash Conversion Cycle leads firms to get higher levels of profitability. The results were in agreement with Jose, Lancaster & Stevens (1996), since they verified that following an aggressive policy increases corporate profitability. In addition, the findings are consistent with Deloof (2003) as they indicate that firms with lower accounts receivable periods reach higher returns.
Bei & Wijewardana (2012) studied the practices regarding the working capital policy in Sri Lankan context. From a sample of firms listed in the Colombo Stock Exchange, during the 2002-2006 period, this study had the purpose to understand the influence of a working capital policy choice in firms’ liquidity, efficiency and profitability. They settled three different working capital policy practices, an aggressive, conservative and matching one, and the evidences showed different values for firm profitability, liquidity and efficiency, with regard to each type of practice, suggesting that the working capital practices have a statistically significant impact at both profitability, liquidity and efficiency levels of the analyzed firms.
and the measures of working capital management and corporate profitability founded a statistical significance among the analyzed variables. Moreover, in almost every studies the authors founded a negative relationship between the Cash Conversion Cycle and corporate profitability, indicating that shortening the length of the Cash Conversion Cycle, will leads companies increase their profitability. The results regarding which type of policy yields higher returns, however, are not consensual. This paper is an extension to the research of Nazir & Afza (2009), as it investigates how aggressive/conservative working capital policies may influence the profitability of firms in the Portuguese Footwear sector.
Chapter 4
Methodology
The following section will provide the data and sample, variables, features of the regression models and all the required calculations to obtain the empirical results.
4.1 Data and Sample
All the data in the study was collected from SABI Platform database, with the exception of the variable that represents the growth of Portugal’s Gross Domestic Product (GDP), which will be presented further in section 4.3, and was retrieved from PORDATA database.
The initial sample included cross-section data, measured in thousands of euros, from the financial statements of all non-listed firms in the Portuguese Footwear Industry for the 2007-2016 period. Since this study aims to analyze the
relationship between the working capital policies and the profitability of firms during a range of 10 consecutive years (2007-2016), the data was converted from cross-section to panel data. Moreover, to build a clean analysis, observations with values that may arise from errors, as negative accounts payable, were removed from the sample.
The final sample contained 7368 observations with panel data from the financial statements of 737 non-listed firms in the Portuguese Footwear Sector, for the 2007-2016 period.
4.2 Hypothesis
As previously mentioned, this study aims to understand if working capital policies of firms in the Portuguese Footwear sector have an impact on their profitability. Then, the hypotheses are defined as follows:
H0 (Null Hypothesis): There is no statistical significant relationship between the working capital policies and the profitability of firms in the Portuguese Footwear sector.
H1: There is a statistical significant relationship between the working capital policies and the profitability of firms in the Portuguese Footwear sector.
4.3. Variables
The table below exhibits all the variables that were used in the study, along with the formulas required to compute them and the correspondent abbreviations that will be used, in brackets.
4.3.1 Explained and Explanatory Variables
The methodology in this study uses the aggressiveness of investment and financing policies as considered by Weinraub, J. H. & Visscher (1998) and Nazir & Afza (2009).
As mentioned in the literature review (Chapter 3), being aggressive in working capital management is maintaining a minimum amount on working capital, which is a positioning that leads companies to achieve higher returns, but has a cost embedded. The cost associated with these extra returns is precisely the extra amount of risk that companies that implement an aggressive policy, will face.
Thus, saying that a firm is aggressively managing its investment in working capital is assuming that, to obtain the same amount on sales, the firm we will reduce the investment in current assets (accounts receivable, cash and equivalents and inventory), which can lead them to achieve higher returns, but
Variables Formula
Return on Assets (ROA) 𝐸𝐵𝐼𝑇 / 𝑇𝑜𝑡𝑎𝑙 𝐴𝑠𝑠𝑒𝑡𝑠
Aggressive Investment Policy (AIP) Total Current Assets/ Total Assets Aggressive Financing Policy (AFP) Total Current Liabilities / Total Assets Working Capital to Total Assets
(WCTA)
Working Capital / Total Assets
Firms’ Size (Size) ln (Total Assets)
Firms’ Leverage (Lev) Total Debt / Total Assets Sales Growth (SalesG) (Salest−1− Salest) / Salest−1
Portugal’s GDP Growth (GDPG) (GDPt−1− GDPt) / GDPt−1
adds a greater liquidity risk. That way, as applied by Weinraub, J. H. & Visscher (1998) and Nazir & Afza (2009) we will consider the following:
Aggressive Investment Policy (AIP): assumes that the firm minimizes their capital investment in current assets vs fixed assets.
On the other hand, having a more Conservative Investment Policy means that the firm is investing a greater proportion in liquid assets, which will be less risky, but also includes the opportunity cost of having less profitability. The ratio of total current assets to total assets was used to measure the degree of aggressiveness of working capital investment policies, as follows.
𝐴𝐼𝑃 =𝑇𝑜𝑡𝑎𝑙 𝐶𝑢𝑟𝑟𝑒𝑛𝑡 𝐴𝑠𝑠𝑒𝑡𝑠 (𝑇𝐶𝐴) 𝑇𝑜𝑡𝑎𝑙 𝐴𝑠𝑠𝑒𝑡𝑠 (𝑇𝐴)
The lower the value of this ratio, the greater the degree of aggressiveness of a company working capital investment policy. Otherwise, if the value of the ratio increases, the degree of aggressiveness of the working capital investment policy decreases, and the management is said to be relatively more conservative.
From the liabilities perspective, according to Weinraub, J. H. & Visscher (1998) and Nazir & Afza (2009) follow an Aggressive Financing Policy (AFP) is assuming that the firm will finance through higher levels of current liabilities, or short-term debt, that is usually cheaper, instead of long-term debt. Where financing through short-term debt supposes less capital costs, but there is a higher probability for short-term liquidity problems to arise. (Weinraub, J. H. & Visscher, 1998)
However, as explained in the theoretical framework (Chapter 2) firms in the Portuguese Footwear sector are more likely to finance their operations through accounts payable, obtaining credit from their suppliers to run the business, which
For that reason, we will give an alternative interpretation to the original Aggressive Financing Policy (AFP) introduced by Weinraub, J. H. & Visscher (1998), and state that a firm follows an aggressive financing policy when it reports considerable amounts on accounts payable.
Contrarily, having a more Conservative Financing Policy is assuming lower values of current liabilities in proportion to the total assets, meaning that firms are likely to be more conservative in working capital management if they present lower amounts on accounts payable. The ratio of total current liabilities to total assets was used to measure the degree of aggressiveness of working capital financing policies, as follows.
𝐴𝐹𝑃 =𝑇𝑜𝑡𝑎𝑙 𝐶𝑢𝑟𝑟𝑒𝑛𝑡 𝐿𝑖𝑎𝑏𝑖𝑙𝑖𝑡𝑖𝑒𝑠 (𝑇𝐶𝐿) 𝑇𝑜𝑡𝑎𝑙 𝐴𝑠𝑠𝑒𝑡𝑠 (𝑇𝐴)
The higher the value of this ratio, the greater the degree of aggressiveness of a firms’ working capital financing policy. Instead, the lower the value of the ratio the more conservative the firm is likely to be towards the financing of its working capital.
Furthermore, in the second model, we will replace the explanatory variables AIP and AFP by the variable WCTA, which would be the Working Capital to Total Assets ratio.
Since that working capital is the difference between a firm’s current assets and current liabilities, this variable can provide a measure of firms’ liquidity. (Temtime, 2016) In addition, since that an aggressive policy is supposing that firms will operate with reduced amounts of working capital, the Working Capital to Total Assets ratio can reflect a firm’s working capital policy, as follows.
𝑊𝐶𝑇𝐴 =𝑊𝑜𝑟𝑘𝑖𝑛𝑔 𝐶𝑎𝑝𝑖𝑡𝑎𝑙 (𝑊𝐶) 𝑇𝑜𝑡𝑎𝑙 𝐴𝑠𝑠𝑒𝑡𝑠 (𝑇𝐴)
Where the lower the value of the ratio, the less would be the amount of working capital the firm is using to run the business and, therefore, the greater the degree of aggressiveness of the firms’ working capital management strategy. Otherwise, if the value of the ratio increases, the management is likely to be more conservative in managing working capital.
As suggested by Nazir & Afza (2009) the chosen performance measure, that would be the explained variable in the study, was the Return on Assets (ROA), which represents the returns that a firm is generating from its own assets. As the aim of this study is to understand the potential relationship between the working capital policies and the corporate profitability, and once the explanatory variables are purely business-related, the earnings before interest and taxes (EBIT) replaced the net income, so that different capital structures, taxes or interests won’t bias the firms’ real operating returns.
𝑅𝑂𝐴 =𝐸𝑎𝑟𝑛𝑖𝑛𝑔𝑠 𝐵𝑒𝑓𝑜𝑟𝑒 𝐼𝑛𝑡𝑒𝑟𝑒𝑠𝑡 & 𝑇𝑎𝑥𝑒𝑠 (𝐸𝐵𝐼𝑇)
𝑇𝑜𝑡𝑎𝑙 𝐴𝑠𝑠𝑒𝑡𝑠
Thereby, the explained variable, ROA, is a measure of the firms’ operating income in proportion to the value of the total assets. This measure reflects how efficiently a firm is using its assets to create operating profit.
Nazir & Afza (2009) also considered Tobin’s q as a performance measure; however, this paper will discard that measure, as it takes in consideration the firms’ market value, which is not appropriate to assess the performance of non-listed firms.
4.3.2 Control Variables
Along with the explanatory and explained variables, we took in consideration a set of control variables that theoretically influence firm’s profitability, following the lines of several studies that concern the relationship between working capital and corporate profitability, and were already described in Chapter 3, in literature review. (Arbidane & Ignatjeva, 2012; Deloof, 2003; García-Teruel & Martínez-Solano, 2007; Lazaridis & Tryfonidis, 2006; Mathuva, 2010; Napompech, 2012; Nazir & Afza, 2009; Shin & Soenen, 1998)
The firms’ size was calculated through the natural logarithm of total assets, so that we don’t allow the value of total assets to bias the estimations, and was represented as Size. (Deloof, 2003; García-Teruel & Martínez-Solano, 2007)
Relying on the belief that the level of leverage that a firm carries may influence its results, the variable Lev was also included as control in the regression models. As presented in table 2, the firm’s leverage was measured through the total debt to total assets ratio, in accordance with previous studies. (Arbidane & Ignatjeva, 2012; Napompech, 2012; Shin & Soenen, 1998)
Further, the variable SalesG measures the evolution of a firm’s sales, and was calculated through the difference between yearly sales of period t and period t-1, and divided by the sales of t-t-1, as presented in Table 2. This variable reflects the variation of a firm’s sales, according to the previous year, and was also used as a control variable in most of the studies mentioned in the literature review.
Last, according to García-Teruel & Martínez-Solano (2007) and Nazir & Afza (2009) good economic conditions tend to be reflect on firm’s returns. For that reason, Portugal’s GDP growth rate was also included in the regressions as a control variable. As seen in table of variables used, this measure is represented by the variable GDPG.
4.4 Regression Models
In order to investigate the impact of working capital policies on the profitability of firms in the Portuguese Footwear sector the study linearly regresses two different models:
Model (1): 𝑅𝑂𝐴𝑖𝑡 = 𝛽0+ 𝛽1(𝐴𝐼𝑃)𝑖𝑡 + 𝛽2 (𝐴𝐹𝑃)𝑖𝑡+ 𝛽3(𝑆𝑖𝑧𝑒)𝑖𝑡+ 𝛽4 (𝐿𝑒𝑣)𝑖𝑡+ 𝛽5(𝑆𝑎𝑙𝑒𝑠𝐺)𝑖𝑡 + 𝛽6(𝐺𝐷𝑃𝐺)𝑡+ 𝜀𝑖𝑡 Model (2): 𝑅𝑂𝐴𝑖𝑡 = 𝛽0+ 𝛽1(𝑊𝐶𝑇𝐴)𝑖𝑡+ 𝛽2 (𝑆𝑖𝑧𝑒)𝑖𝑡+ 𝛽3 (𝐿𝑒𝑣)𝑖𝑡+ 𝛽4(𝑆𝑎𝑙𝑒𝑠𝐺)𝑖𝑡 + 𝛽5(𝐺𝐷𝑃𝐺)𝑡+ 𝜀𝑖𝑡
All the variables in the estimation presented panel data, where t is the time index and includes the financial data for every firm, i, during the 2007-2016 period, and Ɛ represents the error term. With the exception of the variable GDPG, which considers the same annual values for every firms in the sector, and for that reason holds data in time-series.
In both models, all the control variables were included, as defined in Table 2, in the previous point. Along with it, Model (1) will estimate the impact of the explanatory variables AIP and AFP on the firms’ ROA, while Model (2) will consider the WCTA, which is the difference between variable AIP and AFP, as the explanatory variable to estimate the impact on the profitability measure.
The models were estimated through the method of Ordinary Least Squares (OLS), with base on 7368 observations.
Note: The presented statistics were computed with base on 7368 observations.
Chapter 5
Empirical Results
The following section will report the results of the study. Both descriptive statistic and regressions analysis were made, for the interests of clarity and rationally descriptive statistic were calculated before running the regressions, and so, the results will be report following this order. Further, the last subchapter will discuss the results, through a comparison with those found in relevant literature.
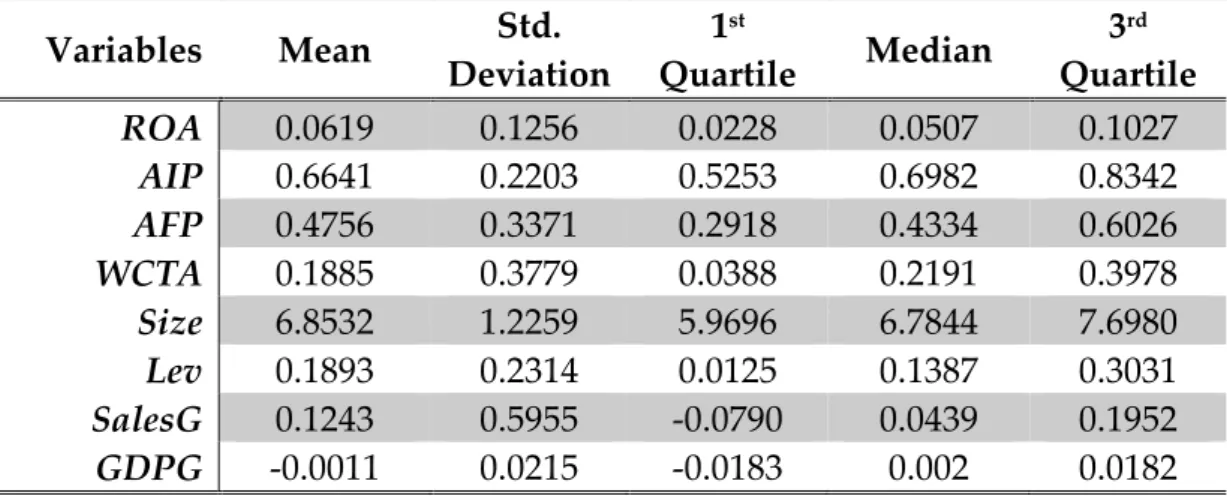
5.1 Descriptive Statistic Analysis
Variables Mean Std. Deviation 1st Quartile Median 3rd Quartile ROA 0.0619 0.1256 0.0228 0.0507 0.1027 AIP 0.6641 0.2203 0.5253 0.6982 0.8342 AFP 0.4756 0.3371 0.2918 0.4334 0.6026 WCTA 0.1885 0.3779 0.0388 0.2191 0.3978 Size 6.8532 1.2259 5.9696 6.7844 7.6980 Lev 0.1893 0.2314 0.0125 0.1387 0.3031 SalesG 0.1243 0.5955 -0.0790 0.0439 0.1952 GDPG -0.0011 0.0215 -0.0183 0.002 0.0182
The results presented in Table 3 suggest that, on average, firms in the Portuguese Footwear sector present an ROA around 6.19%, which indicates that firms are generating 6.19% of its operating profits from the total assets, in mean values.
In the same way, we can observe that firms in this sector report a value around 66% for AIP variable, which is, as explained in Chapter 4 the total current assets to total assets ratio. As mentioned in the previous chapters, firms in this sector are likely to contain substantial amounts on the working capital components in their balance sheets, therefore it is expected that the total current assets represent a considerable percentage of the total assets.
The results presented for the AFP variable show that, on average, the total current liabilities are around 48% in proportion to the firms’ total assets. The value of this ratio reflects, as mentioned for variable AIP, that firms in the Portuguese Footwear sector are likely to have substantial amounts on accounts payable.
As explained in Chapter 4, the variable WCTA is the working capital to total assets ratio, which can be seen as the difference between variables AIP and AFP. The statistics for this variable show that, on average, for firms in this sector, the working capital represents a percentage around 19% in proportion to the value of their total assets. This value for variable WCTA is precisely the difference between the mean values of AIP and AFP variables, and confirms the weight of the working capital components on the balance sheets of firms in this sector. Notwithstanding, the standard deviation for this variable displays a considerable value, indicating that there are a relative amount of firms values differing from the mean.
The variable Size, measured through the natural logarithm of total assets, presents a mean around 6.85 and considers the highest standard deviation value among all the variables, 1.23. This value for the standard deviation was expected, since the firms’ total assets are highly different, and so does the natural logarithm.
Looking for the variable Lev, which measures the firms’ leverage through total debt to total assets ratio, firms in the Portuguese Footwear sector have, on average, 18.9% of debt accumulated in comparison to the total assets.
Regarding sales growth, represented for variable SalesG, we can conclude that, on average, firms in this sector present a yearly growth of approximately 12.4%, but with a standard deviation around 0.6, however.
Last, the variable GDPG that represents the annual growth in Portugal’s Gross Domestic Product and, to a given year, is the same for every firm in the industry, presents a mean value of -0.11% and a standard deviation of approximately 0.022. This value suggests that Portugal’s GDP has been slightly decreasing during the 2007-2016 period, on average values.
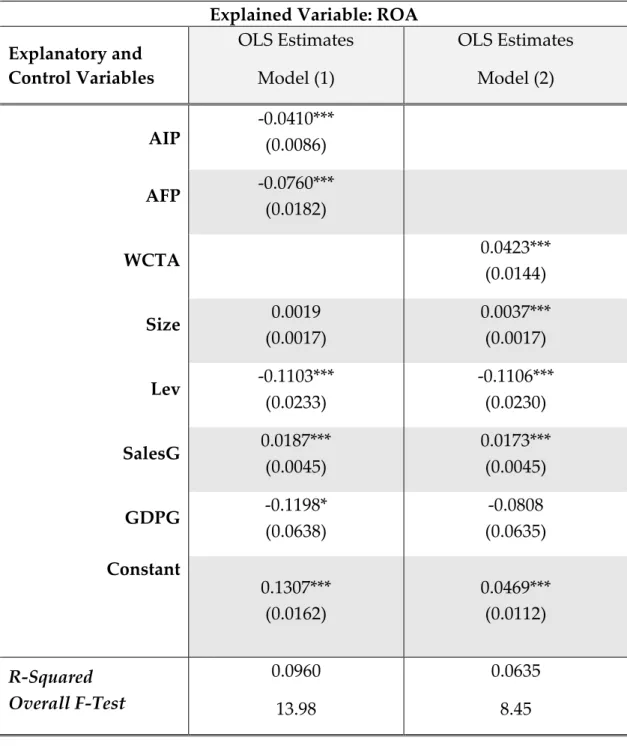
5.2 Regressions Analysis
By analyzing the results of the regression for Model (1) we see that all variables
Explained Variable: ROA Explanatory and Control Variables OLS Estimates Model (1) OLS Estimates Model (2) AIP -0.0410*** (0.0086) AFP -0.0760*** (0.0182) WCTA 0.0423*** (0.0144) Size 0.0019 (0.0017) 0.0037*** (0.0017) Lev -0.1103*** (0.0233) -0.1106*** (0.0230) SalesG 0.0187*** (0.0045) 0.0173*** (0.0045) GDPG -0.1198* (0.0638) -0.0808 (0.0635) Constant 0.1307*** (0.0162) 0.0469*** (0.0112) R-Squared Overall F-Test 0.0960 13.98 0.0635 8.45
Table 4: Regressions Results
.
Notes: All these specifications were computed with base on 7368 observations.
Heteroscedasticity-robust standard-errors are in parenthesis. Where *** illustrates p-value <0.01, ** sets for p-values <0.05, and * represents p-values <0.1.