Master of Science in Finance
Master’s Final Work
Dissertation
Performance of Personal Pension Funds in Portugal
Beatriz Correia
Master of Science in Finance
Master’s Final Work
Dissertation
Performance of Personal Pension Funds in Portugal
Beatriz Correia
Supervisor:
Maria Teresa Medeiros Garcia
i
Abstract
In a society where the number of pensioners is considerably increasing and the proportion of contributors is decreasing, the social security system is becoming unaffordable, increasing the importance of personal pension plans in complementing the pensions provided by Governments. After the 2008 financial crisis, the concern related with the guarantee of an income during the retirement period increased, which lead to a major investment in retirement-oriented financial products. This work pretends to analyze the performance of personal pension plans in Portugal and to provide more information about these financial products, as the literature in Portugal related with this topic is scarce. It was found evidence that, on average, the performance of these plans is not significantly different from zero and that they underperform their benchmarks. This result might implicate that these plans are not the solution to guarantee the same standard of living once the individual retires. When compared against each other, the performance does not differ significantly between funds, and this might be related with the restrictions imposed by the Government regarding the market structure and asset allocation.
Keywords
ii
Resumo
Numa sociedade onde o número de pensionistas está a aumentar e a proporção de contribuintes a decrescer, o sistema da segurança social está a tornar-se insustentável, aumentando assim a importância dos planos poupança reforma como complemento das pensões pagas pelo Estado. Após a crise financeira de 2008, cresceu a preocupação em garantir um rendimento durante a reforma, levando a um aumento da contribuição para produtos de longo-prazo. Esta dissertação tem como objetivo analisar o desempenho dos planos poupança reforma (PPR) em Portugal e providenciar mais informação sobre este tópico, uma vez que a literatura nesta área é escassa. Os resultados sugerem que o retorno destes planos não é significativamente diferente de zero e os mesmos têm um desempenho inferior, a portfolios equivalentes, em média. Este resultado pode implicar que os PPR não são a melhor solução a fim de garantir o mesmo nível de vida durante a reforma do indivíduo. Quando comparados entre si, os PPR apresentam rendibilidades semelhantes, o que pode ser provocado pelas restrições impostas por lei no que concerne à estrutura do mercado de fundos de pensões e à alocação dos investimentos.
Palavras-Chave
iii
Acknowledgement
I would like to thank my parents for giving me the opportunity of pursuing my studies and for giving me the necessary means to succeed. Also, my sister for the support throughout these years.
I also would like to thank Professor Maria Teresa Garcia for the guidance throughout this work.
iv
Table of Content
Abstract ... i Resumo ... ii Acknowledgment ... iii List of figures... v List of tables ... vi List of abbreviations ... vi 1. Introduction ... 1 2. Literature Review ... 32.1. Personal pension plans vs Other saving accounts ... 4
2.2. Contributions to personal pension plans ... 4
2.3. The investors’ profile ... 5
2.4. The performance of personal pension plans ... 6
3. Data and Methodology ... 8
3.1. Data ... 8
3.2. Methodology... 10
4. Results ... 12
5. Conclusions ... 16
5.1 Limitations and Future research ... 18
References ... 19
v
List of figures
Figure 1. Life Expectancy at birth ... 28
Figure 2. Fertility Rate ... 28
Figure 3. Social Security Expense ... 29
Figure 4. Household’s saving rate ... 29
Figure 5. Number of PPP and pension providers ... 30
Figure 6. The Pension funds market in Portugal ... 30
Figure 7. Contributions to PPP ... 9
Figure 8. PPP’s value ... 9
Figure 9. Number of participants by gender... 31
Figure 10. Number of participants by gender and age ... 10
Figure 11. PPP’s investment structure ... 31
Figure 12. Average PPP’s monthly returns ... 32
Figure 13. Average PPP’s yearly returns ... 32
Figure 14. Average benchmark’s monthly returns ... 33
Figure 15. Average benchmark’s yearly returns ... 33
Figure 16. Difference in returns... 34
Figure 17. Histogram of total personal pension plan’s average returns... 34
Figure 18. Histogram of total benchmark’s average returns ... 34
Figure 19. Histogram of difference in returns ... 35
vi
List of tables
Table 1. List of the exiting Personal Pension Plans ... 27 Table 2. List of the used benchmarks ... 11 Table 3. PPP and benchmark’s return, sigma and Sharpe ratio ... 15 Table 4. Results of t-tests on the difference of mean returns, sigma and Sharpe ratio ... 16 Table 5. Results of t-tests of mean difference in returns and Modigliani-Modigliani performance ratio ... 16
List of abbreviations
DB – Defined Benefit Plans DC – Defined Contribution Plans
FIM – Fundos de Investimento Mobiliário (Securities Investment Fund) FP – Fundos de Pensão (Pension Funds)
IRA – Investment Retirement Accounts PF – Pension Funds
PP – Pension Plans
PPB – Primary Prospectus Benchmark PPP – Personal Pension Plans
𝑀2 – Modigliani–Modigliani risk adjusted performance ratio
1
1. Introduction
As stated in the Universal Declaration of Human Rights, Art. 22, “Everyone, as a member
of society, has the right to social security and is entitled to realization, through national effort and international co-operation and in accordance with the organization and resources of each State, of the economic, social and cultural rights indispensable for his dignity and the free development of his personality.” One of the main concerns for
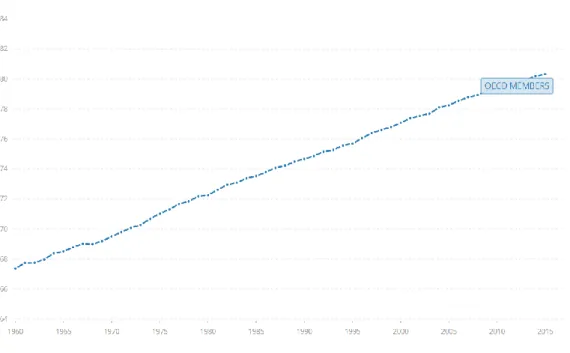
Governments is to make sure individuals have a periodic income, once they retire. This is guaranteed through Social Security Systems; a pay-as-you-go system, managed by the State, where working people make mandatory contributions which are used to pay current pensions. This system can only be sustainable when contributions are higher than payments, which might not happen in the future due to the inverted population pyramid verified in most of the countries, especially in the developed ones. The health care and life quality improvement promoted the increase of average life expectancy, from 67 years in 1960 to 80 years in 2015 (Figure 1). However, this was not accompanied by a growth in the fertility rate; in fact, during the same period, the world assisted to a decrease from 3.2 children per woman to 1.7 (Figure 2), leading to a population ageing.
These two trends, as mentioned before, represent a big issue for Social Security Systems in OECD members, where the number of contributors might not be enough to compensate the increase in the number of pensioners.
To mitigate this problem, a multi-pillar system, developed by the World Bank in 1994, was promoted - a flexible system that intended to address the population needs and to provide more security against the economic, demographic, and political risks faced by pension systems. The first pillar is publicly managed as part of a country’s social security system; it is a mandatory defined benefit scheme, financed by collecting taxes from
2
workers and paying out immediately to pensioners. The second pillar is privately managed and it is provided by companies in the form of occupational pension plans; these are essentially mandatory defined contribution schemes and are funded by the employer and the employee. The third pillar consists on a voluntary defined contribution scheme, where an individual decides to make contributions to a plan, known as personal pension scheme or individual retirement account. This last pillar is the subject of this work.
A Personal Pension Plan (PPP) is an individual retirement account whose purpose is to provide a lifetime income security during the retirement period. In these plans, contributions are made during an employee’s working life and accumulated into a fund managed by an insurance or financial institution. During the retirement period, the individual will receive the total amount invested plus the return from this fund in the form of periodic payments. The investor bears both the financial and the longevity risk.
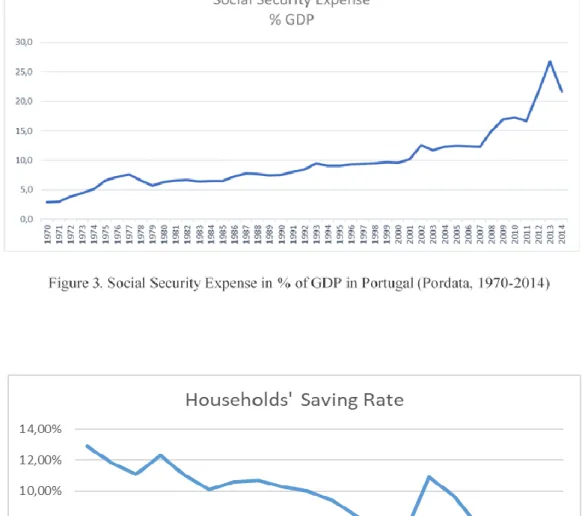
In Portugal, PPPs were created in 1989, under the name Plano Poupança Reforma, and are described on the Decreto-Lei nº 205/89 (Appendix A). The aim of these plans is to encourage long-term savings (Figure 4 shows the significantly decrease of the saving rate) which will complement the pension provided by the social security during retirement (Figure 3 shows the increase of social security expense as a percentage of GDP since 1970). PPPs are Tax-Deferred accounts (Appendix B shows how PPPs are taxed), managed by specialized entities, such as investment fund management companies, pension fund management companies and insurance companies. Since these are long-term investments, they should be characterized by solid investments, so fund managers need to respect the rules established by the law when constructing the fund. Individuals can be repaid only when they retire, if the contributions started at least 5 years before, or
3
when they face long-term unemployment or a serious illness and incapability of working. Withdrawals in other conditions than these are subject to penalizations.
PPPs are divided in two major categories: insurance, which guarantee a minimum return, and funds, which are more volatile and do not guarantee a return. Almost 90%1 of the plans held by households are in the form of insurance PPPs, however the investment in funds PPPs has been increasing, as individuals start perceiving insurance PPPs have very low returns. The purpose of this study is to assess the performance of personal pension plans in the form of funds in Portugal, using performance indicators, such as the Sharpe ratio and the Modigliani risk-adjusted performance ratio, and comparing them to some benchmarks. The results suggest that the performance of these funds is not significantly different from zero and its lower, on average, than their benchmarks.
This work is divided as follows: in section II, the literature review related with the personal pension funds topic; in section III it will be described the data and the methodology used; in section IV the results will be presented; and in section V conclusions, limitations and future research.
2. Literature Review
According with the Life-Cycle hypothesis, individuals tend to save less when their income is lower or when expenses are expected to be higher (Modigliani and Brumberg, 1954). One of the main concerns in the OECD countries is the low households’ saving rate, which implies that individuals are not saving enough for retirement, resulting in a decline of their standard of living in this period (McCarthy and Pham, 1995), especially when the state pension provision is facing financial difficulties given the current demographic changes (Disney et al., 2000).
1 2016 data
4
Considering that investment decisions are related with tax savings and with the guarantee of an income during retirement (Barrero and Laborda, 2007), countries developed tax-deferred accounts, in order to encourage people saving for their retirement. In these accounts contributions are tax deductible and taxes over interests are paid only when funds are withdrawn.
Individuals can choose between two investment vehicles when setting up a personal plan: profit option, where investment returns are smoothed over time, or non-profit option, where contributions are used to buy units whose value corresponds to an investment fund and the pension value depends on the return of this investment (Gregory and Tonks, 2004).
2.1. Personal pension plans vs Other saving accounts
The major PPPs’ disadvantage relative to other savings accounts is the fact that returns cannot be withdrawn before retirement in case of need (Samwick, 1998). It is reasonably to think in these two forms of saving as substitutes, but some studies show the opposite. Rossi (2006) states that private pension plans and conventional forms of saving are complementary, whereas the first one has a retirement purpose, and the second form of investment is made for precautionary reasons. Also, individuals who save in one form are more likely to save in other forms as well (Venti and Wise, 1991).
2.2. Contributions to personal pension plans
When studying personal pension plans it is important to evaluate their impact on national savings (the sum of public with private saving). It is expectable a decrease in public revenues, since IRAs are tax-deductible, but private saving depends on how these plans are financed and how high their returns are. Contributions to these accounts can be financed from three different sources (Attanasio and DeLeire, 2002): decrease in
5
consumption, which represents new savings; shift the investment from other financial products; or invest the amount that would be invested even in the absence of individual retirement accounts. These authors found evidence that individuals are reshuffling existing savings. However, this conclusion is not universal. Some authors defend that contributions to personal pension plans represent new saving, through reductions in consumption or increase in income (Guariglia and Markose, 2000).
2.3. The investor’s profile
It is also interesting and relevant to analyze the consumers’ profile; however, this analysis can be difficult due to the heterogeneity among households (Gale and Scholz, 1994). General conclusions are similar between different studies: contributions to PPPs are positively correlated with age, income and degree of education; married people have more propensity to make contributions, but larger families tend to save less; PPPs’ consumers have less debt and households who have in past accumulated more illiquid financial assets are more likely to continue saving in this form. Households prefer to maintain their wealth in cash and near-cash investments, and the proportion invested in riskier assets declines with age and increases with wealth. There is also a tendency for women to be more conservative, which might result in less retirement income. Women are expected to live longer than men (83 years against 78 years2), so the retirement wealth must support a longer period. One of the explanations for this conservatism might be the lower average income when comparing with the male’s average income (Bajtelsmit and Bernasek, 1996). For Bodie and Crane (1997) the retirement-oriented investment should be concentrated in equities and long-term fixed-income securities and the portfolio must be diversified to mitigate the inherent risks. For Blake, Wright and Zhang (2014), the
2 Average life expectancy at birth for OECD members, World Bank, 2015
6
contribution rate to PPPs should not be constant over time and it reflects the trade-off between current and future consumption, the individuals’ risk aversion level and the changes in income over the life-cycle. The lack of knowledge of individuals to assess the performance of their investments might result in a vulnerability to low income during retirement (Petraki and Zalewska, 2015); so, individuals must be provided with the right information, education and experience, so they will tend to control better their investments, making better choices.
In Portugal, the proportion invested in life insurance and pension funds has been gaining importance since the 1990s as people start perceiving the importance of these financial products to complement the social security benefits received during retirement (Cardoso, Farinha and Lameira, 2008).
2.4. The performance of personal pension plans
The future benefits of private pension funds are exposed to several risks, namely the systematic risk, the systemic risk and the agency risk. The systematic risk is the risk inherent to the market; the systemic risk is associated with the possibility of an event to trigger a collapse in a certain market; the agency risk is the risk that the management of a company will use his authority to benefit itself rather than the shareholders. Another risk concerning these plans is the risk associated with investments in foreign currencies, namely the exchange rate, the settlement risk and the liquidity risk. To mitigate these risks, governments established rules regarding the pension’s market structure, the funds’ performance and the asset allocation. The regulation prevents the funds to be completely different from each other, which unable investors to choose the funds that better suit their needs accordingly with their age, wealth and risk aversion. These restrictions cause a
7
herding effect: funds will end up investing in similar assets, and, therefore, performance between funds will not be so different (Srinivas, Whitehouse and Yermo, 2000).
Srinivas, Whitehouse and Yermo (2000) studied the performance of pension plans in LATAM countries. They found that asset allocation and performance are similar across pension funds. They also found evidence that these funds underperform their benchmarks, though their volatility is lower. The authors defend that these results are related with portfolio homogeneity: there is a limit of one fund per manager, however, the reaction to market events tend to be the same between managers, in part due to the restrictions imposed to the pensions’ asset allocation.
Gregory and Tonks (2004) tested the performance of personal pension plans in the UK. The authors found evidence that the average performance of these accounts is not significantly different from zero; also, the performance of these schemes may be associated with the ability of the fund manager.
Petraki (2012) also studied the personal pension plans in the UK. The author found evidence that PPPs outperform their benchmarks both in raw terms (the difference between the portfolios) and in risk-adjusted terms. Petraki also found evidence that the performance of the fund is better when funds are young; bear markets are found to have a stronger impact than bull market conditions; and fund performance is positively correlated with the provider’s size.
Petraki and Zalewska (2015) also studied these accounts’ performance in the UK making a comparison with T-bills and benchmarks. the authors found evidence that funds focused on emerging markets are more profitable; the performance of the funds whose investments are in domestic assets, was not so different from zero; funds concentrated in UK equities were negatively affected by the 2008 financial crisis; the risk was higher
8
when international investments were made. The authors found evidence that PPPs outperform their benchmarks in the long and short run which implicates that the primary prospectus benchmarks are not challenging pension funds when it comes to long-term performance targets. They also found evidence that PPPs outperform T-bills in the long-run but not in the short-long-run.
3. Data and Methodology
3.1 Data
This section describes the data used in this study and reports some general statistics that illustrate the development of the personal pension fund market in Portugal.
The data is provided by Autoridade de Supervisão de Seguros e Fundos de Pensões (ASF) and by Associação Portuguesa de Fundos de Investimento, Pensões e Patrimónios (APFIPP). Currently (September 2017), there are 85 personal pension plans divided in three classes: 26 pension funds (denominated as FP from now on), 44 pension plans based on life insurance and 15 securities investment funds (denominated as FIM from now on). The first two classes are supervised by ASF and the last one is supervised by Comissão do Mercado de Valores Mobiliários (CMVM). For each fund was collected the fund’s name, provider’s name, inception date and fund’s class (Table 1). Daily returns are available since 1989. Information regarding investors’ profile, contributions, fund’s value and asset allocation are provided at a cross-sectional level.
Currently there are 27 providers in the personal pension market. Figure 5 shows the number of PPP and pension providers between 1989 and 2017; in 1989 there was 5 individual pension plans provided by 4 institutions; between 1989 and 2000 the number of pension funds available increased to 20, while the number of providers increased to 10 institutions; on the following decade (2000-2010), there was 37 more pension funds and
9
9 more institutions. From 2010 to 2017 the number of personal pension plans increased from 57 to 85 and the number of providing institutions increased from 19 to 27.
The following market analysis is based on ASF information which does not include the personal pension plans under the life insurance class.
Nowadays, personal pension plans only represent 2.4% of the total Portuguese pension funds market (Figure 6). Contributions to these plans increased significantly between 2011 and 2015, this tendency can be justified by two factors (Figure 7). First, after the 2008 financial crisis, the household saving rate increased in response to the uncertainty related with future income (both during the working period and the retirement period). Second, the investment in these plans was promoted through tax incentives, the guarantee of a return and the creation of new plans. However, in 2016, the contributions’ value decreased. Regarding de plans’ value (Figure 8); the value depends on the returns of the securities that are included in these plans and it has been increasing, but not significantly, since 2011.
The number of participants declined 17.60% between 2010 and 2015, increasing 5.32% in 2016; from the 66,607 participants, 53.21% are male, though the proportion of women investing in these plans has been increasing (Figure 9). During the period in
Figure 8. PPPs’ value, in thousands of euros, (ASF, 2011-2016) Figure 7. Contributions PPP, in thousands of euros, (ASF, 2011-2016)
10
analysis the trend has been shifting, participants aged between 56-60 have been the main holders of personal pension plans; however, the weight of the thresholds 41-46 and over 65 is increasing (Figure 10). This is the result of a higher concern in saving for retirement and the increase of the retirement age. Regarding its asset allocation, these funds invest mainly in bonds (corporate and government), liquid assets and stocks (Figure 11). The asset allocation is restricted by law, which makes it similar across pension funds.
3.2 Methodology
The first issue concerning the methodology of this work is how to measure funds’ performance. Sharpe (1966) developed a risk-adjusted return ratio which measures the average return earned in excess of the risk-free rate per unit of total risk. The Jensen’s alpha measures the difference between an asset’s verified return and its expected return according to the CAPM model (Jensen, 1968). Treynor introduced a risk adjusted return ratio (Treynor, 1965). The Modigliani risk-adjusted performance ratio (𝑀2) measures the returns of a portfolio adjusted for the risk of a benchmark’s portfolio (Modigliani and Modigliani, 1997). Previous work on fund’s performance rely on single and multi-index CAPM models or on the Arbitrage Pricing Theory. Some research uses a benchmark to compare the fund’s return and/or risk-adjusted ratios as a performance measure.
11
The choice of the benchmark is also an important issue. In order to minimize the risk, funds invest in different asset classes, which makes it inappropriate to choose a single index as a benchmark.
In this work, it will be used a benchmark to compare the fund’s performance. These benchmarks were chosen based on the information provided by institutions on their annual reports.
Three performance measures are used in this work, the Sharpe-ratio, the difference in
returns of the fund and its benchmark and the 𝑀2 measure (Appendix C shows how these
measures are calculated).
As mentioned previously, there are 85 personal pension plans on the Portuguese market, 5 of them opened in 2017, so they are excluded from this analysis. For personal funds under the life insurance class it is not possible to collect enough data to perform this analysis. This leads to a total sample of 40 plans, whose value was collected from APFIPP database on a daily basis. The period of observation is from December 1989 to December 2016. Monthly returns data were collected, with a total of 5,403 observations. The risk of the funds is calculated as the standard deviation of the monthly returns.
Regarding benchmarks, it was collected the monthly returns of different indexes, for the period 1999-2016, from Bloomberg database. Taking into consideration the information contained on the funds’ annual report, it was constructed a benchmark for the personal pension funds (Table 2). Appendix D describes the benchmarks used.
Investment type Benchmark
Government Bonds Barclays EurAgg TR
Corporate Bonds BBgBarc EurAgg 1-5 Yr
Stocks FTSE, Dow Jones, Eurostoxx 50, MSCI Europe, MSCI World
Liquidity Euribor 1M
Other Investments Euribor 6M
12
To mitigate possible issues related with stationarity, since monthly returns are found to have strong time-series properties, data was converted into yearly returns, through the arithmetic average method, for both returns and volatilities. A year is considered to be the first one for a fund, if there are, at least, 6 monthly observations. This leads to a total sample of 38 plans and a total of 501 observations.
For comparison reasons, the sample will be divided in funds under the FIM class and funds under the FP class. It will also be divided into funds whose mainly investment is in stocks (equity funds) and funds that are more conservative (fixed income funds).
First it will be tested if the difference in mean returns, sigma and Sharpe ratio (pension fund’s average return, sigma and Sharpe ratio minus that of benchmark’s) is different from zero. The null hypothesis is: the means are equal to zero. After, it will be tested if the difference in returns and the Modigliani-Modigliani measure are significantly different from zero. The null hypothesis is: the difference in returns (or the 𝑀2 measure) is not different from zero. T-statistics at 5% significance level (Appendix E).
Results are shown on the next section.
4. Results
The portfolio diversification allows personal pension plans to have a low standard deviation, which means that these might be low risk investments, on average. This diversification helped to minimize the impact of negative events in the PPPs performance. Considering the period 1990-2016, the average monthly return was 0.448% (Figure 12). These plans were more volatile in the periods 1997-2001 and 2008-2016. Between July 98 and October 98, the PPPs’ monthly returns were affected by the 1997 Asian financial crisis. After the Russian market collapse, international stocks market, from USA to Japan, reached new lows, as investors’ confidence level was shaken by the
13
unpredictability in the world’s financial markets. In 2001 and 2002 the decrease of the returns is justified, among other reasons, by the Dotcom bubble; until 2001 there was a high speculation around internet, with many internet-based companies being founded and a lot of people wanting to invest on them. After that, many companies started to report huge losses and some had to shut down. The terrorist attacks of 11th September, accelerated the stock markets drop, persisting the negative returns in 2002. The biggest drop on the personal pension plans’ return occurred in 2008, during the world financial crisis. This crisis started on the real state US market and it quickly spread worldwide. The impact of this crisis in Portugal was severe, and the economy is still trying to recover.
As shown by Figure 13, the PPP’ average yearly return has a decreasing tendency. Regarding benchmarks, their performance has been following the same trend as PPPs’ (Figures 14 and 15). Though, on average, personal pension funds underperform their benchmarks. This gap is more relevant for the period 1999-2001 (Figure 16).
Figure 17 shows the histogram for PPPs’ average returns. Between 1999 and 2016, the mean average return was 2.235% and its standard deviation was 5.512% (Figure 17). It presents a negative skewness of -1.261 and a kurtosis of 8.089. More than 50% of the observations are on the right side of the histogram, which implies that returns from these funds are not significantly different from zero.
Regarding Benchmarks, for the same period, the average return mean was 7.329% and its standard deviation was 7.679%. It presents a positive skewness of 0.149 and a kurtosis of 10.489 (Figure 18).
Figure 19 shows the distribution of the difference in returns. Between 1999 and 2016, the returns of personal plans were, on average, lower than the benchmarks’ return. This distribution also presents a negative skewness of -1.155. On a risk-adjusted basis, based
14
on the Modigliani-Modigliani measure, this plans also underperform their benchmarks (Figure 20). The skewness was still negative, -2.23, and the kurtosis was 14.63.
Table 3 shows the previous results in more detail. In raw terms, comparing the average returns, personal pension funds in Portugal perform identically. Funds under the FIM class and funds under the FP class, on average, perform identically; the difference between the securities investment funds and their benchmarks is lower than the difference between pension funds and their benchmarks, on average. Though fixed income funds have a lower return and volatility, on average, when compared to equity funds, this difference is not so significant; the difference between funds that invest more in equities and their benchmarks, is, on average, lower than the difference between the more conservative funds and their benchmarks.
The results for the first test are exhibited in table 4. Remembering, the null hypothesis is: the difference in mean return, sigma and Sharpe ratio is equal to zero. It was found no statistical evidence that the difference in mean return and sigma are equal to zero, one should reject the null hypothesis at a 5% significance level. On average, PPPs have lower volatilities and lower returns than benchmarks. These validates what was stated before, Portuguese personal pension plans, on average, underperform their benchmarks. On a risk-adjusted return basis, the null hypothesis is not rejected, once, at a 5% significance level, the statistical evidence suggests that the difference in mean Sharpe ratio is equal to zero.
Table 5 shows the results for the second statistical test. Remembering, the null hypothesis is: the difference in returns and/or the Modigliani-Modigliani risk adjusted ratio is not significantly different from zero. Regarding the difference in returns, there is no statistical evidence that this value is not significantly different from zero. Therefore,
15
one should reject the null hypothesis at a 5% significance level. This is accordingly with the previous results that PPP underperform their benchmarks, on average. Considering the total sample, it was found no statistical evidence that the Modigliani-Modigliani measure is not significantly different from zero at a 5% significance level, so the null hypothesis should be rejected. On a risk-adjusted basis, the plans also underperform their benchmarks.
Table 3. PPP and benchmark’s return, sigma and Sharpe ratio
Sample Fund Variable Mean Standard Deviation
Return 0,022 0,055 Sigma 0,109 0,075 Sharpe Ratio -0,401 0,870 Return 0,073 0,077 Sigma 0,121 0,091 Sharpe Ratio 0,418 2,277 Return 0,023 0,062 Sigma 0,111 0,083 Sharpe Ratio -0,407 0,862 Return 0,042 0,079 Sigma 0,153 0,122 Sharpe Ratio -0,075 0,679 Return 0,022 0,051 Sigma 0,108 0,070 Sharpe Ratio -0,398 0,875 Return 0,090 0,070 Sigma 0,104 0,062 Sharpe Ratio 0,684 2,747 Return 0,021 0,088 Sigma 0,186 0,090 Sharpe Ratio -0,058 0,431 Return 0,045 0,086 Sigma 0,180 0,103 Sharpe Ratio 0,038 0,511 Return 0,023 0,049 Sigma 0,098 0,066 Sharpe Ratio -0,451 0,906 Return 0,077 0,075 Sigma 0,113 0,086 Sharpe Ratio 0,472 2,420 Total PPP (#obs = 501) PPP Benchmark
Securities Investment Fund (#obs = 176) Pension Funds (#obs = 325) Fixed Income (#obs = 438) PPP Benchmark PPP Benchmark PPP Benchmark PPP Benchmark Equity (#obs = 63)
16
5. Conclusions
The purpose of this work was to analyze the performance of personal pension plans in the form of funds in Portugal, making a comparison with some benchmarks defined by the pension providers.
Pension plans were created with the purpose of encouraging people to save for their retirement, since life quality is expected to decrease during this period, due to a reduction in household’s wealth.
Table 5. Results of T-tests of mean difference in returns and Modigliani-Modigliani measure
Sample Variable Mean Standard Error T-Statistics P-Value
-0,050 0,003 -15,124 0,000 MM 0,010 0,004 2,533 0,016 -0,020 0,005 -4,104 0,000 MM 0,005 0,008 0,530 0,346 -0,068 0,004 -16,607 0,000 MM 0,013 0,004 3,174 0,003 -0,024 0,008 -2,850 0,008 MM 0,025 0,021 1,217 0,189 -0,055 0,004 -15,436 0,000 MM 0,033 0,007 4,951 0,000 Total PPP (#obs = 501)
Securities Investment Funds (#obs = 176) Pension Funds (#obs = 325) Equity (#obs = 63) Fixed Income (#obs = 438)
Table 4. Results of T-tests on the difference of mean returns, sigma and Sharpe ratio between PPP and Benchmarks
Sample Variable Coefficient Standard Error T-Statistics P-Value
Return 0,281 0,022 12,960 0,000 Sigma 0,727 0,022 33,577 0,000 Sharpe Ratio -0,031 0,018 -1,702 0,089 Return 0,4916 0,042 11,675 0,000 Sigma 0,5849 0,030 19,341 0,000 Sharpe Ratio 0,1376 0,105 1,309 0,192 Return 0,235 0,024 9,969 0,000 Sigma 0,928 0,029 32,114 0,000 Sharpe Ratio -0,042 0,019 -2,227 0,027 Return 0,673 0,083 8,139 0,000 Sigma 0,890 0,058 15,456 0,000 Sharpe Ratio 0,477 0,089 5,356 0,000 Return 0,2556 0,021 12,461 0,000 Sigma 0,677 0,023 29,352 0,000 Sharpe Ratio -0,039 0,020 -2,018 0,044 Fixed Income (#obs = 438) Pension Funds (#obs = 325) Equity (#obs = 63) Total PPP (#obs = 501)
Securities Investment Funds (#obs = 176)
17
These plans are long-term investments that depend on the performance of other assets, making them very volatile to market conditions. Since these are long-term investments whose purpose is to guarantee an income during the retirement period, the government established restrictions regarding asset allocation and the market structure with the purpose of protecting funds against negative economic events. On average, the performance is very similar across funds and this might be caused by the restrictions defined by the government concerning asset allocation. This homogeneity prevents the investor to choose the fund that better suits his profile, regarding wealth, age and risk aversion.
It was found evidence that, in Portugal, personal pension plans in the form of funds underperform, on average, their benchmarks both in raw and risk-adjusted terms. Benchmarks are essentially indexes that include dozens of stocks or bonds, however pension funds do not invest in all of them. It can also happen that private pension schemes invest in different assets that are not included on the presented benchmarks.
In general, personal pension schemes in the form of funds are not a risky investment, however, on average, their returns are not significantly different from zero. This result suggests that these plans might not be a good complement to pensions provided by social security systems in guaranteeing the same life quality once the individual retires. These results also may suggest that plans in the form of funds do not have higher returns than PPPs in the form of insurance, and they present a higher risk as they do not have a return guaranteed.
5.1. Limitations and future research
The study of personal pension plans in Portugal is scarce. All the information regarding their performance, risk and asset allocation is provided by the institutions responsible for
18
each fund and by ASF and APFIPP. ASF just has information at a cross-sectional level. And the APFIPP website is not user friendly, due to the time it takes to collect all the data needed.
It can be interesting to make a deeply investigation work regarding these plans, studying what motivates individuals to invest a portion of their wealth in these plans; how does age, wealth, career path and risk aversion affect the individual’s choice when choosing the plan; it can also be interesting to analyze the impact of these plans on household’s saving and if the investment in these financial products is worthy.
19
References
Attanasio, O. P., DeLeire, T. (2002). The effect of individual retirement accounts on household consumption and national saving. The Economic Journal, 12, 504-538. Bajtelsmit, V. L., Bernasek, A. (1996). Why do women invest differently than men?. Association for Financial Counseling and Planning Education, Volume 7.
Barrero, F. D., Laborda, J. L. (2007). Why do People invest in personal pension plans?.
Applied Economics 39, 9, 1115-1126.
Blake, D., Wright, D., Zhang, Y. (2014). Age-dependent investing: optimal funding and investment strategies in defined contribution pension plans when members are rational life cycle financial planners. Journal of Economic Dynamics and Control, 38(1), 105-124.
Bodie, Z., Crane, D. B. (1997). Personal investing: advice, theory, and evidence.
Financial Analyst Journal 53, no. 6.
Cardoso, F., Farinha, L., Lameira, R. (2008). Household wealth in Portugal: revised series. Banco de Portugal.
Disney, R., Emmerson, C., Wakefield, M. (2000). Pension reform and saving in Britain.
Oxford review of economic policy, Vol.17, No. 1, 70-94.
Engen, E. M., Gale, W. G., Scholz, J. K. (1996). The illusory effects of saving incentives on saving. The Journal of Economic Perspectives, Vol. 10, No. 4, 113-138.
Gale, G. (1998). The effects of pensions on household wealth: reevaluation of theory and evidence. The Journal of Political Economy, Vol. 106, No 4, 706-723.
Gale, G. W., Scholz, J. K. (1994). IRAs and household saving. The American Economic
20
Gregory, A., Tonks, I. (2004). Performance of personal pension schemes in the UK. Discussion paper nº22 FMG/UBS Series. London School of Economics.
Guariglia, A., Markose, S. (2000). Voluntary Contributions to Personal Pension Plans: Evidence from the British Household Panel Survey. Fiscal Studies. Vol. 21, nº4, 469-488.
Jensen, M. C. (1968). The performance of Mutual Funds in the period 1945-1964. The
Journal of Finance, 389-416.
McCarthy, J., Pham, H. N. (1995). The Impact of Individual Retirement Accounts on Savings. Federal Reserve Bank of New York. Current Issues in Economics and Finance
1, no. 6.
Modigliani, F., Brumberg, R. (1954). Utility analysis and the consumption function: an interpretation of cross-section data. Post Keynesian Economics, ed. Kenneth K. Kurihara. Modigliani. F., Modigliani, L. (1997). Risk adjusted performance. The Journal of
Portfolio Management, 23(2), 45-54.
Petraki, A. (2012). Performance of personal pension funds in the United Kingdom. Unpublished doctoral thesis. University of Bath, School of management.
Petraki, A., Zalewska, A. (2015). Jumping over a low hurdle: personal pension fund performance. University of Bristol, CMPO WP 13/305.
Porteba, J. M., Venti, S. F., Wise, D. A. (1996). How retirement saving programs increase saving. Journal of economics Perspectives, 10, 91-112.
Rossi, M. (2006). Examining the interaction between saving and contributions to Personal Pension Plans. Evidence from BHPS. Oxford Bulletin of Economics and Statistics, Vol. 71, 1-32.
21
Srinivas, P.S., Whitehouse, E., Yermo, J. (2000). Regulating private pension funds’ structure, performance and investments: cross-country evidence. Munich Personal RePEc
Archive. Paper No. 14753.
Treynor, J. (1965). How to rate management of investment funds. Harvard Business
Review, 43(1), 63-75.
Venti, S. F., Wise, D. A. (1991). The saving effect of tax-deferred retirement accounts: evidence from SIPP. National saving and economic performance, 103-130.
Venti, S. F., Wise, D. A. (1990). Have IRAs increased U.S. saving?: evidence from consumer expenditure surveys. The Quarterly Journal of Economics, Vol 105, No. 3, 661-698.
22
Appendix
24 Appendix B – Personal Pension Plans’ Taxation
Appendix C – Performance indicators
• Difference in Returns – it is simply the difference between the PPP’s return and the benchmark’s return. Formula: 𝑅̅ = 𝑅̅𝑃𝑃𝑃 𝑅̅𝑃𝑃𝐵
• Sharpe Ratio – it is a measure for calculating risk-adjusted return. It is the average return earned in excess of the risk-free rate per unit of volatility. Formula: 𝑆𝑅 =
𝑅̅𝑃−𝑅𝐹
𝜎𝑃 , where 𝑅̅𝑃 is the expected return of a portfolio, 𝑅𝐹 is the risk-free rate and
𝜎𝑃 is the portfolio volatility.
• Modigliani risk-adjusted performance – or the 𝑀2 measure, is very similar to
Sharpe ratio, but easier to interpret, especially when it presents a negative value, since it can be presented in percentage. It measures the returns of a portfolio
25
adjusted for the risk of the portfolio relative to that of some benchmark. Formula: 𝑀2 = 𝑅̅𝑃−𝑅𝐹
𝜎𝑃 ∗ 𝜎𝐵+ 𝑅𝐹, where 𝜎𝐵 is the benchmark’s annualized volatility.
Appendix D – Benchmarks’ description
• Bloomberg Barclays EuroAgg Treasury Total Return Index consists of fixed-rate, investment grade public obligations of the sovereign countries participating in the European Monetary Index. This Index currently contains euro-denominated issues from 13 countries (source: Bloomberg).
• Bloomberg Barclays Euro Aggregate Corporate Total Return Index is a rules based benchmark measuring investment grade, euro-denominated, fixed rate, and corporate only. Only bonds with a maturity of 1 year and above are eligible (source Bloomberg).
• FTSE 100 Index – is a capitalization-weighted index of the 100 most highly capitalized companies traded on the London Stock Exchange (source: Bloomberg).
• Dow Jones Industrial Average is a price-weighted average of 30 blue-chip stocks that are generally the leaders in their industry (source: Bloomberg).
• Euro Stoxx 50 Index is the Europe’s leading blue-chip index for the Eurozone, provides a blue-chip representation of super sector leaders in the Eurozone. It covers 50 stocks from 12 Eurozone countries (source: Bloomberg).
• MSCI Europe UCITS ETF is a fund whose purpose is to track the performance of the MSCI Europe Total Return (Net) Index. It captures large and mid-cap representation across 15 Developed Markets countries in Europe (source: Bloomberg and MSCI).
26
• MSCI World UCITS ETF is a fund whose purpose is to track the performance of the MSCI World Total Return (Net) Index. It captures large and mid-cap representation across 23 Developed Markets countries (source: Bloomberg and MSCI).
• Euribor is the rate at which Euro interbank term deposits are offered by one prime bank to another prime bank within the EMU zone (source: EMMI, European Money Markets Institute).
Appendix E – T- Statistic
A t-statistic is any statistical hypothesis test in which the test statistic follows a Student’s t-distribution under the null hypothesis. This statistic is commonly used to compare average returns from different portfolios and tests how significant these differences are. T = 𝑋̅−𝜇𝜎
√𝑛
~ 𝑡(𝑛 1), where 𝑋̅ is the sample mean,
μ is the hypothesized value,
σ is the sample standard deviation and n is the number of observations.
The p-value is the associated probability of a result to be observed. If the p-value is below 5% (in this particular case), the null hypothesis is rejected.
27
PPP Company Inception date Class
F.P. PPR 5 Estrelas Futuro SGFP 23/11/1989 Fundo de Pensões
F.I.M. Santander Poupança Valorização FPR Santander Asset Management 23/11/1989 Fundo de Investimento Mobiliário Victoria Valor Vantagem - Duplo Valor PPR Victoria Seguros 04/12/1989 Fundo de Pensões
F.P. PPR Praemium S Ocidental Pensões 13/12/1989 Fundo de Pensões F.P. PPR Praemium V Ocidental Pensões 13/12/1989 Fundo de Pensões F.P. PPR BNU Vanguarda Ocidental Pensões 02/11/1990 Fundo de Pensões
F.I.M. NB PPR GNB SGFP 22/11/1991 Fundo de Investimento Mobiliário F.I.M. BPI Reforma Segura PPR BPI Gestão de Ativos 28/11/1991 Fundo de Investimento Mobiliário F.I.M. BPI Reforma Investim. PPR BPI Gestão de Ativos 02/12/1991 Fundo de Investimento Mobiliário F.P. BBVA Equilibrado PPR BBVA 08/10/1992 Fundo de Pensões
F.P. CVI PPR BBVA 23/11/1993 Fundo de Pensões F.P. PPR Vintage (+) GNB SGFP 30/10/1995 Fundo de Pensões F.P. Vanguarda PPR Ocidental Pensões 09/01/1996 Fundo de Pensões F.P. BPI Vida - PPR BPI Vida e Pensões 31/10/1996 Fundo de Pensões F.P. PPR Garantia de Futuro (+) Futuro SGFP 05/12/1996 Fundo de Pensões F.P. PPR Europa Ocidental Pensões 27/10/1997 Fundo de Pensões F.P. PPR Platinium Futuro SGFP 29/12/1997 Fundo de Pensões
F.I.M. Bankinter PPR Obrigações Bankinter Gestão de Ativos 18/11/1999 Fundo de Investimento Mobiliário VIVA PPR XXI Groupama Vida 06/12/1999 Ramo Vida
PPR Património Reforma Prudente SGF SGFP 26/05/2000 Fundo de Pensões BPI Reforma Garantida 5 anos PPR BPI Vida e Pensões 14/05/2001 Ramo Vida
F.I.M. Santander Poupança Prudente FPR Santander Asset Management 21/05/2001 Fundo de Investimento Mobiliário F.P. BBVA Prudente PPR BBVA 11/11/2002 Fundo de Pensões
PPR Património Reforma Equilibrado SGF SGFP 06/12/2002 Fundo de Pensões PPR Património Reforma Conservador SGF SGFP 06/12/2002 Fundo de Pensões
F.I.M. IMGA Poupança PPR IM Gestão de Ativos 05/05/2003 Fundo de Investimento Mobiliário PPR Património Reforma Acções SGF SGFP 23/04/2004 Fundo de Pensões
BPI Reforma Aforro PPR BPI Vida e Pensões 07/04/2005 Ramo Vida
F.I.M. BPI Reforma Acções PPR BPI Gestão de Ativos 22/06/2005 Fundo de Investimento Mobiliário F.I.M. IMGA Investimento PPR Ações IM Gestão de Ativos 11/01/2006 Fundo de Investimento Mobiliário Caixa PPR Capital Mais Fidelidade 02/05/2006 Ramo Vida
PPR Plano Reforma Capital Garantido Santander Totta Vida 29/05/2006 Ramo Vida
F.I.M. Bankinter PPR 20 Bankinter Gestão de Ativos 04/10/2006 Fundo de Investimento Mobiliário F.I.M. Bankinter PPR Ações 55 Bankinter Gestão de Ativos 04/10/2006 Fundo de Investimento Mobiliário Allianz PPR Activo Allianz 22/11/2006 Ramo Vida
Solução PPR Zurich Zurich Vida 01/01/2007 Ramo Vida Leve DUO (PPR) Fidelidade 08/04/2007 Ramo Vida Capital Diferido CD BA PPR España, S.A. 01/01/2008 Ramo Vida Misto BA PPR España, S.A. 01/01/2008 Ramo Vida Leve II (PPR) Fidelidade 03/03/2008 Ramo Vida F.P. PPR Geração Activa Futuro SGFP 11/06/2008 Fundo de Pensões
F.I.M. Optimize Capital Reforma PPR Acções Optimize Investment Partners 25/09/2008 Fundo de Investimento Mobiliário F.I.M. Optimize Capital Reforma PPR Equilibrado Optimize Investment Partners 25/09/2008 Fundo de Investimento Mobiliário BPI Reforma Garantida 1 ano PPR BPI Vida e Pensões 23/10/2008 Ramo Vida
Liberty PPR Mais Liberty 06/11/2008 Ramo Vida PPR SGF Garantido SGF SGFP 12/12/2008 Fundo de Pensões BPI Reforma Garantida 3 anos PPR BPI Vida e Pensões 27/04/2009 Ramo Vida BPI Reforma Garantida 8 anos PPR BPI Vida e Pensões 27/04/2009 Ramo Vida PPR SGF Ações Dinâmico SGF SGFP 18/09/2009 Fundo de Pensões F.P. BBVA Dinâmico PPR BBVA 12/11/2009 Fundo de Pensões PPR Transfer (Transferências) Fidelidade 21/12/2009 Ramo Vida PPR Transfer Fidelidade 21/12/2009 Ramo Vida PLANO POUPANÇA REFORMA - PSN P.S.N. - Mutua de Seguros 01/02/2010 Ramo Vida
F.I.M. Optimize Capital Reforma PPR Moderado Optimize Investment Partners 19/08/2010 Fundo de Investimento Mobiliário Vida PPR Rendimento Garantido 03 Bankinter Seguros de Vida 03/09/2010 Ramo Vida
Generali PPR + Seguro (Prémios Únicos) Generali Vida 01/11/2010 Ramo Vida Generali PPR + Seguro (Prémios Periódicos) Generali Vida 01/11/2010 Ramo Vida PPR Plano A Mapfre Seguros de Vida 19/11/2011 Ramo Vida BPI Reforma Garantida 2 anos PPR BPI Vida e Pensões 23/07/2012 Ramo Vida F.P. PPR BIG Acções Alpha Futuro SGFP 29/10/2012 Fundo de Pensões F.P. PPR BIG Taxa Plus Futuro SGFP 29/10/2012 Fundo de Pensões Lusitania Poupança Reforma PPR (71D5) Lusitania-Vida 01/02/2015 Ramo Vida PPR Rendimento Total (71E5) Lusitania-Vida 02/02/2015 Ramo Vida CA PPR [Capital] CA Vida 16/03/2015 Ramo Vida Reforma Programada PPR Empresas Ocidental Vida 08/04/2015 Ramo Vida Reforma Programada PPR Ocidental Vida 08/04/2015 Ramo Vida Leve PPR Uni - 2ª série Fidelidade 20/04/2015 Ramo Vida Real PPR Real Vida 01/05/2015 Ramo Vida PPR Garantido Finibanco 2015 - PPR Finibanco Vida 01/06/2015 Ramo Vida Prévoir PPR PU (TT 0%) Prévoir Vie 01/11/2015 Ramo Vida Prévoir PPR PP (TT 0%) Prévoir Vie 01/11/2015 Ramo Vida Real PPR R Real Vida 01/12/2015 Ramo Vida Postal PPR Rendimento Garantido Fidelidade 04/12/2015 Ramo Vida PPR+ Ageas Vida 04/01/2016 Ramo Vida PPR SGF Stoik Ações SGF SGFP 15/02/2016 Fundo de Pensões PPR Poupança Futuro Transfer Fidelidade 07/03/2016 Ramo Vida NB PPR Aforro Seguro GNB Seguros Vida 07/07/2016 Ramo Vida PPR Garantido Mapfre Seguros de Vida 01/09/2016 Ramo Vida GNB PPR Aforro Seguro GNB Seguros Vida 26/09/2016 Ramo Vida
F.I.M. Bankinter PPR 35 Bankinter Gestão de Ativos 07/11/2016 Fundo de Investimento Mobiliário NB PPR Renda Mensal II GNB Seguros Vida 03/04/2017 Ramo Vida
NB PPR Renda Mensal IV GNB Seguros Vida 03/04/2017 Ramo Vida NB PPR Renda Mensal I GNB Seguros Vida 03/04/2017 Ramo Vida NB PPR Renda Mensal III GNB Seguros Vida 03/04/2017 Ramo Vida F.P. Caixa PPR Rendimento Mais CGD Pensões 10/07/2017 Fundo de Pensões
28
Figure 2. Fertility Rate in OECD Countries (World Bank, 1960-2015)
Fertility Rate
Figure 1. Life Expectancy at Birth in OECD Countries (World Bank, 1960-2015) viders (own calculations based on APFIPP data)
29
30
Figure 6. The Pension Funds Market in Portugal (ASF, 2017)
31
Figure 9. Number of Participants by gender (ASF reports: Estatísticas de Fundos de Pensões, 2011-2016)
Figure 11. PPPs’ investment structure (ASF reports: Estatísticas de Fundos de Pensões, 2011-2016) viders (own calculations based on APFIPP data)
32
Figure 12. Average PPP’s monthly returns (own calculations based on APFIPP information)
33
Figure 14. Average benchmark’s monthly returns (own calculations based on Bloomberg’s database)
34
Figure 16. Average PPP Return Vs Average Benchmark Return
Figure 17. Histogram of total personal pension plan’s average return
35
Figure 20. Histogram of the Modigliani-Modigliani Risk Adjusted Return Figure 19. Histogram of the difference in returns