Stability and adaptability of curled green-leaf lettuce
lines using the REML/Blup mixed model
Willame dos Santos Candido(1), Renato Silva Soares(2), Carolina Andrade Franco(2),
Guilherme Matos Martins Diniz(2), Edgard Henrique Costa Silva(2),
Marcus Vinicius Marin(2) and Leila Trevisan Braz(2)
(1)Universidade Federal de Goiás, Regional Jataí, BR 364, Km 195, no 3.800, CEP 75801-615 Jataí, GO, Brazil. E-mail: candidows.melhorista@gmail.com (2)Universidade Estadual Paulista Júlio de Mesquita Filho, Via de Acesso Prof. Paulo Donato Castellane, s/no, CEP 14884-900 Jaboticabal, SP, Brazil. E-mail: renato_2366@hotmail.com, carol.a.franco@hotmail.com, guilhermedinizzz@hotmail.com, edgarddragde@gmail.com, marcusvmarin@gmail.com, leilatb@fcav.unesp.br
Abstract – The objective of this work was to estimate the stability and genotypic adaptability of advanced lines and cultivars of curled green-leaf lettuce (Lactuca sativa), in different growing environments and seasons, using the REML/Blup mixed model. Ten genotypes, seven cropping environments, and two growing seasons were studied in 2015. Plant yield traits were evaluated, and data were subjected to the Selegen-REML/Blup software. Genotype stability and adaptability were analyzed using the harmonic mean of genotypic values (HMGV) and the relative performance of genotypic values (RPGV), respectively. The harmonic mean of RPGV (HMRPGV) was used to simultaneously estimate the stability, adaptability, and yield of breeding lines or cultivars. Considering the combined analysis of the two seasons for the set of traits, the lines L6, L7, and L8 were selected as promising ones and recommended for planting. The breeding lines selected for all season exhibit good yield and are considered superior to the commercial cultivars Vanda and Vera.
Index terms: Lactuca sativa, cropping systems, HMRPGV, mixed models.
Estabilidade e adaptabilidade em linhagens de
alface-crespa por modelo misto REML/Blup
Resumo – O objetivo deste trabalho foi estimar a estabilidade e a adaptabilidade genotípica de linhagens avançadas e cultivares de alface-crespa (Lactuca sativa), em diferentes sistemas de cultivos e épocas, pelo modelo misto REML/Blup. Foram avaliados dez genótipos de alface, sete sistemas de cultivo e duas épocas, em 2015. Avaliaram-se os caracteres de produção das plantas, e os dados foram submetidos ao programa Selegen-REML/Blup. A estabilidade e a adaptabilidade genotípica foram analisadas pelos métodos da média harmônica dos valores genotípicos (MHVG) e do desempenho relativo dos valores genotípicos (PRVG), respectivamente. A média harmônica do PRVG (MHPRVG) foi utilizada para estimar simultaneamente a estabilidade, a adaptabilidade e a produtividade das linhagens e das cultivares. Ao se considerar a análise conjunta das duas épocas para o conjunto dos caracteres, as linhagens L6, L7 e L8 foram selecionadas como promissoras e recomendadas para plantio. As linhagens selecionadas para todas as épocas apresentam bons rendimentos e são consideradas superiores às cultivares comerciais Vanda e Vera.
Termos para indexação: Lactuca sativa, sistemas de cultivos, MHPRVG, modelos mistos.
Introduction
Lettuce is one of the most important leafy vegetables being marketed in the street markets and supermarkets of Brazil (Agrianual, 2016). It is predominantly consumed in natura, in the form of salads, and it is highly appreciated in fast food chains. A general characteristic of lettuce cropping is the high-labor requirement throughout its productive cycle, however, it adequate cultivation allows of good economic returns in short-term periods and small areas (Sala & Costa, 2012).
allow of procedures to be minimized and exploited (Cruz et al., 2012).
The genotype x environment interaction analysis alone does not provide enough information on the best genotypes for each environment. The selection of a lettuce cultivar for planting should consider the performance showed by the elite materials in the production systems practiced by the farmers. Therefore, it is important to study the genotypes adaptability and stability.
Currently, several methodologies are used to quantify the stability and adaptability of lines and cultivars; however, more recent methodologies, such as the mixed models (Resende, 2007) and the Bayesian method (Mora et al., 2007; Molina, 2007) have been widely used.
The mixed models, such as the restricted maximum likelihood (REML), which is used to obtain the components of variance, and the best linear unbiased predictor (Blup) have been performed to predict the genetic values and components of variance (Resende, 2007, 2016).
The REML/Blup methodology has the advantage of considering the genotypic values, rather than the phenotypic ones, which gives a better accuracy to the breeding process, allowing of the selection of the best genotypes. It is also possible to carry out genotype ordering based on genetic values, through the harmonic mean of the relative performance of genetic values (MHPRVG - BLUP) (Resende, 2004).
This is the first work that uses the mixed models to study the interaction genotypes x environments in lettuce. However, this methodology has been used to interpret the stability and genotypic adaptability of some vegetables, such as carrot (Silva et al., 2011), cowpea (Torres et al., 2015), strawberry (Costa et al., 2015), and pepper (Pimenta et al., 2016). The suitability of this tool in vegetable crops, such as lettuce that shows an autogamous breeding system, can be very useful in increasing the selection efficiency of breeding programs.
The objective of the present work was to estimate the stability and genotypic adaptability of the advanced lines and cultivars of curled green-leaf lettuce under different growing environments and seasons, using the REML/Blup mixed model.
Materials and Methods
The experiments were installed in the sector of vegetable and aromatic and medicinal plants, in the Faculdade de Ciências Agrárias e Veterinárias of Universidade Estadual Paulista (Unesp-FCAV), Jaboticabal, SP, Brazil, at 21º15'22"S, 48º18'58"W, at 595-m altitude.
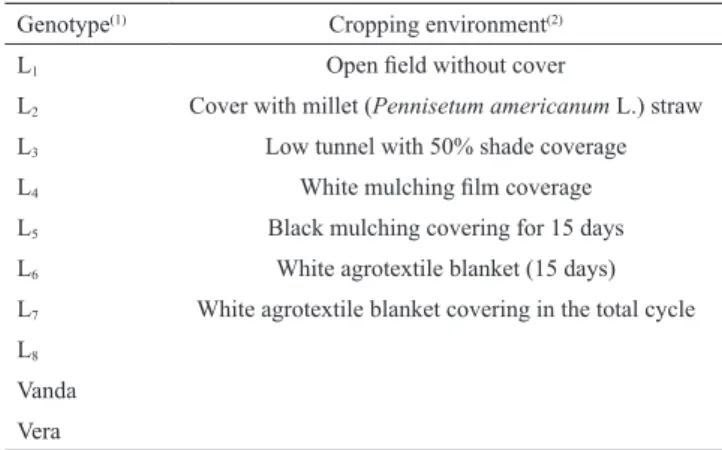
An experimental randomized complete block design (RCBD) was used. The treatments consisted of ten lettuce (Lactuca sativa L.) genotypes (eight lines and two cultivars – Vanda and Vera), seven cropping environments, and two growing seasons (Table 1), with four replicates. Each plot was constituted by four lines of 1.5 m length, spaced at 25x25 cm, in a triangular arrangement, totaling 24 plants, from which the six central plants were used for evaluation.
The breeding lines evaluated were from the initial crosses between the line JAB 4-13-7 (male parent with the Dm18 gene) and the cultivars Argelis (A) with the resistance factor R38, Vanda (V), Veneranda (Vn), and Solaris (S) (female parents), and advanced by means of the pedigree breeding method. These lines are resistant to the races of the downy mildew of lettuce (Bremia lactucae) occurring in the state of São Paulo (Castoldi et al., 2014).
Growing periods consisted of the summer (January– March) and winter (June–August) of 2015. The following seven cropping environments were studied: open field without cover, cover with millet straw (Pennisetum americanum L.), low tunnel with 50% shade coverage, white mulching film coverage, black mulching cover, white agrotextile blanket covering for 15 days, and white agrotextile blanket covering in the total cycle.
The seedlings were produced in 288-cell plastic trays, which contained a mixture of the commercial substrate Bioplant and vermiculite. After 30 days of sowing, seedlings showing two definitive leaves were transplanted to the previously prepared and fertilized beds.
The soil sampled from the experimental area had the following chemical characteristics: pH in CaCl2,
5.1; organic matter, 17 g dm-3; P, 130 mg dm-3; K, 4.8
mmolc dm-3; Ca, 25 mmolc dm-3; Mg, 10 mmolc dm-3;
H+Al, 31 mmolc dm-3; sum of bases, 39.8 mmolc dm-3;
cation exchange capacity (CEC) at pH 7.0, 70.8 mmolc
dm-3; and base saturation (BS), 56%. Corrections
recommendations of Trani et al. (2014) for lettuce in the state of São Paulo.
Evaluations were performed approximately 35 and 45 days after transplantation in the summer and winter, respectively. The following characters were evaluated according to Figueiredo et al. (2004): plant volume (V, in cm3 per plant), calculated from the diameter and
height of plants, by the formula for the half volume of an ellipsoid, with diameters D1 (larger diameter) and
D2 (smaller diameter), of the head and height (A) of the
six plants, that is, V = 4/3 π (D1/2)(D2/2)A; number
of leaves per plant (NL), calculated by counting the number of leaves that have reached a length ≥3.0 cm; marketable production (MP, in grams per plant), obtained by calculating the average of the fresh mass of the aerial parts of six plants, after the removal of old leaves and spare stem; total production (TP, in grams per plant), obtained by calculating the average of the fresh mass of the aerial parts of six plants (without the removal of old leaves and stem); length of the stem (LS, in cm), measured by means of a graduated ruler.
The selection of the superior genotypes was performed by using the multivariate index of Mulamba & Mock (1978), also known as the classification sum index or rank sum. The 30% selection criterion was adopted. The same weight was considered for all characters.
The evaluation of adaptability and stability was performed using the Selegen program (Resende, 2016), which employs the REML/Blup methodology,
considering the statistical model 114, for the genetic evaluation by the highest values of the harmonic mean of the genotypic values (HMGV) (Resende, 2007).
The significance of the effects of the model was estimated by deviance analysis, and the estimation of the genetic parameters was performed according to Resende (2007). The analyzed genetic parameters were: Vg, genotypic variance; Vgs, variance of the interaction genotype x season; Vge, variance of the interaction genotype x environment; Vges, variance of the interaction genotype x environment x season; Vr, residual variance; Vph, individual phenotypic variance; h², heritability in the broad sense; c²gs, coefficient of determination of the interaction genotype x season effects; c²ge, coefficient of determination of genotype x environment interaction effects; c²ges, coefficient of determination of the interaction genotype x environment x season effects; rge, genotypic correlation across environments, valid for any season; rgs, genotypic correlation across the seasons, valid for any environment; rge_s, genotypic correlation across environments at a given season; rgs_e, genotypic correlation through the season, in a given environment; rge_ms, genotypic correlation across environments, for the mean of all seasons; rgs_me, genotypic correlation across the seasons, for the average of all environments; and rges, genotypic correlation across environments and seasons.
The harmonic mean of the genotypic values (HMGV) was calculated for the evaluation of stability; the relative performance of the genotypic values (RPGV) was used for the evaluation of adaptability; and the harmonic mean of RPGV (HMRPGV) was used for the evaluation of stability, adaptability, and yield. All three parameters were simultaneously calculated for all genotypes according to the following expressions (Resende, 2007):
HMGV= RPGV= and
= =
∑
∑
1 1 1 1 1 1 1 GV l GV M HMRPGV RPGV j i j j j , , ll=∑
11in which: l is the number of environments; VG is the genotypic value; and j represent the genotypes.
Table 1. Genotypes and cropping environments used in the
experiments carried out in the summer (January–March) and winter (June–August) growing seasons in 2015.
Genotype(1) Cropping environment(2)
L1 Open field without cover
L2 Cover with millet (Pennisetum americanum L.) straw
L3 Low tunnel with 50% shade coverage
L4 Whitemulching film coverage
L5 Blackmulching covering for 15 days
L6 White agrotextile blanket (15 days)
L7 White agrotextile blanket covering in the total cycle
L8
Vanda
Vera
(1)Identification of curled green-leaf lettuce lines: L
Results and Discussion
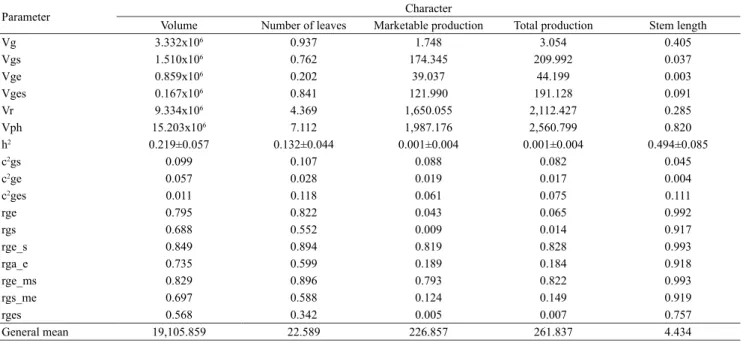
The estimated values of the determination coefficients of the genotypic effects (given by broad-sense heritability h2), free of the interactions of a
given genotype in a given growing environment and season, showed low values, mainly for the production characters. However, considering that production characters are polygenic, the results obtained were consistent (Table 2).
For all characters, except for stem length, the environmental variance was the most influential component of the phenotypic value, indicating that the expressions of these characters are strongly influenced by the environmental component. The component of genotypic variance Vg was higher than the interactions Vgs, Vge, and Vges for the characters volume, number of leaves, and stem length, so that the genotypic variabilities of the evaluated lettuce genotypes were
of a greater magnitude than the the variances of the interactions (Table 2).
The results obtained in the present work corroborate those found by Queiroz et al. (2014), who worked with lettuce stability at different times and growing environments, and verified that the phenotypic variance for the characters total and marketable production and for number of leaves had a strong environmental influence, and that the genetic variance was superior to the variance of the interactions. For the production characters, marketable production and total production, the variance of the interaction genotype × growing season (Vgs) was higher than those of the other interactions, as well as of the genotypic variance, evidencing that the characters are strongly influenced by growing seasons.
The genotypic correlation coefficients – rge, rgs, rge_s, rgs_e, rge_ms, rgs_me, and rges, obtained through the environments – had mean correlation
Table 2. Estimates of variance components and genetic parameters for volume (V), number of leaves (NL), marketable
production (MP), total production (TP), and stem length (SL) of curled green-leaf lettuce (Lactuca sativa), involving ten genotypes, tested in seven cropping environments and two growing seasons, in the municipality of Jaboticabal, in the state of São Paulo, Brazil, in 2015.
Parameter Character
Volume Number of leaves Marketable production Total production Stem length
Vg 3.332x10⁶ 0.937 1.748 3.054 0.405
Vgs 1.510x10⁶ 0.762 174.345 209.992 0.037
Vge 0.859x10⁶ 0.202 39.037 44.199 0.003
Vges 0.167x10⁶ 0.841 121.990 191.128 0.091
Vr 9.334x10⁶ 4.369 1,650.055 2,112.427 0.285
Vph 15.203x10⁶ 7.112 1,987.176 2,560.799 0.820
h2 0.219±0.057 0.132±0.044 0.001±0.004 0.001±0.004 0.494±0.085
c2gs 0.099 0.107 0.088 0.082 0.045
c2ge 0.057 0.028 0.019 0.017 0.004
c2ges 0.011 0.118 0.061 0.075 0.111
rge 0.795 0.822 0.043 0.065 0.992
rgs 0.688 0.552 0.009 0.014 0.917
rge_s 0.849 0.894 0.819 0.828 0.993
rga_e 0.735 0.599 0.189 0.184 0.918
rge_ms 0.829 0.896 0.793 0.822 0.993
rgs_me 0.697 0.588 0.124 0.149 0.919
rges 0.568 0.342 0.005 0.007 0.757
General mean 19,105.859 22.589 226.857 261.837 4.434
Vg, genotypic variance; Vgs, variance of the genotype x season interactions; Vge, variance of genotype x environment interactions; Vges, variance of the genotype x environment x season interactions; Vr, residual variance; Vph, individual phenotypic variance; h², heritability in the broad sense;
c²gs, coefficient of determination of the effects of genotype x season interactions; c²ge, coefficient of determination of the effects of genotype x environment interactions; c²ges, coefficient of determination of the effects of genotype x environment x season interactions; rge, genotypic correlation
estimates of 0.737, 0.670, 0.283, 0.296, and 0.927 for the characters volume, number of leaves, marketable production, total production, and stem length, respectively. Thus, a simple character interaction was found for the characters volume, number of leaves, and stem length, and a complex interaction for the characters marketable production and total production (Table 2). Costa et al. (2015) found a genotypic correlation of 0.418 for the interaction genotype × location × year in strawberry cultivars, indicating a moderately complex interaction for yield. Similarly, Borges et al. (2012) found a low rges magnitude (0.450), showing a moderately complex interaction for yield in upland rice lines. Therefore, our result shows the strong expression of a complex interaction in the present study for the characters marketable production and total production.
For the characters marketable production and total production, the genotypic correlation of low magnitude through environments, valid for any time (rge) and across the seasons, was valid for any environment (rgs), indicating an alteration in genotype ordering in different environments. The occurrence of low genotypic correlations indicates high genotype × environment interactions, which changes the ordering of genotypes through environments and growing seasons (Resende, 2007).
When the genotypic correlation was observed through the environments and growing seasons (rges), the characters number of leaves, marketable production, and total production showed a low magnitude of correlation, evidencing a high level of complex interaction. Therefore, the genotypes did not exhibit
the same behavior in different environments where they were evaluated. This level of correlation indicates that the interaction is problematic for the breeder, since for the characters volume and stem length, a low effect of complex interaction was observed.
The values of the genotypic correlation across the environments at a given time (rge_s), and the mean of all growing seasons (rge_ms) were of high magnitude for all evaluated characters, indicating that the genotypes showed similar performances through the environments, which facilitates the selection of lines and cultivars in these environments. When evaluating the genotypic correlation across the growing seasons in a given environment (rgs_e) and for the mean of all environments (rgs_me), low to moderate correlations were observed for the characters stem length, marketable production, and total production, indicating that the performances of the genotypes were strongly affected by the seasonal effects; in this way, the importance of testing genotypes at various times is highlighted.
According to the joint analysis of deviance (Anadev) of model 114, the genotype effect showed significance only for the characters volume and stem length (Table 3). Significant effects of the genotype × season interactions were observed for all characters, indicating the importance of season in the differential performance of the studied lettuce genotypes. For the interaction genotype × environment in the studied model, only the character volume showed a significant effect. In the triple interaction genotype × environment × season, only the characters number of leaves and stem length were significant.
Table 3. Global joint analysis of deviance (Anadev) on the analysis involving 10 genotypes of curled green-leaf lettuce
(Lactuca sativa), tested in seven cropping environments in the summer and winter, for the characters volume (V), number of leaves (NL), marketable production (MP), total production (TP), and stem length (SL) in the municipality of Jaboticabal, in the state of São Paulo, Brazil, 2015.
Effect Volume Number of leaves Marketable production Total production Stem length Deviance LRT Deviance LRT Deviance LRT Deviance LRT Deviance LRT Genotype 8,546.7* 4.61* 1,451.5ns 2.25ns 4,298.2ns 0.00ns 4,422.7ns 0.00ns 157.3** 12.81**
Genotype x environment 8,546.2* 4.12* 1,449.7ns 0.45ns 4,298.4ns 0.22ns 4,422.9ns 0.16ns 144.6ns 0.02ns
Genotype x season 8,557.3** 15.21* 1,458.4** 9.13** 4,308.8** 10.61** 4,430.8** 8.09** 149.1* 4.61* Genotype x environment x season 8,542.2ns 0.09ns 1,457.6** 8.27** 4,299.8ns 1.65ns 4,425.1ns 2.42ns 167.5** 22.97**
Complete model 8,542.1 - 1,449.3 - 4,298.2 - 4,422.7 - 144.5
-General mean 19,105.9 - 22.6 - 226.9 - 4,422.7 - 4.4
When studying the phenotypic stability of lettuce in different seasons and cropping environments, Queiroz et al. (2014) also found a difference in the productive performance of cultivars in relation to growing seasons. Similar results were also found by Gualberto et al. (2009), when studying the adaptability and phenotypic stability of green-leaf lettuce cultivars in hydroponic cropping; these authors also verified the interaction of cultivars with environments for all evaluated characteristics, which is corroborated by the results obtained in the present work.
Considering the genotypic values (Blup) obtained in the model 114, the three best lines selected by the Mulamba and Mock multivariate index, for all the characters and environments evaluated, were L6, L7,
and L8 which proved to be promising for cropping
recommendation (Table 4). The selected lines showed superiority mainly for the characters marketable production and total production, which are important for cultivar recommendation.
The HMGV, RPGV, and HMRPGV estimates generally classified the genotypes in a similar way when using each of the three parameters obtained by the Blup procedure for the characters volume, number of leaves, marketable production, total production, and stem length, showing that the selected lines stand out because they show high stability and adaptability for the evaluated characters (Table 5). According to Sediyama et al. (2009), the number of leaves is of great
interest for good production. Therefore, in order to obtain high-yielding cultivars, it is necessary to select materials with good adaptability and stability for this characteristic. For the character, the three best lines classified by the criterion of stability and adaptability were L1, L2, and L3. For number of leaves, the selected
lines were L6, L7, and L8; while for the characters
marketable production and total production, the selected lines were L2, L6, and L8. For the character
stem length, the lines L5, L7, and L8 were selected, so
that the opposite direction of selection was met for stem length.
In the comparison of this classification with that obtained from the genotypic values, it was observed that these were also classified in a similar way for the characters volume, number of leaves, and stem length (Table 5). For the characters marketable production and total production, the divergence was observed only for one breeding line, either by Blup or stability and adaptability methods. The lines L3, L6,and L8 were
selected according to the results of the Blup analysis, whereas the lines L2, L6, and L8 were selected according
to the classification referring to the parameters of stability and adaptability. Therefore, HMGV, RPGV, and HMRPGV statistics are observed as efficient tools to assist the breeder in the selection of the best genotypes in lettuce breeding programs.
Similar results were found by Torres et al. (2015), who studied the genotype × environment interactions using
Table 4. Mulamba and Mock indices applied to the genetic values of the characters, for the joint analysis of 10 genotypes of
curled green-leaf lettuce (Lactuca sativa) in seven cropping environments and two growing seasons, in the municipality of Jaboticabal, in the state of São Paulo, Brazil, 2015.
Genotype Genetic values
Plant volume Number of Marketable production Total production Stem length Rank (cm3 per plant) leaves (g per plant) (g per plant) (cm)
L1 20,541.99 (2) 22.13 (9) 226.73 (4) 261.78 (4) 5.02 (9) 28
L2 20,483.06 (3) 22.34 (6) 226.69 (5) 261.75 (5) 4.84 (8) 27
L3 21,674.07 (1) 22.25 (8) 226.93 (3) 262.19 (3) 5.32 (10) 25
L4 19,423.58 (5) 22.35 (5) 226.51 (8) 261.41 (8) 4.32 (4) 30
L5 16,194.14 (10) 22.27 (7) 226.62 (7) 261.04 (10) 3.04 (1) 35
L6 19,817.59 (4) 23.35 (3) 228.17 (1) 263.37 (1) 4.47 (6) 15
L7 18,898.56 (6) 23.77 (1) 226.69 (6) 261.65 (6) 4.21 (3) 22
L8 18,878.08 (7) 23.57 (2) 227.33 (2) 262.35 (2) 4.13 (2) 15
Vanda 17,489.92 (9) 22.74 (4) 226.46 (9) 261.54 (7) 4.47 (5) 34
Vera 17,657.59 (8) 21.13 (10) 226.44 (10) 261.30 (9) 4.52 (7) 44
General mean 19,105.86 22.59 226.86 261.84 4.43
Table 5. Harmonic mean of genotypic values (HMGV), relative performance of genotypic values (RPGV), and RPGV multiplied by the general mean (GM), harmonic mean of relative performance of genotypic values (HMRPGV) and HMRPGV multiplied by the general mean (GM), for the characters volume, number of leaves, marketable production, total yield, and stem length of 10 curled green-leaf lettuce (Lactuca sativa) genotypes for stability, adaptability, and stability and adaptability, respectively, for seven cropping environments and two growing seasons, in the municipality of Jaboticabal, in the state of São Paulo, Brazil, 2015.
Genotype HMGV RPGV RPGV*GM HMRPGV HMRPGV*GM
Volume
L1 19,708.19 (2) 1.08 20,547.49 (2) 1.08 20,543.37 (2)
L2 19,603.34 (3) 1.07 20,478.76 (3) 1.07 20,467.78 (3)
L3 20,942.69 (1) 1.14 21,779.56 (1) 1.14 21,752.81 (1)
L4 18,687.42 (5) 1.02 19,459.27 (5) 1.02 19,445.31 (5)
L5 15,312.04 (10) 0.84 16,076.29 (10) 0.84 16,056.71 (10)
L6 18,925.22 (4) 1.04 19,775.97 (4) 1.03 19,772.59 (4)
L7 18,147.80 (6) 0.99 18,913.89 (6) 0.99 18,911.39 (6)
L8 18,029.39 (7) 0.98 18,838.79 (7) 0.98 18,823.38 (7)
Vanda 16,795.35 (9) 0.92 17,511.23 (9) 0.91 17,665.98 (9)
Vera 16,957.84 (8) 0.93 17,677.35 (8) 0.92 17,665.98 (8)
Number of leaves
L1 21.86 (9) 0.98 22.13 (9) 0.98 22.13 (9)
L2 22.06 (6) 0.99 22.33 (6) 0.99 22.34 (6)
L3 21.96 (8) 0.98 22.25 (8) 0.98 22.24 (8)
L4 22.08 (5) 0.99 22.35 (5) 0.99 22.35 (5)
L5 22.01 (7) 0.99 22.28 (7) 0.99 22.27 (7)
L6 23.09 (3) 1.03 23.36 (3) 1.03 23.36 (3)
L7 23.49 (1) 1.05 23.78 (1) 1.05 23.78 (1)
L8 23.30 (2) 1.04 23.58 (2) 1.04 23.57 (2)
Vanda 22.43 (4) 1.01 22.72 (4) 1.01 22.72 (4)
Vera 20.83 (10) 0.93 21.11 (10) 0.93 21.11 (10)
Marketable production
L1 206.71 (6) 0.99 (6) 226.60 (6) 0.99 (6) 226.58 (6)
L2 207.67 (2) 1.00 (3) 227.07 (3) 1.00 (3) 227.05 (3)
L3 206.42 (9) 0.99 (7) 226.56 (7) 0.99 (7) 226.54 (7)
L4 206.20 (10) 0.99 (10) 226.36 (10) 0.99 (10) 226.33 (10)
L5 206.44 (8) 0.99 (9) 226.45 (9) 0.99 (9) 226.43 (9)
L6 208.17 (1) 1.01 (1) 228.19 (1) 1.01 (1) 228.17 (1)
L7 206.97 (5) 0.99 (4) 226.74 (4) 0.99 (4) 226.74 (4)
L8 207.43 (3) 1.00 (2) 227.46 (2) 1.00 (2) 227.42 (2)
Vanda 206.64 (7) 0.99 (8) 226.46 (8) 0.99 (8) 226.44 (8)
Vera 207.16 (4) 0.99 (5) 226.68 (5) 0.99 (5) 226.67 (5)
Total production
L1 241.26 (6) 0.99 (6) 261.66 (6) 0.99 (6) 261.64 (6)
L2 242.19 (2) 1.00 (3) 262.13 (3) 1.00 (3) 262.11 (3)
L3 241.13 (7) 0.99 (4) 261.79 (4) 0.99 (4) 261.77 (4)
L4 240.63 (9) 0.99 (9) 261.25 (9) 0.99 (9) 261.23 (9)
L5 240.49 (10) 0.99 (10) 260.89 (10) 0.99 (10) 260.89 (10)
L6 243.04 (1) 1.01 (1) 263.46 (1) 1.01 (1) 263.44 (1)
L7 241.43 (5) 0.99 (5) 261.69 (5) 0.99 (5) 261.69 (5)
L8 242.13 (3) 1.00 (2) 262.53 (2) 1.00 (2) 262.51 (2)
Vanda 241.03 (9) 0.99 (8) 261.43 (8) 0.99 (8) 261.42 (8)
Vera 241.48 (4) 0.99 (7) 261.52 (7) 0.99 (7) 261.50 (7)
mixed models, in semiprostrated cowpea genotypes. These authors verified that there was an agreement between the HMGV, RPGV, and HMRPGV statistics for the discrimination of the most productive genotypes with high adaptability and stability, indicating that they can be a part of the selective criteria in routine cowpea breeding programs.
Conclusions
1. The curled green-leaf lettuce lines L6, L7, and L8
remain more stable and adaptable for the components of lettuce (Lactuca sativa) production, as they respond better to the seasons and environments, and are superior to the commercial cultivars Vanda and Vera.
2. The mixed model REML/Blup discriminates lettuce genotypes with high adaptability and stability, and are indicated in the routine of lettuce breeding programs.
Acknowledgments
To Coordenação de Aperfeiçoamento de Pessoal de Nível Superior (Capes), for scholarship granted.
References
AGRIANUAL 2016: anuário da agricultura brasileira. São Paulo: FNP, 2016. 307p.
BORGES, V.; SOARES, A.A.; RESENDE, M.D.V. de; REIS, M. de S.; CORNELIO, V.M. de O.; LEITE, N.A.; SOARES, P.C.; COSTA JÚNIOR, G.T. Value for cultivation and use of upland rice cultivars tested in multi-environments. Crop Breeding and
Applied Biotechnology, v.12, p.25-33, 2012. DOI:
10.1590/S1984-70332012000100004.
CASTOLDI, R.; CHARLO, H.C.O.; MELO, D.M.; CANDIDO, W.S.; VARGAS, P.F.; DALPIAN, T.; BRAZ, L.T. Obtaining resistant lettuce progenies to downy mildew. Horticultura
Brasileira, v.32, p.69-73, 2014. DOI:
10.1590/S0102-05362014000100011.
COSTA, A.F.; LEAL, N.R.; VENTURA, J.A.; GONÇALVES, L.S.A.; AMARAL JÚNIOR, A.T. do; COSTA, H. Adaptability and stability of strawberry cultivars using a mixed model. Acta
Scientiarum. Agronomy, v.37, p.435-440, 2015. DOI: 10.4025/
actasciagron.v37i4.18251.
CRUZ, C.D.; REGAZZI, A.J.; CARNEIRO, P.C.S. Modelos
biométricos aplicados ao melhoramento genético. 4.ed. Viçosa:
Ed. da UFV, 2012. 514p.
FIGUEIREDO, E.B. de; MALHEIROS, E.B.; BRAZ, L.T. Interação genótipo x ambiente em cultivares de alface na região de Jaboticabal. Horticultura Brasileira, v.22, p.66-71, 2004. DOI: 10.1590/S0102-05362004000100013.
GUALBERTO, R.; OLIVEIRA, P.S.R. de; GUIMARÃES, A. de M. Adaptabilidade e estabilidade fenotípica de cultivares de alface do grupo crespa em cultivo hidropônico. Horticultura Brasileira, v.27, p.7-11, 2009. DOI: 10.1590/S0102-05362009000100002. MOLINA, M.R. Um estudo sobre métodos estatísticos na avaliação da interação genótipo x ambientes em genótipos
de arroz (Oryza sativa L.). 2007. 68p. Tese (Doutorado) –
Universidade Estadual Paulista, Jaboticabal.
MORA, F.; PUPIM-JUNIOR, F.; SCAPIM, C.A. Predicción del efecto de cultivares de algodón en la presencia de interacción genótipo-ambiente. Ciencia e Investigación Agraria, v.34, p.105-110, 2007. DOI: 10.4067/S0718-16202007000100002. MULAMBA, N.N.; MOCK, J.J. Improvement of yield potential of the Eto Blanco maize (Zea mays L.) population by breeding for plant traits. Egyptian Journal of Genetics and Cytology, v.7, p.40-51, 1978.
PIMENTA, S.; MENEZES, D.; NEDER, D.G.; MELO, R.A.; ARAUJO, A.L.R.; MARANHÃO, E.A.A. Adaptability and
Continuation...
Genotype HMGV RPGV RPGV*GM HMRPGV HMRPGV*GM
Stem length
L1 4.98 (2) 1.13 5.03 (2) 1.13 5.03 (2)
L2 4.79 (3) 1.09 4.84 (3) 1.09 4.84 (3)
L3 5.28 (1) 1.20 5.32 (1) 1.20 5.32 (1)
L4 4.27 (7) 0.97 4.31 (7) 0.97 4.31 (7)
L5 2.98 (10) 0.68 3.03 (10) 0.68 3.02 (10)
L6 4.43 (5) 1.01 4.47 (5) 1.01 4.48 (5)
L7 4.16 (8) 0.95 4.21 (8) 0.95 4.21 (8)
L8 4.08 (9) 0.93 4.13 (9) 0.93 4.13 (9)
Vanda 4.42 (6) 1.01 4.47 (6) 1.01 4.47 (6)
Vera 4.48 (4) 1.02 4.52 (4) 1.02 4.52 (4)
stability of pepper hybrids under conventional and organic production systems. Horticultura Brasileira, v.34, p.168-174, 2016. DOI: 10.1590/S0102-053620160000200004.
QUEIROZ, J.P. da S.; COSTA, A.J.M. da; NEVES, L.G.; SEABRA JÚNIOR, S.; BARELLI, M.A.A. Estabilidade fenotípica de alfaces em diferentes épocas e ambientes de cultivo.
Ciência Agronômica, v.45, p.276-283, 2014. DOI:
10.1590/S1806-66902014000200007.
RESENDE, M.D.V. de. Matemática e estatística na análise de
experimentos e no melhoramento genético. Colombo: Embrapa
Florestas, 2007. 561p.
RESENDE, M.D.V. de. Métodos estatísticos ótimos na análise de
experimentos de campo. Colombo: Embrapa Florestas, 2004. 57p.
RESENDE, M.D.V. de. Software Selegen-REML/BLUP: a useful tool for plant breeding. Crop Breeding and
Applied Biotechnology, v.16, p.330-339, 2016. DOI:
10.1590/1984-70332016v16n4a49.
SALA, F.C.; COSTA, C.P. da. Retrospectiva e tendência da alfacicultura brasileira. Horticultura Brasileira, v.30, p.187-194, 2012. DOI: 10.1590/S0102-05362012000200002.
SEDIYAMA, M.A.N.; PEDROSA, M.W.; SALGADO, L.T.; PEREIRA, P.C. Desempenho de cultivares de alface para cultivo hidropônico no verão e no inverno. Científica, v.37, p.98-106, 2009. DOI: 10.15361/1984-5529.2009v37n2p98+-+106.
SILVA, G.O. da; CARVALHO, A.D.F. de; VIEIRA, J.V.; BENIN, G. Verificação da adaptabilidade e estabilidade de populações de cenoura pelos métodos AMMI, GGE biplot e REML/ BLUP. Bragantia, v.70, p.494-501, 2011. DOI: 10.1590/S0006-87052011005000003.
TORRES, F.E.; TEODORO, P.E.; SAGRILO, E.; CECCON, G.; CORREA, A.M. Interação genótipo x ambiente em genótipos de feijão-caupi semiprostrado via modelos mistos. Bragantia, v.74, p.255-260, 2015. DOI: 10.1590/1678-4499.0099.
TRANI, P.E.; PURQUERIO, L.F.V.; FIGUEIREDO, G.J.B.; BLAT, S.F.; COSTA, C.P. Alface. In: AGUIAR, A.T. de E.; GONÇALVES, C.; PATERNIANI, M.E.A.G.Z.; TUCCI, M.L.S.; CASTRO, C.E.F. de (Ed.). Instruções agrícolas para as
principais culturas econômicas. 7.ed. rev. e atual. Campinas:
Instituto Agronômico, 2014. p.8-10. (IAC. Boletim técnico, 200).