AR
TIGO
AR
TICLE
4209
Evidence on nutritional assessment techniques and parameters
used to determine the nutritional status of children
and adolescents: systematic review
Evidência sobre técnicas e parâmetros de avaliação nutricional
para crianças e adolescentes: revisão sistemática
Resumo O objetivo deste artigo é revisar siste-maticamente as evidências sobre as técnicas de avaliação nutricional e parâmetros utilizados para determinar o estado nutricional em crianças e adolescentes. Revisão da literatura com busca nas bases de dados, Medline, Lilacs, SciELO e Em-base, além de arquivos pessoais. Identificamos 17 artigos que relatavam dados de diferentes popula-ções, sete estudos abordaram os índices antropo-métricos, quatro o crescimento e o desenvolvimen-to de crianças e adolescentes por meio de curvas de crescimento, e o restante a composição corporal. Todos preencheram os critérios de qualidade, com exceção das limitações. A revisão da literatura sugere diversas técnicas e parâmetros que podem ser aplicados para determinar o estado nutricio-nal de crianças e adolescentes de diferentes países. Gráficos de crescimento são essenciais para ava-liar a saúde de crianças, mas depende muito das tabelas de crescimento utilizadas. Embora o IMC seja prático, não distingue a gordura corporal de massa magra. Existem várias técnicas para ava-liar proporções, tamanho e composição corporal. A melhor interpretação da antropometria depen-derá de valores de referência válidos para a faixa etária da população estudada. BIA é um método factível, mas tem algumas limitações para a reali-zação do exame.
Palavras-chave Estado nutricional, Crianças,
Composição corporal Abstract This article aims to review
system-atically the evidence on nutritional assessment techniques and parameters used to determine the nutritional status of children and adolescents. The literature review and the selection of publi-cations were performed using the Medline, Lilacs, SciELO, Embase, personal files. 17 studies were identified, 7 addressed the anthropometric indices as the main outcome, 7 analyzed the growth and development of children and adolescents through growth curves, and the remainder surveyed body composition. In general, all met the quality cri-teria, unless 6 of the articles who did not discuss the limitations. The literature review suggests several techniques and parameters that can be applied to determine the nutritional status of children and adolescents from different countries. Growth graphs are essential to assess the health of children, but depend greatly of the growth ta-bles used. Although BMI can be practical, it does not distinguish body fat from lean mass. The best interpretation of anthropometry will depend of valid reference values for age range of the study population. BIA is a quick feasible method, but the measurement has some various nationalities.
Key words Nutritional status, Children, Body
composition
Aline dos Santos Sampaio 1
Matias Epifanio 1
Caroline Abud Drumond Costa 1
Vera Lúcia Bosa 2
Franceliane Jobim Benedetti 3
Edgar Enrique Sarria 4
Suelen Goecks Oliveira 1
Eduardo Mundstock 1
Rita Mattiello 1
DOI: 10.1590/1413-812320182312.31502016
1 Programa de
Pós-Graduação em Pediatria e Saúde da Criança, Pontifícia Universidade Católica do Rio Grande do Sul. Av. Ipiranga 6690/2º, Partenon. 90610-000 Porto Alegre RS Brasil.
2 Programa de
Pós-Graduação em Alimentação, Nutrição e Saúde, Universidade Federal Federal do Rio Grande do Sul. Porto Alegre RS Brasil.
3 Universidade Franciscana.
Santa Maria RS Brasil.
4 Hospital Santa Cruz,
Sampaio AS Introduction
The assessment of nutritional status is an cator of health and well-being, both at the indi-vidual and population level1. It is important to
define situations of risk when planning health promotion actions, nutritional diagnosis and prevention of diseases2.It is essential to perform a
systematic follow up of development and growth, since it monitors and favors health and nutrition conditions of children and adolescents3.
Currently excess weight in children and ad-olescents is a relevant and frequent situation worldwide4,5. Diagnosis of excess weight requires
the identification of levels of risk that often make it necessary to use appropriate techniques6.
There are different techniques and instru-ments to assess the nutritional status of chil-dren and adolescents, which makes it difficult to choose the criterion and interpret the results used by health care professionals7. In order to be
clinically important, the nutritional assessment methods must be accurate, precise, specific re-garding the nutritional status and sensitive to their changes, besides being easy to apply and reproduce8. Anthropometry has been considered
the most appropriate parameter to assess collec-tive nutritional status9, especially in childhood
and adolescence, because it is easy to perform, with a low cost and innocuous10.
When selecting the nutritional assessment technique, one must choose the one that meets the objective, considering the cost of its use, level of personal skill required to apply it appropriate-ly, and also time needed to implement it, how it is received by the population studied and possible health risks11,12.
Several countries use international recom-mendations and parameters to assess the nutri-tional status of children and adolescents. How-ever, there are questions about these recommen-dations and parameters, particularly concerning their validity, since many of them do not use samples representing several countries, and may express a local reality, and their use is generalized to the population at large. Thus, this review sys-tematically seeks evidence on the forms of nu-tritional assessment and the parameters used to determine the nutritional status of children and adolescents, summarizing the instruments avail-able for this purpose.
Methods
The systematic review followed MOOSE guide-lines13 and is registered in the PROSPERO
data-base.
Search strategy and selection criteria
We searched the following databases: Med-line, Embase, Lilacs, from inception to April 2014. We have also searched the grey literature, discussed the subject with leading experts in the field, and searched reference lists of other recent systematic reviews.No filters were selected for electronic searches. The search was performed using the following combination of terms:An-thropometryOR “Body composition” AND “ Nu-trition Assessment”.
Eligibility criteria
All original articles that covered a develop-ment or validation of nutritional assessdevelop-ment technique and/or parameters used to determine the nutritional status of healthy children and ad-olescents aged 0 to 19 years were included in this review. We exclude the following types of article: Letters to the editor, case reports and comments; studies involving special groups such as children and adolescents with pathologies or in hospital; systematic review articles and studies without a complete text.
Data extraction
From each of the selected studies, the fol-lowing variable data was extracted: first author’s name, age, assessment method, outcome, meth-od validation, validation of the methmeth-od, results obtained and observations.
Selection of articles
4211
C
iência & S
aúd
e C
ole
tiv
a,
23(12):4209-4219,
2018
Analysis of risk of bias
The quality criteria used to evaluate the stud-ies selected are shown were elaborated using two references mentioned in the Guidelines for Systematic reviews of health promotion and
pub-lic health interventions: Critical Appraisal Skills
Programme (2013) and McInnes and Chambers
(2008)14,15. With the combination of these two
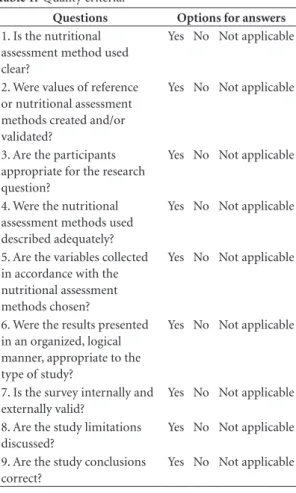
methods we elaborate our assessment tool the quality of the selected studies. With this we will evaluate the following items in each article: 1) Is the nutritional assessment method used clear? 2) Were values of reference or nutritional as-sessment methods created and/or validated? 3) Are the participants appropriate for the research question? 4) Were the nutritional assessment methods used described adequately? 5) Are the variables collected in accordance with the nutri-tional assessment methods chosen? 6) Were the results presented in an organized, logical manner, appropriate to the type of study? 7) Is the survey internally and externally valid? 8) Are the study limitations discussed? 9) Are the study conclu-sions correct? In each item two authors, inde-pendently, pointed out yes; No or not applicable (Table 1).
Results
Table 1 displays the flow diagram of our search strategy and study selection used on our system-atic review. Using this approach, we found 3.737 articles in three different databases and grey liter-ature. After excluding 5 duplicated studies, 3.732 studies were selected for further abstract reading. Among these, we excluded 3709 articles who did not meet our inclusion criteria.
Seventeen relevant articles were identified that supply data on different populations, Ven-ezuelans, Africans, and others. Seven studies dis-cussed the anthropometric indices as the main outcome, four analyzed the growth and develop-ment of children and adolescents using growth curves, and the remainder of the studies looked at body composition. The articles selected were published from 1974 to 2014, the age group of the participants ranged from birth to 19 years of age. Tables 2, 3, S1 and S2 summarized the arti-cles included in this review.
Concerning the evaluation of the method-ological quality of the articles, all of them gen-erally attained the quality criteria. Except for the
question on limitations, six of the 17 articles in-cluded did not discuss their limitations. Hence, none of the studies presented all the quality re-quirements. However, it is justified to include all of them, since they can help understand the nutritional assessment techniques for the popu-lation of children and youths.
Table 2 shows the studies performed on pre-dominantly American individuals, aged from birth to 19 years. The surveys were published between 1977 and 2007. Since this was recom-mended internationally, some of the surveys in-volving BMI for age were performed on children and adolescents. According to the data shown in Table 3 three studies using BMI for age were performed in Brazil. These surveys included children and adolescents aged two to 19 years, and newborns with a gestational age of 29 to 43 weeks. The studies presented different objectives and outcomes.
Table S1 presents five studies that used an-thropometric measures to determine the nutri-tional status in American and African individual Table 1. Quality criteria.
Questions Options for answers
1. Is the nutritional assessment method used clear?
Yes No Not applicable
2. Were values of reference or nutritional assessment methods created and/or validated?
Yes No Not applicable
3. Are the participants appropriate for the research question?
Yes No Not applicable
4. Were the nutritional assessment methods used described adequately?
Yes No Not applicable
5. Are the variables collected in accordance with the nutritional assessment methods chosen?
Yes No Not applicable
6. Were the results presented in an organized, logical manner, appropriate to the type of study?
Yes No Not applicable
7. Is the survey internally and externally valid?
Yes No Not applicable
8. Are the study limitations discussed?
Yes No Not applicable
9. Are the study conclusions correct?
Sampaio AS at ages between birth and 74 years. Table S2
pres-ents two studies that used BIA to determine body composition in English and Danish children and adolescents aged three to 18 years.
Discussion
Growth graphs are essential to assess the health of children and adolescents, but following the growth trajectory and, consequently, the decision to intervene, depend greatly of the growth tables used16. In the last 50 years, many authors from
several countries produced different frames of reference to assess the nutritional status17.
In 1977, the National Center for Health Sta-tistics (NCHS) and the United States Center for Disease Control (CDC), developed growth curves by grouping the longitudinal data on chil-dren (0-23 months) and cross-sectional data col-lected respectively by the Ohio Fels Research In-stitute and by the National Health and Nutrition Examination Surveys (NHANES)18.
A few inconsistencies observed in the NCHS/ WHO growth reference, especially regarding breastfeeding, led the people who studied it to conclude that new references would be needed19.
In 2000, the Center for Diseases Control (CDC) launched a new set of tables and growth graphs. These curves were elaborated using the data from the previous curves of the NCHS in 1977, with a few modifications in the sample of children20.
In 2006, the World Health Organization (WHO) established a new international standard by elaborating a set of curves to assess the growth and nutritional status of children up to the age of five years21. The position of WHO is that all
economically disadvantaged children who were breastfed when babies, grow similarly, and conse-quently, a single set of growth graphs can be used to evaluate the growth of any child, independent of race or ethnicity22.
The 2006 frame of reference was produced based on a sample from six countries. Curves were developed with Z-score and percen-tiles: Weight for age, Weight for length (up to two years), Weight for stature (two to 5 years), Length/Stature for age and BMI for age21. At the
WHO site, the tables and graphs (http://www. who.int/childgrowth/standards/en/) are available for free access.
The WHO 2006 frame of reference presents advantages over the previously recommended CDC/NCHS (2000), since it provides references for more anthropometric parameters, besides
Tab le 2. A nthr op ome tr ic assessme nt: G ro w th cur ves. A u tho r, y ear A ssesme nt me as ur e P opulat io n Ag e Sample S iz e Sex Ye ar Indicat or ns/I ndic es S Sp ec NCHS, 1977 17 A nthr op ome tr y A me rican B ir
th – 18 y
ear
s
M,F
1929 - 75 1960 - 75
C ur ves; W A; WH; HA; CCA No No CD C, 2000 19 A nthr op ome tr y A me rican B ir
th – 20 y
ear
s
M,F
1963 – 65 1966 – 70 1971 – 74 1976 – 80 1988 - 94
C ur ves; BMIA; CCA; L A; W S; WA No No WHO , 2006 20 A nthr op ome tr y USA; Ghana; India; N or wa y; Oman; B razil. L ong it udinal: b ir th
- 24 mo
nths. C ross-se ct io nal:
18 - 71
mo
nths
8,440
M,F
1997 - 2003
C ur ves; W A; WH; W S; BMIA No No WHO , 2007 21 A nthr op ome tr y A me rican
5 – 19 y
ear s 22, 917 M,F N ew anal ysis o f
the NCHS data for 1977
C
ur
ves (5-10 y
ear s): W A, L A, BMIA. C ur
ves (10-19 y
ear s): L A, BMIA. No No Le ge nd: NCHS (N at io nal C ent er f or H ealth Stat ist ics). WHO ( W or ld H ealth Org anizat io n). M (M ale). F (F emale). S (S ensit iv it y).Sp ec (Sp ecificit y). W A ( W eig ht f or ag e). WH ( W eig ht f or he ig ht). W S ( W eig ht f or stat ur e), L A (L ength/Stat ur e f or ag e).
BMIA (BMI f
4213
Ciência & S aúde C
oleti va, 23(12):4209-4219, 2018
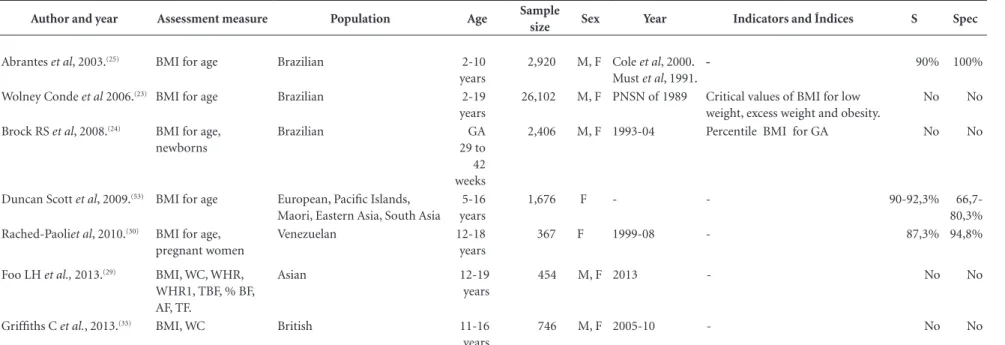
Table 3. Anthropometric indices
Author and year Assessment measure Population Age Sample
size Sex Year Indicators and Índices S Spec
Abrantes et al, 2003.(25) BMI for age Brazilian 2-10
years
2,920 M, F Cole et al, 2000. Must et al, 1991.
- 90% 100%
Wolney Conde et al 2006.(23) BMI for age Brazilian 2-19
years
26,102 M, F PNSN of 1989 Critical values of BMI for low
weight, excess weight and obesity.
No No
Brock RS et al, 2008.(24) BMI for age,
newborns
Brazilian GA
29 to 42 weeks
2,406 M, F 1993-04 Percentile BMI for GA No No
Duncan Scott et al, 2009.(53) BMI for age European, Pacific Islands,
Maori, Eastern Asia, South Asia 5-16 years
1,676 F - - 90-92,3% 66,7-
80,3%
Rached-Paoliet al, 2010.(30) BMI for age,
pregnant women
Venezuelan 12-18
years
367 F 1999-08 - 87,3% 94,8%
Foo LH et al., 2013.(29) BMI, WC, WHR,
WHR1, TBF, % BF, AF, TF.
Asian 12-19
years
454 M, F 2013 - No No
Griffiths C et al., 2013.(33) BMI, WC British 11-16
years
746 M, F 2005-10 - No No
Legend BMI (Body Mass Index) BMIA (Body Mass Índex for Age). GA (Gestational Age). DEXA (Double Energy X-Ray Absorptiometry). WC (Waist Circumference). WHR (Waste Height Ratio). WHR 1 (Waist Height
Sampaio AS having a frame of reference for body mass index
for children below the age of two years, which does not exist in CDC/NCHS 2000. Consequent-ly, the WHO frame of reference for 2006 began to be adopted in the health care services, and the need arose to provide an adequate complementa-ry reference continuing that of 2006, for children over the age of five years17.
Thus, in 2007, the growth curves were launched by the World Health Organization and a new analysis of the data from the National Cen-ter for Health Statistics (NCHS) of 1977 was per-formed. The 1977 data were merged with the data used in the WHO curves of 2006, for children under the age of five years23. This set of data
cov-ers the Weight for age and sex curves (from five to 9 years of age); Stature for age and sex (from five to 19 years); and BMI for age and sex (from five to 19 years). The tables and graphs supplied on internet allow the use of the reference in practice (http://www.who.int/growthref/en/).
All the articles included in this review of growth curves created values of reference for the child and adolescent population of different nationalities. According to the data presented in table 2, it can be perceived that the recommenda-tions and growth curves were constantly modi-fied and analyzed again for a better identification of the nutritional status. Both the WHO curves of 2006 and 2007 that were launched for the chil-dren over five years of age, are indicated and used internationally for the nutritional diagnosis of children and adolescents.
The word index refers to the combination between two anthropometric measures. The anthropometric indices enable a more complex and detailed assessment of the nutritional status. The body mass index (BMI) for age is most used, and it is internationally recommended in the in-dividual and collective diagnosis of nutritional disorders. This index expresses the relationship between weight and the square of stature, and it is used mainly to identify excess weight17.
Conde and Monteiro, recommend using a new BMI graph for children and adolescents in clinical and epidemiological assessments. The classifica-tion system generated in this survey was method-ologically similar to most of the national curves and also presents the definition of low weight24.
Similarly, Brock et al., presented percentile curves of BMI for newborns of different gestational ages. The results demonstrated a direct correlation be-tween BMI and gestational age in all percentiles analyzed, and these findings can provide a useful tool to determine normal intrauterine growth25.
On the other hand, Abrantes et al. considered the weight index for height as the gold-standard in relation to the BMI cutoff points for over-weight and obesity proposed by Cole et al. and Must et al. The sensitivity and specificity found were high. Although the values proposed by both are similar, the researchers suggest using the values of Cole et al. and emphasize that the val-ues proposed by both must be carefully used to screen for obesity in childhood, but can be used to diagnose children with excess weight26.
Other similar studies were conducted with children and adolescents of different national-ities aged from five to 19 years of different na-tionalities.
Duncan et al.27 suggest that BMI may be an
ac-ceptable substitute measure to predict the excess of fat in girls of different ethnicities. Similarly, in a recent study, the researchers determined the usefulness of several anthropometric measures to establish regional and total body fat, using Double Energy Xray Absorptiometry (DEXA) as a gold standard. The results confirmed that an anthropometric index like BMI can be an substi-tute indicator to estimate body fat in Malay and Chinese adolescents28.
Paoli et al. analyzed the capacity of four ref-erence values based on BMI to categorize the nutritional status of pregnant adolescents. The researchers suggest the use of the Frisancho ref-erence to diagnose the nutritional status in the first trimester of pregnancy in adolescents and populations with similar characteristics29,30.
According to the studies presented, the re-searchers indicate that BMI may be a substitute measure to predict excess fat, since it is highly sensitive and has great specificity compared to the weight-for-height index, and it is recom-mended to use a new BMI graph for children and adolescents in clinical and epidemiological assessments. As to the newborns, the BMI has a direct correlation with gestational age and new percentile curves are presented for pregnant women, and the use of the reference of Frisancho (1993) is recommended.
Although BMI can be sensitive and specific to predict body fat, a great number of children and adolescents classified as overweight or obese do not have high body fat, since BMI does not distinguish body fat from lean mass, making it difficult to differentiate overweight with excess fat from overweight with muscle hypertrophy31.
in-4215
C
iência & S
aúd
e C
ole
tiv
a,
23(12):4209-4219,
2018
dex, waist circumference and waist-stature ratio. It was found that central adiposity measured by waist circumference is increasing together with the stabilization of BMI, ie., additional adiposi-ty is being stored centrally, and not detected by BMI32.
In addition, although BMI does not represent the body composition of individuals, its use in epidemiological studies and in clinical practice is justified because it is easy to obtain data on weight and stature, as long as the cutoff points used are age specific, especially if associated with other anthropometric measures that express the composition and distribution of body fat33.
In Table 3, Brazilian newborns, children and adolescents were included in three surveys in which the researchers recommend the use of a new BMI graph in clinical and epidemiological assessments. They suggest that BMI is highly sen-sitive and specific compared to the weight-for-height index and present percentile curves for BMI for newborns at different gestational ages. Even if this index has limitations, it is currently the favorite to determine excess weight in chil-dren and adolescents, besides not being invasive and being universally applicable to assess the nu-tritional status.
Currently the study of body composition is improving due to the various applicability and also because it has been understood that use of body measures alone does not allow a detailed assessment of the growth and nutritional status of children and adolescents34. There are several
techniques to assess proportions, size and body composition, among them anthropometry, which includes besides measurements of weight and height, skin folds and circumferences. The best interpretation will depend of valid reference values for age range of the study population.
Frisancho (1974) supplied percentiles by sex and age of the triceps skin fold and circumfer-ence, muscle area and diameter of the arm for Americans aged 0 to 44 years. According to the researcher, the applicability of data derived from this survey depends on the population that is to be studied, since there are variations in the amount of subcutaneous fat and also in the fat deposition pattern that must be taken into ac-count when assessing the nutritional status35.
The sample included in 1974 weighted for the low income groups and did not constitute a sample of the national population. Besides, the study did not supply information for individuals over the age of 44 years; for this reason, it had limited applicability to the elderly. Thus,
Frisan-cho (1981) derived new standards from the set of data of the Epidemiological and Nutrition Ex-amination Study I (HANES I) from the United States36. Later, other percentile tables proposed
by Frisancho (1990) were launched, and are cur-rently used.
According to the surveys described, comple-mentary measures to assess the nutritional status of children and adolescents can be performed using assessments of the arm circumference, which represents the sum of the areas formed by the tissues. The muscle circumference of the arm is considered a good indicator of the reserve of muscle tissue, and skin fold which is a measure of adiposity that allows evaluating body compo-sition35,37.
The folds are correlated differently with to-tal body fat and percentage of body fat accord-ing to where they are measured38. The most used
for this purpose, in children and adolescents, are the triceps e subscapular skinfolds17. The triceps
skinfold is more valid and presents a better cor-relation with the percentage of body fat, and is a good indicator of energy reserve38.
The precision of the data derived from the skinfolds can be highly variable and depends on the operator. Therefore, it requires long training to obtain precise and accurate results. A major limitation of the use of the skinfold method is the difficulty of standardizing the assessors regarding the anatomical points and procedures adopted to perform the assessment39.
Besides the triceps and subscapular skin folds, arm circumference may be useful to deter-mine body composition more precisely. The arm circumference is used worldwide, and was pro-posed as an alternative to assess nutritional status in places where it is not easy to collect weight and stature19.
Ball et al. (1993) determined the sensitivity and specificity of the arm circumference/cephal-ic perimeter ratio in a group of Afrcircumference/cephal-ican children. The arm circumference was more sensitive for screening protein-energy malnutrition than the arm circumference/cephalic perimeter ratio. Thus, the addition of measurements of the ce-phalic perimeter is not justified by the findings of this survey40.
Sampaio AS that there is no need to use the Z score arm
cir-cumference to identify children at high risk of mortality, since the arm circumference is easier to use in the field41.
Therefore, arm circumference can be used as a complement to other anthropometric measures, or alone, when it is not easy to obtain weight and stature. It is a sensitive method to screen for pro-tein-energy malnutrition, and has a prognostic capacity of predicting mortality over the short term. As to the studies included (table S1), it can be noted that there is an evolution in the recom-mendation and use of anthropometric measures.
Currently there are many techniques to eval-uate body composition that are based on dif-ferent principles and body models which allow characterizing the body composition in a specific form, distinguishing the different body compart-ments, or in a comprehensive, non-differentiated form42,43. The doubly indirect techniques are less
rigorous, but present a better practical application and lower financial cost, and can be used both in field surveys and in clinical studies. Outstanding among them is electrical bioimpedance (BIA)42.
BIA is a quick method, portable, painless and relatively precise, which consists of passing a high frequency and low amplitude electrical current44.
Measurement is based on the fact that the free mass of fat contains electrolytes and acts as a con-ductor, while body fat is relative free of ions and acts as an insulator45. The apparatuses available
for this assessment supply fat mass, lean mass and body water values, using equations adjusted for sex, age, weight, height and level of physical activity. However, the predictive equations vary according to the apparatus and are valid only for the population of that origin, requiring cross-val-idation in other population groups46.Besides
that, BIA measurement has some limitations, such as fasting for several hours before the exam, supposedly to have more accurate measurement; this time restriction limits the use of BIA in large scale studies and even in clinical settings.
Although it is technically easy and highly re-producible, the standardization of the conditions to measure electrical bioimpedance is essential to obtain exact, precise and reproducible data. Several individual and environmental factors can influence the analysis of BIA, such as alcohol in-gestion, intense physical activity performed be-fore the test, situations with abnormal hydration of the tissues, as in edemas, ascitis or altered ionic balance47,48.
A study published in 2006 showed percentile curves for body fat measured by the BIA. The
participants were 1985 children aged from five to 18 years. According to the researchers, the curves developed reflect the known differences in ad-iposity between boys and girls. This set of data was published by the Child Growth Foundation for clinical monitoring of body fat, together with the software to convert individual measures into Z-scores49.
A recent survey of 99 Danish children de-veloped prediction equations to estimate the fat free mass. BIA and Double Energy X-ray Ab-sorptiometry (DEXA) were used to assess body composition. According to the researchers, the equations developed are particularly relevant for use among healthy Caucasian children aged 2 to 4 years, and can be useful for population studies that connect early risk factors to body composi-tion and the early onset of obesity50.
BIA can be used to assess body composition of children and adolescents, substituting the skin folds, because this method eliminates inter and intra examiner errors, and does not require trained technicians to be implemented. However, when BIA is used to assess body composition, it is essential to avoid conditions that might create biases as much as possible51.
Both BIA and anthropometric measures are considered simple, accurate procedures to deter-mine the nutritional status of children and ado-lescents. Attention must be paid to the conditions that may determine biases in measurement in or-der not to compromise data reproducibility.
Conclusion
The literature review suggests several techniques and parameters that can be applied to determine the nutritional status of children and adolescents from different countries.
Growth graphs are essential to assess the health of children and adolescents, but, the de-cision to intervene, depend greatly of the growth tables used.
Although BMI can be practical to predict body fat, but it does not distinguish body fat from lean mass. There are several techniques to assess proportions, size and body composition, among them anthropometry. The best interpre-tation will depend of valid reference values for age range of the study population.
4217
C
iência & S
aúd
e C
ole
tiv
a,
23(12):4209-4219,
2018
fasting for several hours before the exam, sup-posedly to have more accurate measurement; this time restriction limits the use of BIA in large scale studies and even in clinical settings.
Although a few of the parameters are interna-tionally recommended, there is a need for further studies to validate and create reference values that cover children and adolescents of various nationalities.
Collaborations
R Mattiello and AS Sampaio: introduction, me-thodology, discussion and final writing. M Epifa-nio, CAD Costa, VL Bosa, FJ Benedetti, EE Sarria, SG Oliveira: methodology and final writing. E Mundstock: discussion, final writing and format-ting text, tables and figures.
Acknowledgments
Sampaio AS References
1. Zemel B, Riley E, Stallings V. Evaluation of method-ology for nutritional assessment in children: Anthro-pometry, Body Composition, and Energy Expenditure.
Annu Rev Nutr 1997; 17:211-235.
2. Sociedade Brasileira de Pediatria. Avaliação nutricional
da criança e do adolescente – Manual de Orientação. São
Paulo: Sociedade Brasileira de Pediatria Departamento de Nutrologia; 2009.
3. Batista-Filho M, Rissin A. Vigilância alimentar e nutri-cional: antecedentes, objetivos e modalidades. A VAN no Brasil. Cad Saude Publica 1993; 9(Supl. 1):99-105. 4. Thibault R, Genton L, Pichard C. Body composition:
why, when and for who? ClinNutr 31:435-447. 5. Lobstein T, Baur L, Uauy R. Obesity in children and
young people: a crisis in public health. Obesityreviews. 2004; 5:4-85.
6. Godoy-Matos A, Oliveira J, Guedes E, Carraro L, Lopes A, Mancini M. Associação Brasileira para o Estudo da Obesidade e da Síndrome Metabólica, Diretrizes brasi-leiras de obesidade 2009/2010/ABESO. São Paulo: AC Farmacêutica; 2009.
7. Vitolo MR. Nutrição da gestação à adolescência: Rei-chmann & Affonso; 2003.
8. Manning E, Shenkin A. Nutritional assessment in the critically ill. Crit Care Clin 1995; 11(3):603-634. 9. Gomes FS, Anjos LA, Vasconcellos MTL.
Antropome-tria como ferramenta de avaliação do estado nutricio-nal coletivo de adolescentes; Anthropometry as a tool for assessingthenutritional status ofadolescents. Rev Nutr 2010; 23:591-605.
10. Anselmo M, Burini R. Antropometria: aspectos históri-cos e visão crítica. Cad Nutr 1991; 3:11-25.
11. World Health Organization. Physical status: The use of and interpretation of anthropometry, Report of a WHO Expert Committee. 1995.
12. Sigulem DM, Devincenzi MU, Lessa AC. Diagnóstico do estado nutricional da criança e do adolescente. J Pe-diatr (Rio J) 2000; 76:s275-s84.
13. Stroup DF, Berlin JA, Morton SC, Olkin I, Williamson GD, Rennie D, Moher D, Becker BJ, Sipe TA, Thacker SB. Meta-analysis of observational studies in epidemi-ology: a proposal for reporting. Meta-analysis Of Ob-servational Studies in Epidemiology (MOOSE) group.
JAMA 2000; 283(15):2008-2012.
14. Armstrong R, Waters E, Jackson N. Systematic reviews
of health promotion and public health interventions.
Melbourne: University of Melbourne; 2007.
15. McInnes RJ, Chambers JA. Supporting breastfeed-ing mothers: qualitative synthesis. J Adv Nurs 2008; 62(4):407-427.
16. Turck D, Michaelsen KF, Shamir R, Braegger C, Cam-poy C, Colomb V, Decsi T, Domellöf M, Fewtrell M, Kolacek S, Mihatsch W, Moreno LA, van Goudoever J.
World health organization 2006 child growth standards and 2007 growth reference charts: a discussion paper by the committee on nutrition of the European society for pediatric gastroenterology, hepatology, and nutri-tion. J Pediatr Gastroenterol Nutr 2013; 57(2):258-264. 17. Sociedade Brasileira de Pediatria (SBP). Avaliação
Nu-tricional da Criança e do Adolescente: Manual de Orien-tação. Rio de Janeiro: SBP; 2009.
18. Hamill PV, Drizd T, Johnson C, Reed R, Roche A.
NCHS growth curves for children: Birth-18 years, United
States. Washington: US Department of Health,
Educa-tion, and Welfare, Public Health Service, National Cen-ter for Health Statistics; 1977.
19. World Health Organization (WHO). Physical status:
The use of and interpretation of anthropometry. Geneva:
Report of a WHO Expert Committee; 1995.
20. Kuczmarski RJ, Ogden CL, Guo SS, Grummer-Strawn LM, Flegal KM, Mei Z, Wei R, Curtin LR, Roche AF, Johnson CL. 2000 CDC Growth Charts for the United States: methods and development. Vital Health Stat 11
2002; (246):1-190.
21. Group WMGRS. WHO Child Growth Standards based on length/height, weight and age. Acta Paediatrica
2006; 450(Supl.):76.
22. Natale V, Rajagopalan A. Worldwide variation in hu-man growth and the World Health Organization growth standards: a systematic review. BMJ open 2014; 4:e003735.
23. OnisMd, Onyango AW, Borghi E, Siyam A, Nishida C, Siekmann J. Development of a WHO growth reference for school-aged children and adolescents. Bulletin of
the World Health Organization 2007; 85(9):660-667.
24. Conde WL, Monteiro CA. Body mass index cutoff points for evaluation of nutritional status in Brazil-ian children and adolescents. J Pediatr (Rio J) 2006; 82(4):266-272.
25. Brock R, Falcao MC, Leone C. Body mass index values for newborns according to gestational age. Nutr Hosp
2008; 23(5):487-492.
26. Abrantes MM, Lamounier JA, Colosimo EA. Compar-ison of body mass index values proposed by Cole et al.(2000) and Must et al.(1991) for identifying obese children with weight-for-height index recommended by the World Health Organization. Public Health Nutr
2003; 6(3):307-311.
27. Duncan J, Duncan EK, Schofield G. Accuracy of body mass index (BMI) thresholds for predicting excess body fat in girls from five ethnicities. Asia Pac J Clin Nutr 2009; 18(3):404-411.
28. Foo LH, Teo PS, Abdullah NF, Aziz ME, Hills AP. Re-lationship between anthropometric and dual energy X-ray absorptiometry measures to assess total and regional adiposity in Malaysian adolescents. Asia Pac J
Clin Nutr 2013; 22(3):348-356.
29. Rached-Paoli I, Henriquez-Pérez G. Efectividad del índice de masa corporal en el diagnóstico nutricional de las gestantes adolescentes. Arch Latinoam Nutr 2010; 60(2):141-147.
30. Rolland-Cachera M. Body composition during adoles-cence: methods, limitations and determinants. Horm Res 1993; 39(Supl. 3):25-40.
31. Rodríguez G, Moreno L, Blay M, Garagorri JM, Sarría A, Bueno M. Body composition in adolescents: mea-surements and metabolic aspects. Int J Obes Relat
4219
C
iência & S
aúd
e C
ole
tiv
a,
23(12):4209-4219,
2018
This is an Open Access article distributed under the terms of the Creative Commons Attribution License
BY CC
32. Griffiths C, Gately P, Marchant P, Cooke C. A five year longitudinal study investigating the prevalence of childhood obesity: comparison of BMI and waist cir-cumference. Public Health 2013; 127(12):1090-1096. 33. Cervi A, Franceschini SdCC, Priore SE. Análise crítica
do uso do índice de massa corporal para idosos. Rev Nutr 2005; 18(6):765-775.
34. Telles RK, Azevedo Barros Filho A. O uso antropomé-trico como método de avaliação da composição corpo-ral em pediatria. Rev Ciênc Méd 2012; 12(4):351-363. 35. Frisancho AR. Triceps skin fold and upper arm muscle
size norms for assessment of nutritional status. Am J
Clin Nutr 1974; 27(10):1052-1058.
36. Frisancho AR. New norms of upper limb fat and mus-cle areas for assessment of nutritional status. Am J Clin Nutr 1981; 34(11):2540-2545.
37. Bossemeyer R. Diagnóstico clínico e laboratorial. Re-prod Clin 2001; 16:11-13.
38. Zemel BS, Riley EM, Stallings VA. Evaluation of meth-odology for nutritional assessment in children: anthro-pometry, body composition, and energy expenditure.
Annu Rev Nutr 1997; 17:211-235.
39. Machado AF. Dobras cutâneas: localização e procedi-mentos. Motricidade 2008; 4(2):41-45.
40. Ball T, Pust R. Arm Circumference ν. Arm Circumfer-ence/Head Circumference Ratio in the Assessment of Malnutrition in Rural Malawian Children. J Trop Pedi-atr 1993; 39(5):298-302.
41. Rasmussen J, Andersen A, Fisker A, Ravn H, Sodemann M, Rodrigues A, Benn CS, Aaby P. Mid-upper-arm-cir-cumference and mid-upper-arm cirMid-upper-arm-cir-cumference z-score: the best predictor of mortality & quest. Eur J Clin Nutr
2012; 66(9):998-1003.
42. Pinto E, Oliveira AR, Alencastre H, Lopes C. Avaliação da composição corporal na criança por métodos não invasivos. Arquivos de Medicina 2005; 19(2):47-54. 43. Sant’Anna MSL, Priore SE, Sylvia do Carmo C.
Méto-dos de avaliação da composição corporal em crianças.
Rev Paul Pediatr 2009; 27(3):315-321.
44. Cômodo ARO, Dias ACF, Tomaz BA, Silva-Filho A, Werustsky C, Ribas D, Spolidoro J, Marchini J. Utili-zação da Bioimpedância para Avaliação da Massa
Cor-pórea. Rio de Janeiro: Associação Médica Brasileira,
Conselho Federal de Medicina; 2009.
45. Borowitz D, Conboy K. Are bioelectric impedance measurements valid in patients with cystic fibrosis? J
Pediatr Gastroenterol Nutr 1994; 18(4):453-456.
46. Rezende F, Rosado L, Franceschinni S, Rosado G, Ri-beiro R, Bouzas Marins JC. Revisão crítica dos méto-dos disponíveis para avaliar a composição corporal em grandes estudos populacionais e clínicos. Arch
Latino-am Nutr 2007; 57(4):327-334.
47. Kushner RF, Gudivaka R, Schoeller DA. Clinical char-acteristics influencing bioelectrical impedance anal-ysis measurements. Am J Clin Nutr 1996; 64(Supl. 3):423S-27S.
48. Kyle UG, Bosaeus I, De Lorenzo AD, Deurenberg P, Elia M, Manuel Gómez J, Lilienthal Heitmann B, Kent-Smith L, Melchior JC, Pirlich M, Scharfetter H, MWJ Schols A, Pichard C; ESPEN. Bioelectrical impedance analysis – part II: utilization in clinical practice. Clin Nutr 2004; 23(6):1430-1453.
49. McCarthy H, Cole T, Fry T, Jebb S, Prentice A. Body fat reference curves for children. Int J Obes 2006; 30(4):598-602.
50. Ejlerskov KT, Jensen SM, Christensen LB, Ritz C, Mi-chaelsen KF, Mølgaard C. Prediction of fat-free body mass from bioelectrical impedance and anthropometry among 3-year-old children using DXA. Sci Rep 2014; 4:3889.
51. Cocetti M, Castilho SD, Barros Filho AA. Dobras-cutâneas e bioimpedância elétrica perna-perna na avaliação da composição corporal de crianças. Rev nutr
2009; 22(4):527-536.
Artigo apresentado em 02/07/2016 Aprovado em 03/02/2017