Rev Bras
Cineantropom
Hum
DOI: http://dx.doi.org/10.5007/1980-0037.2017v19n2p204
original article
1 State University of Campinas. Faculty of Physical Education. Cam-pinas, SP. Brazil.
2 Federal University of Pará, Faculty of Physical Education. Castanhal, PA. Brazil.
3 University of Parana. Umuarama, PR. Brazil.
4 State University of Maringá. Facul-ty of Physical Education. Maringá, PR. Brazil.
Received: 21 February 2017
Accepted: 06 April 2017
Body composition and motor performance in
wheelchair handball
Composição corporal e desempenho motor no handebol
em cadeira de rodas
Mariane Borges1
Anselmo de Athayde Costa e Silva2
Fernando Rosch de Faria1
Priscila Samora Godoy1
Ellen Rodrigues Barbosa Melo3
Décio Roberto Calegari4
José Irineu Gorla1
Abstract – he aim of this study was to verify the relationship between body composi-tion and motor performance in Wheelchair Handball players (WH). Overall, 21 athletes composed the sample (13 males and 8 females). To analyze motor performance, the fol-lowing tests were used: ball driving, block performance, 20 m velocity and zigzag agility for individuals on wheelchair. Body mass, height, body perimeter and skinfold thickness (tricipital, subescapular, bicipital and supra-iliac) were used to establish body composition proile. Data was presented through descriptive statistics and inference was performed by Spearmans’ and Kruskal-Wallis correlation coeicient (non-parametric). herefore, strong and signiicant correlations between body composition and motor performance were detected within diferent functional class and also according to sex, whereas male athletes showed signiicant correlation between body fat percentage and agility (r=0.70, p≤0.01) and, in the case of female athletes, body fat percentage is strongly related with speed (r=0.81, p≤0.01) and agility (r=0.74, p≤0.05). As conclusion, it was veriied that apparently, increased body fat in body composition proile negatively inluences motor performance in wheelchair handball players
Key words: Anthropometry; Body composition; Disabled people.
Wheelchair Handball (WH) is an adapted collective sport practiced in two distinct modalities: HCR7, which is an adaptation of court handball and is played with seven players per team and HCR4, which is an adapta-tion of sand handball, played with four players on the court. Developed with competitive character since 20051, the sport has grown signiicantly.
Given the current panorama of the modality, strategies have been adopted with the aim of improving the aspects of training. One of these initiatives concerns the evaluation of motor performance. his is a tool that assists in the prior planning of subsequent works2, being a fundamental
part of the training planning, checking the progress of athletes and the training efectiveness regarding the mentioned aspects.
With regard to the technical parameters of the modality, physical abilities and motor skills can be monitored. According to Brasile and Hedrick3, motor skills must be considered in training programs, since
their acquisition along with previous experiences are factors that positively inluence the performance of athletes and teams. However, the evaluation of these motor abilities as well as the sports performance can be inluenced by several processes and factors intrinsic and extrinsic to the individual4.
Among the factors that interfere in the desired motor performance in non-disabled athletes is body composition. Riendeau et al.5 reported that
there is a positive correlation between high levels of fat-free mass and sports performance in activities of resistance, strength, power and speed, while increased adiposity has a negative impact on performance. his is in agreement with Cyrino et al.6, who reported that lower body fat values can
favor the maximum performance representing a lower energy consumption and favoring the process of recovery after efort.
However, although there is evidence of an important relationship between body composition and motor performance in conventional sports, in adapted sports practiced in wheelchairs, there is no evidence to identify this inlu-ence, which motivated conducting this study to verify the relation between body composition and motor performance of wheelchair handball athletes.
METHODOLOGICAL PROCEDURES
Participants
Body composition and motor performance Borges et al.
Anthropometry
Anthropometric variables body mass and height were measured using a Filizola® scale (São Paulo, Brazil) with reading scale in grams and a sta-diometer with reading scale in millimeters. However, the body mass of individuals with amputation was determined using the equation proposed by Lee and Nieman7, thus obtaining the corrected body mass. In cases in
which the individual was unable to place himself in the orthostatic position, the supine height was evaluated.
Similarly, in cases where participants were unable to maintain or-thostatic position during body mass measurement, a bench was used on the scale for athletes to sit. In this way, total mass (bank + athlete) was measured; after this measurement, the subject returned to the wheelchair and the bench weight was deducted from the total value, resulting in the body mass value. Body Mass Index (BMI) was obtained by dividing the mass (Kg) by squared height (m2).
To measure skinfold thickness, the Harpenden® adipometer (St Al-bans, UK) was used to measure triceps, subscapular, bicipital and supra-iliac skinfolds according to the Guedes and Guedes protocol8.
To estimate body density, speciic equations were used by sex and age group through the Durnin and Womersley protocol9, which uses triceps,
biciptal, subscapular and suprailiac skinfolds. In order to measure body fat percentage (% body fat), the Siri10 equation was used: % Body fat = (4.95
/ Density - 4.50) * 100.
he Durnin and Womersley equation was used in the absence of spe-ciic validated protocols for this population and for prioritizing the upper limbs. It should be noted that the Bulbullian equation11 was validated to
evaluate fat percentage of athletes with SCI; however, due to the sample heterogeneity, we chose not to use it.
Abdominal circumference was measured with anthropometric tape with reading scale in millimeters. his measure was selected because it is one of the main predictors of body composition and cardiovascular risk for individuals with and without disabilities12.
Motor Tests
Motor performance was evaluated through some of the tests proposed and validated by Costa e Silva et al.1 to evaluate the motor skills of WH.
he tests used were: ball driving; blocking performance; and 20m speed. In the ball driving test, the athlete must drive the ball as fast as possible in accordance with WH rules within the course marked by six cones at a distance of 3 meters between cones. he athlete should be positioned before the start line of the test and, at the evaluator’s signal, he / she should dribble in zigzag bypassing the cones as quickly as possible. Two valid attempts were performed and the best result computed for analysis.
in the second, then goes to the fourth, then returns to the third, and after passing through the fourth cone, completes the course. In all, a 27-meter displacement is performed during the test due to changes in direction. he count for each attempt is the total time to complete the course. Two attempts are considered and the best result is computed for analysis.
he speed test consists of the athlete walking a distance of 20m, being positioned behind the starting line, demarcated by tape and at the signal of the evaluator, the athlete should move to the end line as quickly as possible. he test result is the time taken to complete the course. hese are two attempts and the best will be computed for analysis.
In addition to these tests, the zigzag agility test was used for wheel-chair users, validated by Gorgatti and Bohme13, which aims to determine
the subject’s agility traveling a certain distance that requires changes of direction. his test has a course of 9m long by 6m wide. At the signal, the individual being evaluated starts the test behind the starting line and pushes the chair through the course as fast as possible, the test result is the time taken to travel the circuit, with accuracy of tenths of seconds. hree attempts will be made and the best result will be scored.
It is noteworthy that athletes used sports wheelchairs (Alphamix®, Apa-recida de Goiana, Brazil), speciic to the practice of the modality and tailored.
Statistical analysis
Data were presented through descriptive statistics, mean and standard deviation. Normality analysis was performed using the Shapiro-Wilk test. he Spearman correlation coeicient (rho, non-parametric) was used to analyze the relationship between anthropometric variables and motor performance. Comparisons between sexes were performed through Student’s T (parametric) and Mann Whitney (non-parametric) tests. For the comparison of functional groups (low, intermediate and high), the non-parametric Kruskal-Wallis test for independent samples was used and multiple comparison was performed using the Dunn test. Data were analyzed using the R-Plus statistical package version 2.15.0®, 2012, for MSWindows® (Vienna, Austria), and the R-Studio® package (Boston, USA). he signiicance level adopted was p≤0.05.
RESULTS
he sample characteristics are presented in Table 1.
Body composition and motor performance Borges et al.
Table 1. Sample characterization
Subject Sex Td Age (years) TP (months) FC
Mass (kg)
Height (cm)
BMI (Kg/m²) 1 Male Polyo 36 36 4.0 49 162 15 2 Male Polyo 35 102 2.0 63 155 20 3 Male Polyo 44 48 2.0 62 168 18 4 Male Polyo 47 36 1.5 80 166 24 5 Male Polyo 51 60 1.5 62 165 19 6 Male Polyo 38 36 1.5 70 162 22 7 Male Amp 40 84 3.5 88 178 28 8 Male Amp 23 36 3.5 82 185 24 9 Male Amp 23 72 3.0 73 174 26 10 Male SCI 21 24 1.5 66 172 19 11 Male SCI 19 84 1.5 72 180 20 12 Male SCI 34 54 1.5 75 165 23 13 Male HD 36 36 4.0 90 169 27 14 Fem HD 34 36 4.0 66 169 20 15 Fem HD 17 24 4.0 48 145 17 16 Fem MD 25 36 1.0 50 150 17 17 Fem Polyo 34 72 3.5 85 159 27 18 Fem Polyo 54 42 2.5 60 155 19 19 Fem Polyo 36 42 2.0 42 147 14 20 Fem Polyo 40 60 2.0 43 138 16 21 Fem CMF 35 60 4.0 34 133 13 Mean 34.6 51.4 64.2 161.7 19.7
±sd ±10.4 ±21.3 ±15.3 ±13.6 ±3.7 Male: male; Fem: female; TD: Type of disability; Age: Age; FC: Functional Classification; Mass: body mass; Height: height; BMI: body mass index; Polyo: Polyomelite; Amp: Amputation; SCI: Spinal Cord Injury; HD: Hip dislocation; MD: Muscular Dystrophy; CMF: Congenital malformation.
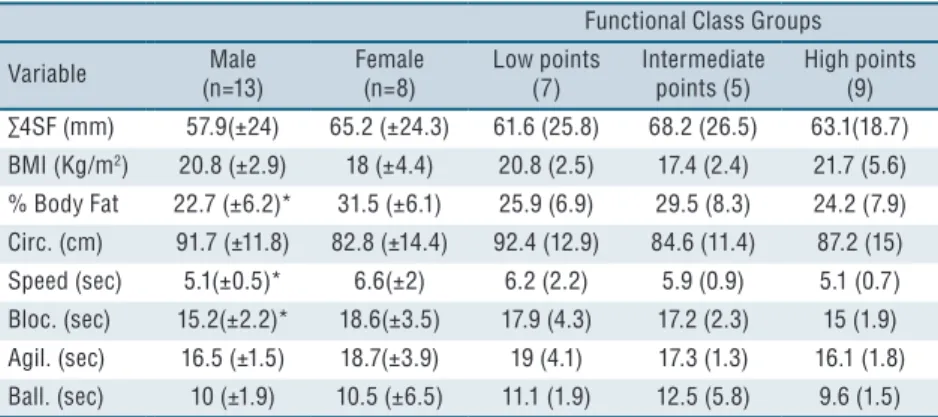
Regarding speed and blocking performance, males presented sig-niicantly better results than females (p≤0.05), and when considering the separation by functional class, no signiicant diferences were observed for these variables.
Table 2. Descriptive statistics of the study variables
Functional Class Groups Variable Male
(n=13)
Female (n=8)
Low points (7)
Intermediate points (5)
High points (9) ∑4SF (mm) 57.9(±24) 65.2 (±24.3) 61.6 (25.8) 68.2 (26.5) 63.1(18.7) BMI (Kg/m2) 20.8 (±2.9) 18 (±4.4) 20.8 (2.5) 17.4 (2.4) 21.7 (5.6)
% Body Fat 22.7 (±6.2)* 31.5 (±6.1) 25.9 (6.9) 29.5 (8.3) 24.2 (7.9) Circ. (cm) 91.7 (±11.8) 82.8 (±14.4) 92.4 (12.9) 84.6 (11.4) 87.2 (15) Speed (sec) 5.1(±0.5)* 6.6(±2) 6.2 (2.2) 5.9 (0.9) 5.1 (0.7) Bloc. (sec) 15.2(±2.2)* 18.6(±3.5) 17.9 (4.3) 17.2 (2.3) 15 (1.9) Agil. (sec) 16.5 (±1.5) 18.7(±3.9) 19 (4.1) 17.3 (1.3) 16.1 (1.8) Ball. (sec) 10 (±1.9) 10.5 (±6.5) 11.1 (1.9) 12.5 (5.8) 9.6 (1.5)
In females, body composition showed a higher correlation with motor performance, especially the strong correlations of % body Fat with physical capacity speed (r = 0.81, p = 0.05) and speed (r = 0.74, p = 0.03). In addi-tion to variables presented in the table above, relaaddi-tionships between body mass and BMI with motor performance were also veriied; however, no signiicant relationships were found between variables (Table 3).
Table 3. Correlation values between anthropometric variables and motor performance according
to sex.
Speed(sec) Bloc.(sec) Agil.(sec) Ball.(sec) Men (n=13)
∑4SF (mm)* 0.58 0.30 0.43 0.23 Circ. 0.34 0.48 0.65** 0.16
% Body Fat 0.32 0.51* 0.70** 0.13 Women (n=8)
∑4SF (mm)* 0.26 0.40 0.19* 0.54 Circ. 0.64 0.35 0.62 0.15 % Body fat 0.81** 0.59 0.74* 0.42
Σ4SF: Sum of skinfolds; BMI: Body Mass Index; % Body Fat: Body Fat Percentage. Circ: Abdominal Circumference; Speed: 20m Speed Test ; Bloc: Block Test; Agil: Modified Wheelchair Agility Test; Ball: Ball Driving Test. * Denotes statistical significance of p≤0.01.
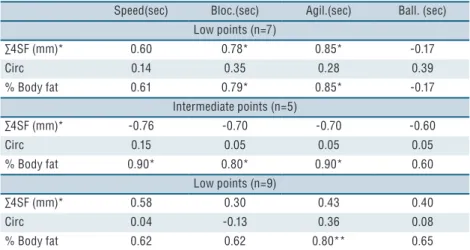
he same correlation analyses were performed according to functional classiication, where the inluence of body composition variables on motor performance can also be observed (Table 4). Athletes with lower func-tional classes and greater body fat accumulation presented worse motor performance results.
Table 4. Correlation values between anthropometric variables and motor performance according
to functional class group
Speed(sec) Bloc.(sec) Agil.(sec) Ball. (sec) Low points (n=7)
∑4SF (mm)* 0.60 0.78* 0.85* -0.17
Circ 0.14 0.35 0.28 0.39
% Body fat 0.61 0.79* 0.85* -0.17 Intermediate points (n=5)
∑4SF (mm)* -0.76 -0.70 -0.70 -0.60
Circ 0.15 0.05 0.05 0.05
% Body fat 0.90* 0.80* 0.90* 0.60 Low points (n=9)
∑4SF (mm)* 0.58 0.30 0.43 0.40 Circ 0.04 -0.13 0.36 0.08 % Body fat 0.62 0.62 0.80** 0.65
Body composition and motor performance Borges et al.
DISCUSSION
he aim of this investigation was to verify the relationship between body composition and motor performance in WH athletes. hus the study showed that: 1) the body composition of WH athletes is associated with mo-tor performance; 2) in men, body composition is strongly related to agility, indicating the tendency that the greater the abdominal circumference and % body fat, the lower the agility of athletes; 3) in women, body composition is strongly related to speed and agility, signaling that high % body fat is also detrimental to motor performance; 4) the negative inluence of body composition on motor performance can be observed in the three groups of functional classes, having as indicator the greater fat accumulation.
he results observed in this study corroborate results of Neto and Cesar14, who reported that excess body mass can cause damage to muscle
endurance and speed of movement, thus increased fat is unfavorable for sports performance in collective sports.
Among the motor variables analyzed, agility is deined by Sheppard and Young15 as “rapid body movements with changes of speed or direction
in response to a stimulus”. his author reported that agility is an important factor in court sports, since they usually include direction changes in re-sponse to a stimulus. For good performance of this skill, there are numer-ous interaction factors that must be observed, such as cognitive, physical and technical factors16, as well as the motor repertoire and training of the
individual. In addition, the results have shown that body composition can inluence the agility performance, showing that the higher the % body fat, the lower the performance of athletes in this test, demonstrated by the increase in the time spent for its performance.
Strong and signiicant relationship of % body fat with speed was ob-served in females, indicating that increased fat will increase the time of trav-el in speed, which corroborates the study by Riendau et al.5, who observed
a negative impact of increased body fat on sports performance (strength, power and speed). It is noteworthy that this physical capacity is important for the sport performance in WH, since the modality has as characteristics accelerations, changes of direction and sprints. For Vanlandewijck et al.17,
speed in adapted sports depends on the relationship established between user and the wheelchair, and a good relationship contributes to all motor skills performed in WH, and is conditioned not only to ergometric aspects. For this reason, athletes use their tailored sports wheelchairs in the test, minimizing errors in this user-wheelchair relationship.
termediate groups, which are mostly composed of individuals with SCI and Poliomyelitis, and tend to present increased motor impairment and increased body fat mainly in paralyzed limbs18-20.
Regarding body composition proile, it was observed that women pre-sented signiicantly higher body mass index than men, which is in agreement with Guedes and Guedes8. his diference in body composition justiies
the need to analyze data of this study separately (by sex), since women also presented “worse” results in motor performance tests, compared to men.
Regarding the anthropometric proile expressed by BMI, this may be considered adequate for male athletes with physical disability, since the mean BMI value of men (20.8 ± 2.9 kg / m2) in this study is not diferent
from results obtained in the study by Keil et al.21, in which the BMI of elite
athletes in wheelchair basketball was 21.0 (± 2.0 kg / m2). For the BMI
values of women, no comparative parameters were found. However, BMI is not considered a good predictor for body composition analysis22-25 because
it does not distinguish fat mass and lean mass, which may underestimate or overestimate an individual’s body fat.
Some aspects of this study deserve further comments. For example, the sample heterogeneity may have made comparisons between sexes and functional classes diicult, considering that the type of deiciency tends to inluence body composition, and the relatively small sample size, which are study limitations, and may have impacted the analysis of data. he use of prediction equations by the anthropometric method using skinfolds is another limitation, since these equations are developed and validated for populations without deiciency and include assumptions about body fat distribution, which are diferent in individuals with deiciency, implying a greater error in the measurement of these variables. However, it is worth highlighting the need for this type of evaluation in order to generate infor-mation about the progress of training in the short and long term in order to obtain the best performance of each athlete.
CONCLUSION
he present study showed that the body composition of WH athletes is related to motor performance according to both gender and functional classiication, and body fat accumulation may negatively inluence motor performance.
hus, the need to evaluate and monitor body composition is rein-forced in order to minimize the negative efects of this variable on sports performance.
REFERENCES
Body composition and motor performance Borges et al.
2. Yilla AB, Sherrill C. Validating the Beck Battery of Quad Rugby Skill Tests. Adapt Phys Act Q 1998;15(2):155–67.
3. Brasile F, Hedrick B. he Relationship of Skills of Elite Wheelchair Basketball Competitors to the International Functional Classiication System. her Recrea-tion J 1996; 30(2):114-127.
4. Kiss MAPDM, Böhme MTS, Mansoldo AC, Degaki E, Regazzini M. Desem-penho e talento esportivos. Rev Paul Educ Física 2004;18(esp):89–100.
5. Riendeau R, Welch B, Crisp C, Crowley L, Griin P, Brockett J. Relationships of body fat to motor itness test scores. Res Q 1958;29(2):200–3.
6. Cyrino ES, Altimare LR, Okano AH, Coelho CF. Efeitos do treinamento de futsal sobre a composição corporal e o desempenho motor de jovens atletas Rev Bras Ciên Mov 2002; 10(1) 41-46.
7. Lee R, Nieman D. Nutritional assessment. 2o. Chicago, IL: Mosby; 1996.
8. Guedes DP. Procedimentos clínicos utilizados para análise da composição corporal. Rev Bras Cineantropom Desempenho Hum 2013; 15(1): 113-29.
9. Durnin JVGA, Womersley J. Body fat assessed from total body density and its estimation from skinfold thickness : measurements on 481 men and women aged from 16 to 72 years. Br J Nutr 1974;32(1):77–97.
10. Siri WE. Composition from luid spaces and density: analisys of methods. In: Brozek J, Henschel A, organizadores. Techniques for measuring body composition. Washington: National Academy of Science; 1961. p. 223–44.
11. Bulbulian R, Johnson R, Gruber J, Darabos B. Body composition in paraplegic male athletes. Med Sci Sports Exerc 1987;19(3):195–201.
12. Ravensbergen HRJC, Lear SA, Claydon VE. Waist circumference is the best index for obesity-related cardiovascular disease risk in individuals with spinal cord injury. J Neurotrauma 2014;31(3):292–300.
13. Gorgatti M, Böhme M. Autenticidade cientíica de um teste de agilidade para indivíduos em cadeira de rodas. Rev Paul Educ Física 2003;17(1):41–50.
14. Neto AP, César MC. Avaliação da composição corporal de atletas de basquetebol do sexo masculino participantes da liga nacional 2003. Rev Bras Cineantropom Desempenho Hum 2005; 7(1):35-44.
15. Sheppard JM, Young WB. Agility literature review: Classiications, training and testing. J Sports Sci 2006;24(9):919–32.
16. Young W, Dawson B, Henry G. Agility and change-of-direction speed are inde-pendent skills: Implications for training for agility in invasion sports. Int J Sports Sci Coach 2015;10(1):159–69.
17. Vanlandewijck Y, Daly D, heisen D. Field test evaluation of aerobic, anaerobic, and wheelchair basketball skill performances. Int J Sports Med 1999;20(8):548–54.
18. Beck L, Lamb J, Atkinson E, Wuermser L, Amin S. Body composition of women and men with complete motor paraplegia. J Spinal Cord Med 2014;37(4):359–65.
19. Dionyssiotis Y, Lyritis GP, Papaioannou N, Papagelopoulos P, homaides T. Inluence of neurological level of injury in bones, muscles, and fat in paraplegia. J Rehabil Res Dev 2009;46(8):1037–44.
20. Chang K-H, Lai C-H, Chen S-C, Hsiao W-T, Liou T-H, Lee C-M. Body com-position assessment in Taiwanese individuals with poliomyelitis. Arch Phys Med Rehabil 2011;92(7):1092–7.
21. Keil M, Totosy de Zepetnek JO, Brooke-Wavell K, Goosey-Tolfrey VL. Measure-ment precision of body composition variables in elite wheelchair athletes, using dual-energy X-ray absorptiometry. Eur J Sport Sci 2016;16(1):65–71.
22. Jones LM, Legge M, Goulding A. Healthy body mass index values often un-derestimate body fat in men with spinal cord injury. Arch Phys Med Rehabil 2003;84(7):1068–71.
Mariane Borges
Rua José Antônio Marinho, 77, fundos, Santa Genebra II Campinas/SP, Brasil
Email: [email protected] 25. Alschuler K, Gibbons L, Rosenberg D, Ehde D, Verrall A, Bamer A, et al. Body