Vol.61, no.spe: e18000028, 2018 http://dx.doi.org/10.1590/1678-4324-smart-2018000028
ISSN 1678-4324 Online Edition
BRAZILIAN ARCHIVES OF BIOLOGY AND TECHNOLOGY A N I N T E R N A T I O N A L J O U R N A L
Comparison of the Performance of the Grid- Connected
Photovoltaic System Installed In the Brazilian Cities:
Blumenau
–
SC and Curitiba- PR
Rafael Stedile
¹*,Fabianna Stumpf Tonin
1,Jair Urbanetz Junior
1 e 2¹ Programa de Pós-Graduação em Sistemas de Energia, Universidade Tecnológica Federal do Paraná, Blumenau, Brasil; ² Programa de Pós-Graduação em Engenharia Civil, Universidade Tecnológica Federal do Paraná, Curitiba, Brasil.
ABSTRACT
This is a study that contemplates the analysis of the main characteristics of 8 grid connected photovoltaic systems (GCPVS), 3 of which are located in the city of Curitiba-PR and 5 located in the city of Blumenau-SC. Data were collected on irradiation in the horizontal plane, generated energy and rainfall, being the first two to calculate the merit indexes, such as Yield, Performance Ratio and Capacity Factor - of those on grid connected Photovoltaic systems.
Key words: Grid Connected Photovoltaic Systems, Merit Indices, Microgeneration.
INTRODUCTION
Energy from the sun has been available for humans for thousands of years, whether for heating, lighting and even for food cultivation1. However, the
conversion of this huge energy potential into the earth into electrical energy dates back to March 1953 when the first silicon solar cell was developed in the Bell Labs by the chemist Calvin Fuller. Technology has evolved over the years and has become popular in many countries because of the benefits granted by its governments.
However, in Brazil, only in 2012, the use of renewable grid connected energy was regulated, through Normative Resolution (REN) 482, which provides a credit compensation policy, which was recently updated by REN 687. This policy allows the exchange of surplus energy generated by credits, valid for up to 60 months 3. Several Brazilian states have adopted exemption of ICMS
on such credits as an incentive, but the following states still charge such tax: Santa Catarina, Paraná, Amazonas, Amapá and Espírito Santo.
Despite the ICMS tax on energy compensated in the mentioned states, there is a large presence of GCPVS in the country. Taking into account that the 13,360 connection points accumulated up to August 2017, a total of 13,232 are from GCPVS4. Thus, it is important to conduct studies focusing not only on the
comparison between GCPVS in different regions of the country, but also on the best use of these systems, maximizing energy production for owners. To do so, merit indexes will be used as a method of comparison between some photovoltaic systems installed in Blumenau and Curitiba. Those GCPVS in question are composed of polycrystalline modules of different brands and powers.
MATERIAL AND METHODS
This study will analyse the electricity generation from five GCPVSs installed in the city of Blumenau-SC and three in the city of Curitiba-PR. In order to do so, the values of energy generated from January 2017 to July 2017 will be used, and the irradiation values applied to the photovoltaic panels for this period. From these data, the merit indexes - Productivity, Performance Rate and Capacity Factor - of the systems in question will be calculated, thus allowing a comparison of the performance of these GCPVSs located in different Brazilian states.
In order to define and compare the overall efficiency of GCPVS installed in different places with different nominal power and non-coincident forms of installations, the following three parameters are used: Yield, Performance Ratio and Factor of Capacity. These parameters are obtained from the values of energy generated by the system and the irradiation values assimilated on the photovoltaic panel 5.
Yield can be calculated by equation 1. This index can represent both monthly and annual production and relates the energy in kWh to the installed kWp power 6.
of the system to convert the solar radiation present in the same inclined plane of the panels into electricity5.
𝑃𝑅=𝑌𝑌𝐹 𝑅
(2)
The variable YR stands for reference productivity, which depends on the solar radiation incident on the panel plane, and which can be calculated by equation 3. The variables HT and Gref respectively signify the irradiance in the panel plane (kWh / m²) within a considered period of time, and the irradiance considered in the standard test conditions is 1000W / m² 7.
𝑌𝑅=𝐺𝐻𝑇 𝑟𝑒𝑓
(3)
The capacity factor (CF) compares generation capacity among different energy sources, because this index makes the consideration that the system would operate continuously at nominal power over a period of a whole year 6.
This index can be easily calculated by equation 4.
𝐶𝐹= 𝐺𝑒𝑛𝑒𝑟𝑎𝑡𝑒𝑑 𝐸𝑛𝑒𝑟𝑔𝑦
𝑃𝑜𝑤𝑒𝑟𝐹𝑉 ∗ 24 ∗ 𝑛𝑏𝑟 𝑜𝑓 𝑑𝑎𝑦𝑠
(4)
Characterization of analysed GCPVSs
The systems studied in the city of Blumenau are all residential systems, with installations on the already existing roofs, so the modules end up assuming the same characteristics of inclination and azimuthal deviation.
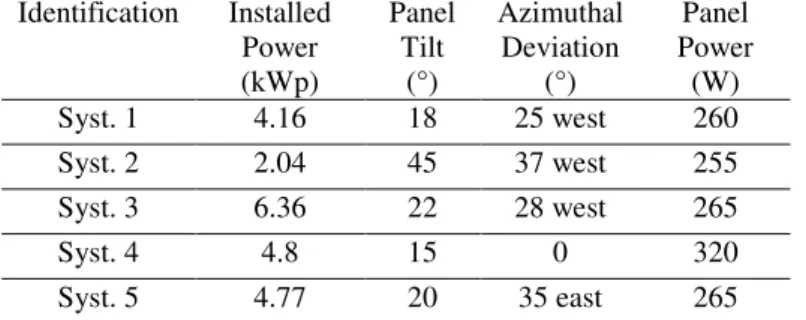
Table 1 presents some of the characteristics of the systems studied in the city of Blumenau.
Table 1 - Characteristics of the systems studied in the city of Blumenau. Identification Installed
Power (kWp)
Panel Tilt
(°)
Azimuthal Deviation
(°)
Panel Power
(W)
Syst. 1 4.16 18 25 west 260
Syst. 2 2.04 45 37 west 255
Syst. 3 6.36 22 28 west 265
Syst. 4 4.8 15 0 320
Syst. 5 4.77 20 35 east 265
Source: Authors.
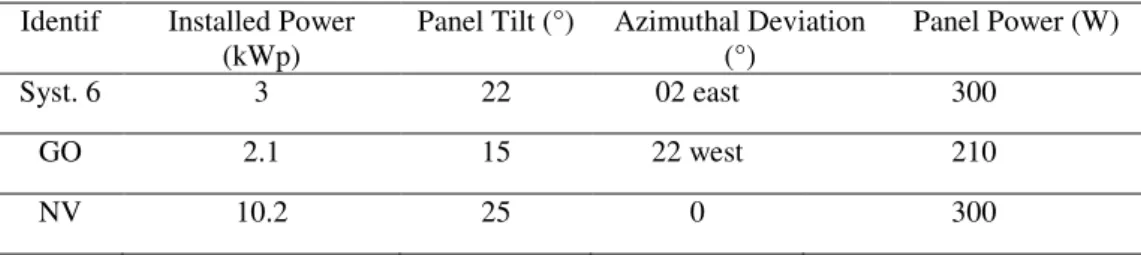
Table 2 presents some characteristics of the GCPVS analysed in the city of Curitiba.
Table 2- Characteristics of the systems studied in the city of Curitiba. Identif Installed Power
(kWp)
Panel Tilt (°) Azimuthal Deviation (°)
Panel Power (W)
Syst. 6 3 22 02 east 300
GO 2.1 15 22 west 210
NV 10.2 25 0 300
Source: Authors.
Irradiation data
The data collected by the automatic station of the National Institute of Meteorology (INMET) A817 8, located in the city of Indaial, were used to
calculate the merit indexes of the systems analysed in Blumenau. This is the INMET closest station to the analysed systems. In the months of February and June 2017 the station went through maintenance and it was 19 and 24 days respectively out of operation. Therefore, for those months, the data of the Brazilian Atlas of Solar Energy [9] were chosen. For the systems analysed in the city of Curitiba, the data collected by the INMET A807 automatic station, located in Curitiba, were used.
However, the data collected by the pyrometers of the INMET stations are in the horizontal plane, and for the calculation of merit indexes it is necessary that these data have the same characteristics of the modules of the analysed systems. In order to do so, the RADIASOL program, available from the Federal University of Rio Grande do Sul (UFRGS) is used, which allows, from the insertion of the irradiation values in the horizontal plane, to identify the irradiance values for any plane (different inclinations and azimuthal deviation from the north) 10.
RESULTS AND DISCUSSION
The main characteristics and merit indexes of the eight GCPVSs during the seven-month period were studied. Table 3 shows the productivity indexes of the systems located in Blumenau. System 2 is in an area with great influence of the shading created by surrounding trees, besides having unfavourable installation characteristics, such as sharp azimuthal deviation and panel inclination in a value well above the latitude of Blumenau. Such features impact negatively on the productivity of the system. The installation conditions can be seen in Figure 1.
Table 3 - Productivity of 2017 (kWh / kWp) of the systems analyzed in Blumenau.
Month Syst. 1 Syst. 2 Syst. 3 Syst. 4 Syst. 5 Jan 128.14 77.26 133.04 136.88 123.38
Feb 118.26 61.89 119.69 122.00 110.92
Mar 99.61 55.99 99.60 106.88 95.95
Apr 86.24 46.86 90.93 89.94 86.47
May 61.84 29.53 65.47 63.28 59.81
Jun 72.88 34.39 76.43 74.81 71.17
Figure 1 - System 2. Source: SOLARSOU.
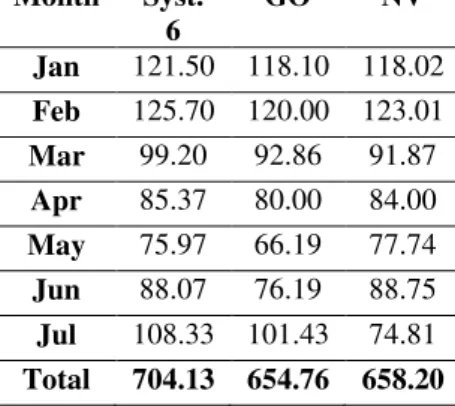
Table 4 presents the productivity indexes for the systems analysed in the city of Curitiba.
Table 4 - Productivity 2017 (kWh/kWp) of the systems analyzed in Curitiba.
Month Syst. 6
GO NV
Jan 121.50 118.10 118.02
Feb 125.70 120.00 123.01
Mar 99.20 92.86 91.87
Apr 85.37 80.00 84.00
May 75.97 66.19 77.74
Jun 88.07 76.19 88.75
Jul 108.33 101.43 74.81
Total 704.13 654.76 658.20
Source: Authors.
Graph 1 concatenates the information contained in tables 3 and 4, with the purpose of visually show that the system 6 installed in a residence of Curitiba obtained, among the eight systems analysed, the best index of productivity for the studied period. System 6 is shown in Figure 2.
Figure 2 - System 6. Source: Authors.
Table 5 shows the performance rate obtained by the analysed systems in the city of Blumenau.
Table 5 - Performance rate of 2017 of the systems analyzed in Blumenau.
Month Syst. 1 Syst. 2 Syst. 3 Syst. 4 Syst. 5 Jan 68.30% 46.65% 71.71% 72.55% 66.07%
Feb 77.90% 44.81% 79.32% 80.04% 73.36%
Mar 79.97% 47.69% 80.06% 85.68% 77.21%
Apr 83.90% 47.07% 88.18% 87.66% 84.40%
May 85.14% 41.54% 89.76% 87.23% 82.53%
Jun 74.87% 34.08% 77.23% 77.25% 73.35%
Jul 76.55% 40.40% 72.53% 80.03% 72.20%
Total 78.09% 43.18% 79.83% 81.49% 75.59%
Source: Authors.
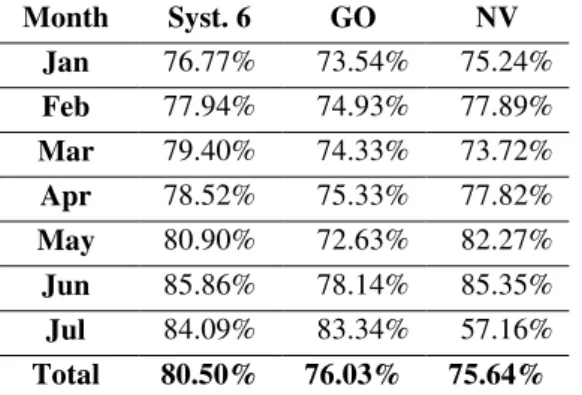
Table 6 shows the performance rate calculated for the systems analysed in Curitiba.
Table 6 - Performance ratio of 2017 of the analyzed systems in Curitiba
Month Syst. 6 GO NV
Jan 76.77% 73.54% 75.24%
Feb 77.94% 74.93% 77.89%
Mar 79.40% 74.33% 73.72%
Apr 78.52% 75.33% 77.82%
May 80.90% 72.63% 82.27%
Jun 85.86% 78.14% 85.35%
Jul 84.09% 83.34% 57.16%
Total 80.50% 76.03% 75.64%
Source: Authors.
Figure 3 - Cumulative performance rate of the analyzed systems from January to July 2017. Source: Authors.
Figure 4 - System 4.
Source: SOLARSOU.
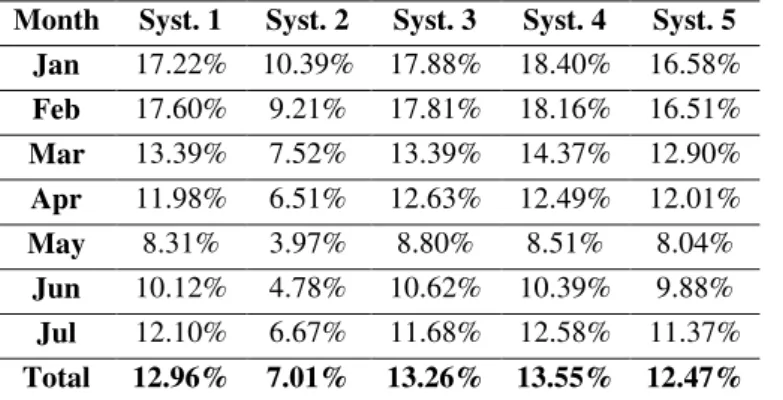
Table 7 shows the capacity factor of the systems analysed in Blumenau.
Table 7- Capacity factor of 2017 of the systems analyzed in Blumenau.
Month Syst. 1 Syst. 2 Syst. 3 Syst. 4 Syst. 5 Jan 17.22% 10.39% 17.88% 18.40% 16.58%
Feb 17.60% 9.21% 17.81% 18.16% 16.51%
Mar 13.39% 7.52% 13.39% 14.37% 12.90%
Apr 11.98% 6.51% 12.63% 12.49% 12.01%
May 8.31% 3.97% 8.80% 8.51% 8.04%
Jun 10.12% 4.78% 10.62% 10.39% 9.88%
Jul 12.10% 6.67% 11.68% 12.58% 11.37%
Total 12.96% 7.01% 13.26% 13.55% 12.47%
Source: Authors.
Table 8 shows the capacity factor of the systems analysed in Curitiba.
Table 8 - Capacity factor of 2017 of the systems analyzed in Curitiba.
Month Syst. 6 GO NV
Jan 16.33% 15.87% 15.86%
Feb 18.71% 17.86% 18.31%
Mar 13.33% 12.48% 12.35%
Apr 11.86% 11.11% 11.67%
May 10.21% 8.90% 10.45%
Jun 12.23% 10.58% 12.33%
Jul 14.56% 13.63% 10.06%
Total 13.89% 12.92% 13.00%
Source: Authors.
Sist. 1
Sist. 2
Sist. 3
Sist. 4
Sist. 5
Sist.
6 EV NV Total 78,09 43,18 79,83 81,49 75,59 80,50 76,03 75,64
Graph 5 expresses the capacity factor of the eight analyzed systems. Among the analyzed systems, system 6 was the one that obtained the best performance.
Figure 5 - Cumulative capacity factor of the analyzed systems from January to July 2017. Source: Authors.
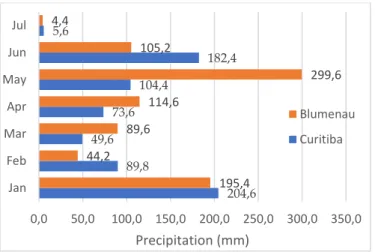
Another important factor that must be taken into account in the generation of energy through photovoltaic (PV) technology is the rainfall indexes, since these values directly affect the incidence of irradiation on the photovoltaic modules. The data presented in Graph 6 brings this information, however, for the city of Blumenau, the data for the months of February and June are incomplete for the reasons already mentioned.
Figure 6 - Rainfall index recorded in mm for the cities of Blumenau and Curitiba. Source: Authors.
Among the eight GCPVSs analysed, the 3 kWp installed in a residence in Curitiba, generated approximately 704.13 kWh / kWp during the first seven months of 2017, and, therefore, presented the best productivity index. This justification for the high productivity is due to the fact that this system is installed very close to the optimal conditions of installation - azimuthal deviation very close to zero and inclination close to the latitude of the city (25º to Curitiba), thus allowing to maximize the solar radiation on the modules and consequently increase the productivity of this system. Regarding the Sist. 1 Sist. 2 Sist. 3 Sist. 4 Sist. 5 Sist.
6 EV NV
Total 12,9 7,01 13,2 13,5 12,4 13,8 12,9 13,0 0% 2% 4% 6% 8% 10% 12% 14% 16% 204,6 89,8 49,6 73,6 104,4 182,4 5,6 195,4 44,2 89,6 114,6 299,6 105,2 4,4
0,0 50,0 100,0 150,0 200,0 250,0 300,0 350,0
INMET system influenced the irradiance indexes in Blumenau and, consequently, the performance rate of the systems, thus impairing the analysis of this parameter. On the other hand, Syst. 6 was the one that obtained the greatest factor of average capacity between the systems, 13.89%, presenting a difference of 6.89% for Syst. 2 which had the worst result.
CONCLUSION
The results show that the way the system is installed - orientation, inclination and shading - has a great impact on the performance of the GCPVS. This was evidenced in Syst. 2 and 6 that presented, respectively, the worst and the best result according to productivity and capacity factor. Syst. 2 is installed with a slope of 45° and azimuthal deviation of 37° west, numbers below the ideal installation for the region of Blumenau, which would be 27 ° inclination with zero azimuthal deviation. In addition, Syst. 2 has a large number of nearby trees that project large amounts of shade, with greater intensity in the winter. Such shading reduces the incidence of light rays on the modules, thereby reducing the efficiency of this system.
In the case of Syst. 6, one of the justifications for the excellent performance are due to the fact that this system was installed in the optimum conditions, that is, with azimuthal deviation from the geographic north, very close to zero, and the 22 ° inclination of the modules very close to the latitude value of the city of Curitiba (25 °), and the panel is in a shaded area. These factors contribute to the maximization of energy generation throughout the year. The Neoville (NV) system presents the best installation characteristics, panel tilt angle equal to the latitude of the city in which it was installed, zero azimuth deviation, and a totally free shading area. However, it did not present the best performance index due to the high disconnection rate of the utility grid, thus leaving the system inoperative for several hours during the day.
Among the systems studied, it is evident that installing the system under optimum conditions does not guarantee the best indexes, such as Syst. NV, however, to install the PV system outside the optimal conditions and with adverse natural factors such as Syst. 2, will certainly perform below-average merit indexes.
The year 2017 is an atypical year when compared to the historical data brought by the Brazilian Atlas of Solar Energy, since normally, the month with the lowest productivity index is the month of June. However, this year, as it was possible to observe in Tables 3 and 4, there was a displacement of this valley in the productivity curve for the month of May. This occurred due to the high rainfall indexes for this month, as observed in Graph 5. The month of January also presented a high rainfall index. However, rain happened mostly in the late afternoon, thus minimizing their impact on the generation of in PV systems. Rainfall in May occurred mostly during long periods of the day, impacting heavily on productivity.
FINAL CONSIDERATIONS
We thank the company RIBEIRO SOLAR for having understood the need and thus supporting the research with the provision of monitoring equipment. The company SOLARSOU for having kindly provided the requested data of the systems installed. UTFPR for offering its GCPVS for research purposes.
REFERENCES
1- Tolmasquim MT. "Energia Renovável: hidráulica, biomassa, eólica, solar, oceânica." Rio de Janeiro: Empresa de Pesquisa Energética (2016).
2- Vallêra AM, Brito MC. Meio século de história fotovoltaica. Gazeta da física, v. 29, n. 1, p. 10-15, 2006.
3- Agência Nacional de Energia Elétrica, Resolução Normativa Nº. "482.", (2012). 4- BIG Banco de Informação Geração
http://www.aneel.gov.br/aplicacoes/capacidadebrasil/capacidadebrasil.cfm. 15 Ago 2017
5- Benedito RS. Caracterização da geração distribuída de eletricidade por meio de sistemas fotovoltaicos conectados à rede, no Brasil, sob os aspectos técnico, econômico e regulatório. 2009. Tese de Doutorado. Universidade de São Paulo. 6- Tonin FS, Urbanetz JJ. Caracterização de Sistemas Fotovoltaicos Conectados à Rede Elétrica-GCPVS, Curitiba, 2017.
7- Pinho JT, Galdino MA. Manual de engenharia para sistemas fotovoltaicos. Rio de Janeiro: CEPEL, 2014.
8- Instituto Nacional de Meteorologia. http://www.inmet.gov.br/portal/index.php?r= estacoes/estacoesAutomaticas. 18 Ago. 2017
9- Pereira EB et al. Atlas brasileiro de energia solar. INPE, 2006. 10- Universidade Federal do Rio Grande do Sul. Programa RADIASOL, Laboratório de Energia Solar, 2012.