Rui Jorge Fernandes Poças
November 2017
Export Sophistication and Quality: Crossing
the two measures
Rui Jorge Fernandes Poças
Expor
t Sophis
tication and Quality
: Crossing t
he tw
o measures
UMinho|2017
Universidade do Minho
Escola de Economia e Gestão
Rui Jorge Fernandes Poças
November 2017
Export Sophistication and Quality: Crossing
the two measures
Supervisors:
Professor Doutor Manuel de Herédia Caldeira Cabral
Professor Doutor Nguyen Manh Tuan
Professor Doutor Miguel Portela
Master in International Business
Universidade do Minho
Escola de Economia e Gestão
DECLARAÇÃO
Nome: Rui Jorge Fernandes Poças
Endereço eletrónico: rui_brg04@hotmail.com Telefone: +351 935146003_ Número do Cartão do cidadão: 13263442
Título dissertação: Export Sophistication and Quality: Crossing the two measures
Orientadores:
Professor Doutor Manuel de Herédia Caldeira Cabral Professor Doutor Nguyen Manh Tuan
Professor Doutor Miguel Portela
Ano de conclusão: 2017
Designação do Mestrado: Mestrado em Negócios Internacionais
É AUTORIZADA A REPRODUÇÃO INTEGRAL DESTA DISSERTAÇÃO APENAS PARA EFEITOS DE INVESTIGAÇÃO, MEDIANTE DECLARAÇÃO ESCRITA DO INTERESSADO, QUE A TAL SE COMPROMETE;
Universidade do Minho, 02/11/2017
University of Minho iii
“It’s fine to celebrate success but it is more important to heed the lessons of failure”
University of Minho v
Acknowledgments
After a period of 10 months on the AREAS+ project in Vietnam, I must thank the Ho Chi Minh University of Technology, for all the support during my Erasmus Mundus experience. I thank Vietnam for all the adventures and the program staff support as well as my new friends, colleagues and Vietnam citizens for an amazing experience in Asia.
I thank my supervisors for all the support during my work. For the guidelines and help in the difficult stages during this period.
I also thank all my family and friends for being there for me, they provided their support in emotionally difficult periods. Especially my parents, siblings and my friend Deesha with precious English reviews.
Last but not least, I thank my girlfriend Priscila for all the support during all my research period, for being always a huge light, guiding my way, inspiring me day by day.
Thank you all for the help and support, without friends and family life it’s just not possible.
University of Minho vii
Abstract
Several recent studies, established the importance of the dynamics of export sophistication for growth and development. Other studies, report a widening of the unit prices of each product reflecting the importance of distinguishing the level of exports quality of each country. The present study reveals the relationship between measures of export quality and sophistication. Quality is a within-product measure, while sophistication is an across-product measure. We question if the quality improvement strategies and climbing the sophistication ladder strategies are complements or substitutes, and address in each case which strategy was more successful. We aim to add to the literature of the area by bringing together these two branches of the international trade literature and by addressing how both strategies contribute to the countries production and growth. The results suggest higher relevance of the exports sophistication for the countries development in part due to some limitations of the quality measurement through the unit value. In trying to solve these unit value limitations, a new quality indicator by the name of “QUALY” was developed using a unit value ratio. The results of this new variable suggest a correlation of the exports quality with the exports sophistication and with development. This study suggests that the climbing sophistication strategy was more successful for the country’s exports over the last years, but also suggest a complementarity between exports quality and sophistication, both having positive influence for the countries development.
University of Minho ix
Resumo
Vários estudos recentes estabelecem a importância da dinâmica da sofisticação das exportações para o crescimento e desenvolvimento. Outros estudos referem um crescimento dos preços unitários de cada produto que reflete a importância de distinguir o nível de qualidade das exportações de cada país. O presente estudo revela a relação entre as medidas de qualidade e sofisticação da exportação. Qualidade é uma medida interna dos produtos, enquanto sofisticação é uma medida entre diferentes produtos. Questionamos se estratégias de melhoria de qualidade e estratégias de aumento da sofisticação são complementares ou substitutas, avaliando, em cada caso, qual estratégia foi mais bem-sucedida. O nosso objetivo é contribuir para a literatura da área, reunindo estes dois ramos da literatura do comércio internacional e, avaliar como ambas as estratégias contribuem para a produção e crescimento dos países. Os resultados sugerem uma maior relevância da sofisticação das exportações para o desenvolvimento países, em parte, devido a algumas limitações da medição da qualidade através do valor unitário. Na tentativa de resolver estas limitações do valor unitário, um novo indicador de qualidade nomeado "QUALY" foi desenvolvido utilizando um rácio do valor unitário. Os resultados desta nova variável sugerem uma correlação da qualidade das exportações com a sofisticação das exportações e com desenvolvimento. Este estudo sugere que a estratégia de aumento de sofisticação foi mais bem-sucedida para as exportações dos países ao longo dos últimos anos, mas também sugerem uma complementaridade entre a qualidade e sofisticação das exportações, tendo ambos influência positiva para o desenvolvimento dos países.
Palavras-chave:
Exportação. Qualidade. Sofisticação. Correlação das medidas deUniversity of Minho xi
Table of contents
Abstract ... vii
Resumo ... ix
Table of contents ... xi
List of graphs and tables ... xii
List of abbreviations ... xiii
1. Introduction ... 1
1.1. Rationale of research ... 2
1.2. The project description ... 3
2. State of the art ... 5
2.1. Export quality measure ... 10
2.2. Export sophistication measure ... 13
3. Research design ... 19
3.1. Type of research ... 19
3.2. Details of data ... 19
3.3. Research method ... 21
3.4. Econometric methods ... 25
4. Data analyses and results ... 27
5. Conclusions and final remarks ... 43
References... 45
xii Rui Poças
List of graphs and tables
Graph 1 – Sophistication by product category (PRODY) ... 29
Graph 2 – Countries sophistication (EXPY) ... 30
Graph 3 – Countries quality (unit value) ... 30
Graph 4 – Sophistication (EXPY) and quality (unit value) ... 33
Graph 5 – Sophistication (EXPY) and quality (QUALY) ... 33
Graph 6 – GDPPC and sophistication (EXPY) ... 34
Graph 7 – GDPPC and quality (unit value) ... 35
Graph 8 – GDPPC and quality (QUALY) ... 35
Graph 9 – Education and sophistication (EXPY) ... 36
Graph 10 – Education and quality (QUALY) ... 37
Graph 11 – Distribution of log PRODY and log unit value ... 50
Graph 12 – Distribution of log EXPY and log unit value ... 51
Graph 13 – EXPY and unit value estimated density ... 51
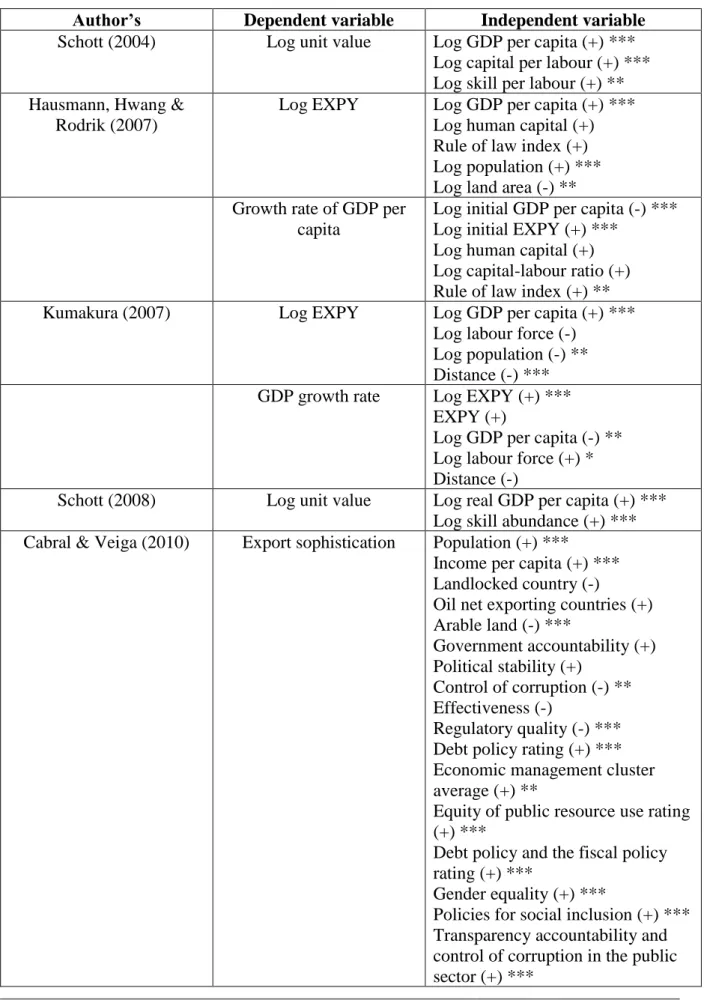
Table 1 – Related literature studies ... 8
Table 2 – Descriptive statistics for the variables ... 31
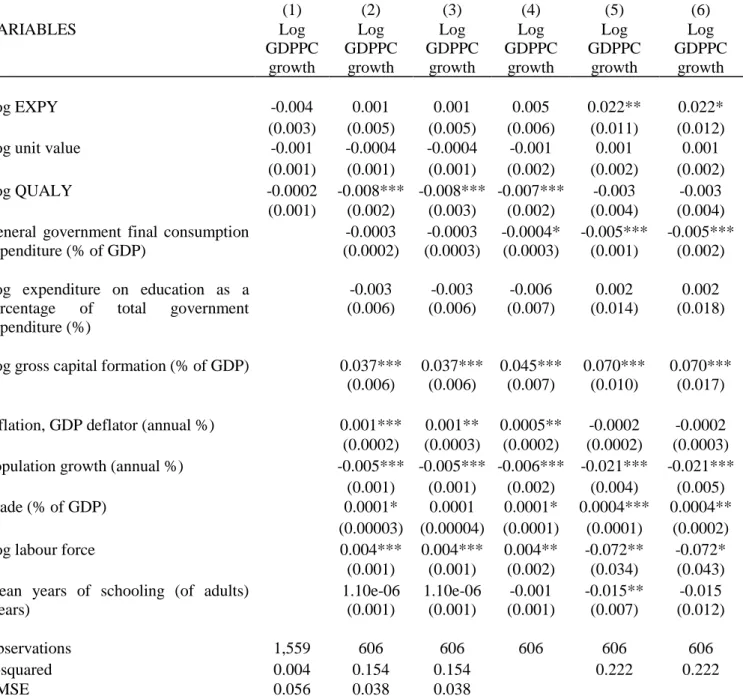
Table 3 – Regressions of sophistication and quality and GDPPC ... 38
Table 4 – Regressions of sophistication and quality and GDPPC growth ... 40
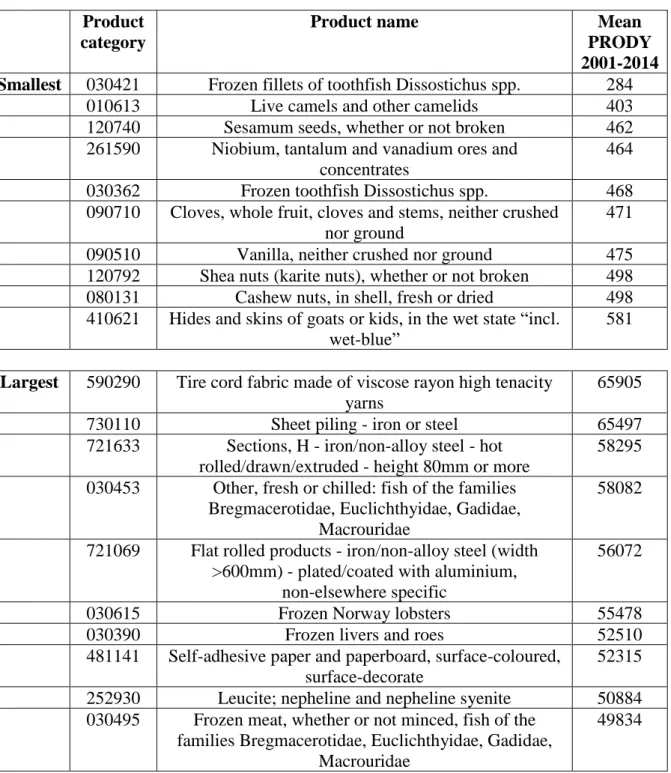
Table 5 – Largest and smallest PRODY values (products sophistication) ... 52
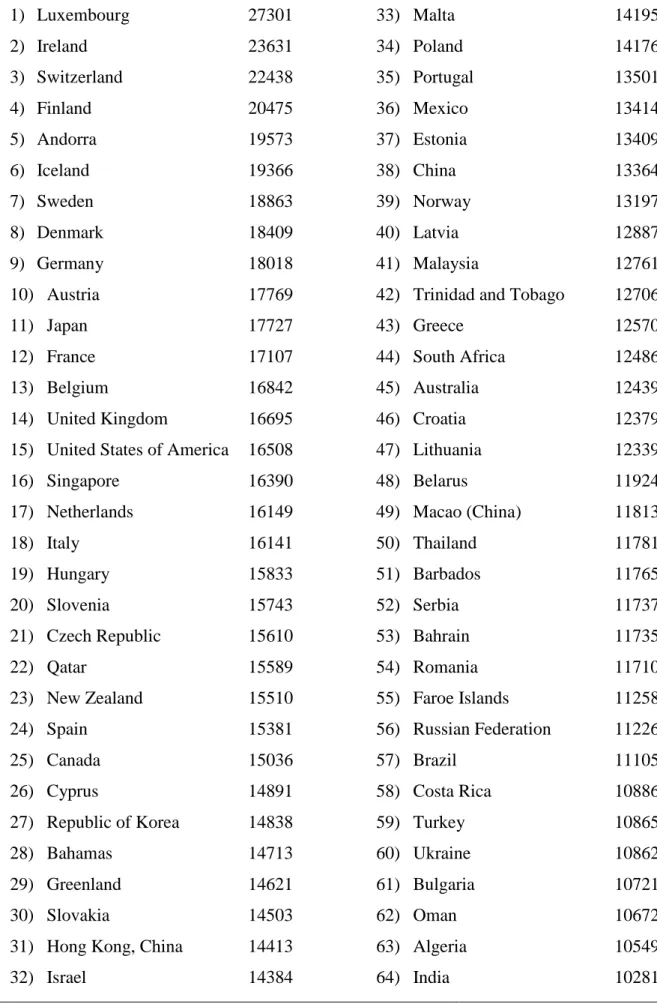
Table 6 – Ranking of countries based on average EXPY (between 2001 and 2014) ... 53
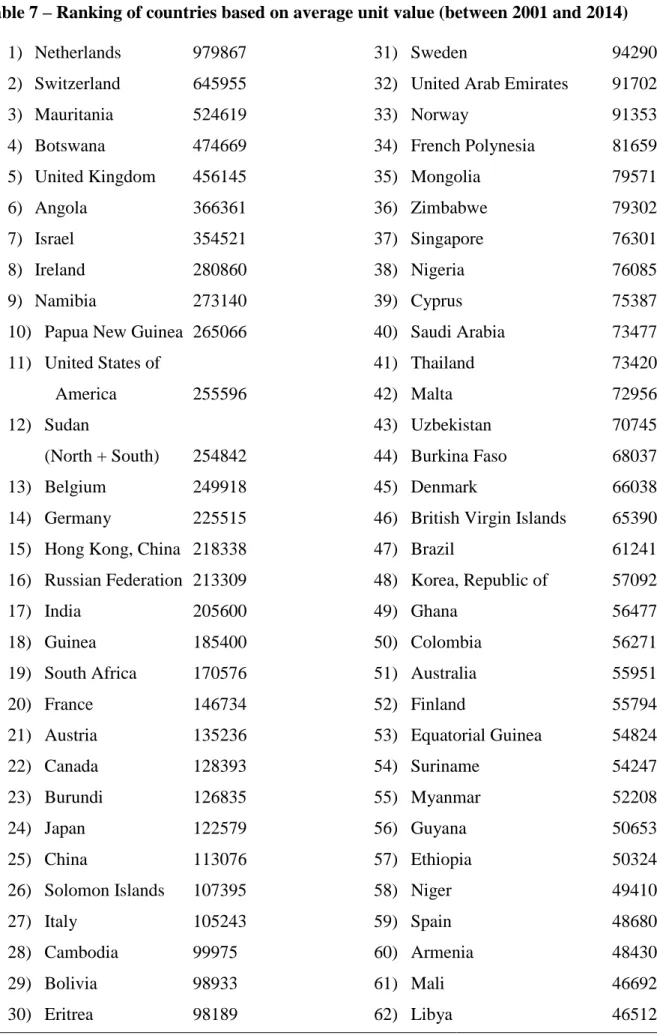
Table 7 – Ranking of countries based on average unit value (between 2001 and 2014) ... 57
University of Minho xiii
List of abbreviations
CIA Central Intelligence Agency EU European Union
GDP Gross Domestic Product HS Harmonized System ITC International Trade Centre OLS Ordinary Least Squares
GDPPC Gross Domestic Product per capita PIB Produto Interno Bruto
UV Unit Value
US United States
WCO World Customs Organization WDI World Development Indicators
University of Minho 1
1. Introduction
Over the last 20 years the elimination of trade barriers, the integration of markets and globalisation, along with the radical evolution of technology, communication and transportation had an extremely important effect on world trade.
Since the 1980s, the wave of globalisation has seen the significant integration of the world economy. Global trade has increased rapidly during this period (Zhu et al. 2010). Therefore, research on international trade grows in relevance and gains an increasing audience every day.
Considering two very important export evaluative criteria – quality and sophistication – reveals itself to be a demanding and difficult task, but at the same time, ambitious and rewarding work, aiming to contribute to the investigation of international trade through a quantitative study of global exports.
Several authors’ present recent studies about export sophistication - Lall, Weiss and Zhang (2006), and Hausmann, Hwang and Rodrik (2007) - given its clear relevance at intra-industrial level, as well as at inter-intra-industrial level and between the industries of different countries. The sophistication of exports portrays, on a comparative level, the higher or lower relative position in the value chain of different products.
Furthermore, export quality is a subject which has been studied by a wide array of scholars including Hallak and Schott (2011), and Henn, Papageorgiou and Spatafora (2013), due to the fact that it is also a topic of significant interest for international trade. Quality portrays, in a simplified way, the value differences between products in the same category; for example, a footwear product produced in China at reduced cost and quality, compared to a similar product produced in France, which costs several times more, with almost incomparable quality.
Using data from the International Trade Centre (ITC), the income level associated with 6049 products categories is calculated and later one computes the productivity level associated with a country’s export basket for 217 countries over the globe.
The main purpose of this research is to combine these two measures of classifying exports, with the aim of finding new trends, patterns and similarities in international trade, as well as finding answers and possible solutions for these same trends and economic phenomena. To achieve this goal, econometric models are used, including regression analyses.
2 Rui Poças
At the beginning of this research some questions have been explored, which one will attempt to answer during this study. Interesting and, to some extent, surprising results originated, which lead to the main conclusions of the current analysis.
1.1. Rationale of research
The sophistication level of a country’s exports is an important evaluator of its trade balance. However, this indicator does not assess the quality of these exports, and quality is another indicator of high significance on the exports basket. This research aims to combine these two measures and establish more logical patterns in the country’s trade balance. Sophistication is an across-product measure, which assesses the structure of the exports basket while quality is a within-product measure, which implies a relative specialisation of each product category.
There are other important criteria, like price and quantity. However, as Benkovskis and Rimgailaite (2011) argue, these are not the only important characteristics of international trade. These authors, among others, point out the relevance of variety on a new European Union (EU), but also the quality importance, stating that a large part of the increase in the prices of exports resulted from improving quality, and did not result in a loss of competitiveness.
The choice of sophistication and quality rather than other important criteria mentioned above, beyond the perceived importance of these two measures, has to do with the correlation between both. Furthermore, the real belief of a positive contribution for the exports theory through this methodology, and the certainty to be enriching and rewarding for the researcher, for instance, through an incentive large exports database, emerges as the main choice reasons.
Additionally, as far as the author knows, the methodology of this research has not yet been used in literature in this specific way, crossing these two measures through the calculations discussed below, which provides academic significance to the current study. There are a few studies using the calculation for export sophistication (constructed by Hausmann, Hwang and Rodrik (2007)), but none of them compare it with export quality data using the unit value measure. It is quite relevant to study global exports given its determinacy for the international trade and for the theories of international business.
Relating the literature, the objective of this work is to attempt to answer the following research questions:
University of Minho 3
1. Which strategy is more successful between quality improvement and climbing the sophistication ladder? Are they complementary or substitutes?
2. In each case, what measure should the countries give greater efforts to in the coming years, given the past experience?
3. What is the correlation between export quality and export sophistication?
1.2. The project description
This project proves itself challenging and ambitious given the wide range of data, but not always comparable to high research standards, in most of the countries across the globe. Knowing the difficulties that will arise during this work from the start, the perseverance and motivation, which stems from the desire to contribute positively to the research on international trade, overlaps.
In the following chapters, we will undertake a review of the literature, explain the calculations, the data collection, the software tools and statistical methods used in the project. As stated above, this research aims to contribute to the international trade theories through a study on exports at a global level, by analysing the quality and sophistication of exports from several countries.
By combining these two export evaluations, it will be possible to find export patterns for several countries from different regions or at different development levels.
Together with the discussion of the key literature in the field, we will provide quantitative research by constructing a database on exports using statistical methods to uncover the correlation between exports quality and sophistication data. We will also present pertinent econometric analyses with relevant statistical tests.
In the last phase, we will discuss some possible explanations for the results obtained by highlighting the most significant and the most surprising results, as well as suggestions for further research.
University of Minho 5
2. State of the art
With liberalisation and globalisation, the pattern and evolution of exports is attracting greater interest in developing countries (Lall, Weiss and Zhang, 2006) and the structural changes and global growth of exports reveals itself to be an increasingly global concern and critical to many countries.
According to Joshi (2005), the term export means shipping the goods and services out of the port of a country. The seller of such goods and services is referred to as an exporter and is based in the country of export, whereas the overseas-based buyer is referred to as an importer. In international trade, exports refer to selling goods and services produced in the home country to other markets.
A country’s geography is a relevant influence on exports (Bernard, et al. 2007), with distance being an important factor to take into account. For example, it impacts on a country’s export basket or on the number of countries with which the companies trade, having a high influence on exports globally and, in some cases, leading to a firms’ reallocation.
Greater trade openness raises industry productivity via a selection effect (lowering the maximum marginal cost of active firms) and via a production reallocation effect (production shifts to the most productive firms) (Baldwin and Robert-Nicoud, 2004). The exposure to trade will only induce the more productive firms to enter the export market, while some less productive firms continue to produce only for the domestic market, and will simultaneously force the least productive firms to exit (Melitz, 2003). Aggregate reallocation made a larger contribution to growth than aggregate technical efficiency, suggesting that movement of inputs to more highly valued activities on average plays a stabilising role in manufacturing growth (Petrin, White and Reiter, 2011).
In their study on China, Gao, Whalley and Ren (2014) decomposed the country’s export growth into three parts: extensive margin, increased quantity and increased prices. It was concluded that China’s export growth depends more on price increases and less on quantity expansion. The extensive margin, defined as the growth of exports due to change in varieties, plays the least important role out of the three parts. The authors’ explanation for these three factors is that the contribution of price will probably increase gradually, because of the improvement in the commodities’ quality, while the quantity will probably decrease because of a rising labour cost. A note should be highlighted. One possible explanation for why variety
6 Rui Poças
plays the least important role may arise from data aggregation, which limits the analysis and may lead to underestimation of its contribution.
Using 1995 trade data, Hummels and Klenow (2002) showed that the extensive margin (variety), accounts for two-thirds of the increase in exports of larger economies, and one-third of the increase in imports of larger economies. Price and quantity decompositions indicate that richer countries export more units at higher prices, and their estimates imply that quality differences could be the proximate cause for about 25 percent of a country’s differences in real income per worker.
The aforementioned authors present some additional significant considerations, like the positive correlation between the exports’ variety and the country’s size, and also the importance of the quality differentiation for trade models and export growth. They also find that larger economies export more in absolute terms than smaller economies and that within categories, richer countries export more units at higher prices to a given market, which is consistent with producing higher quality. Their estimates imply that quality differences could be a proximate cause of around 9 percent of country’s differences in real income per worker.
Feenstra et al. (1999) and Feenstra and Kee (2008) tested the exports variety on the productivity and the endogenous growth of the countries and found a positive correlation between these variables. Therefore, the variety is an important criterion of export classification, as well as other extremely important criteria widely studied in modern theories of international trade, such as, quantity, quality and sophistication.
It is widely believed that technology-intensive exports imply greater development benefits to exporting countries (Lall, Weiss and Zhang, 2006). These authors proposed a new classification for the division of traded categories of products called “sophistication” to measure the product characteristics based on the average income of exporting economies. The authors argue that an export is more sophisticated the higher the average income of its exporter is. Their classification integrates not only technology, as the most important factor, but also other significant factors, including marketing, logistics, proximity and infrastructure.
According to Khandelwal (2010), the potential for quality upgrading varies by product and tends to be higher in manufactures than in agriculture and natural resources. This explanation could be the reason why some countries, at an early stage of development, change their production to more sophisticated goods as a precondition to reaping large gains from quality improvement (Henn, Papageorgiou and Spatafora, 2013).
University of Minho 7
In a study on US imports by Schott (2004), these findings have already been mentioned, since, according to the author’s results, the manufactured goods exhibit a significant relationship between unit value and the Gross Domestic Product per capita (GDPPC) in favour of within-product specialisation, whereas the results were not favourable to across-product specialisation.
Lall (2000) argues that low-technology products have the least beneficial spillover effects on the economy and that it tends to grow slower. The author argues that export structures, being path-dependent and difficult to change, have important implications for growth and development and that the technology-intensive products have the most beneficial effects, growing faster in the world trade.
The aforementioned author defends that a set of few countries are succeeding in their export performance, with rapidly expanding export earnings and increasing quality, with many countries stagnating in terms of both export earnings and quality. Countries ‘in the middle’ present reasonable rates of quantity growth but relatively weak improvements in quality.
The technological spillovers between industries are mentioned by various authors as Nadiri (1993), who states that the diffusion of new technologies is considerable and their effects on productivity growth are sizable. Technological products therefore, in general the most expensive ones, are where countries should invest. As Hausmann and Klinger (2006) say, rich countries produce more output per worker but also more challenging products, the “rich-country” goods.
“Economies grow by upgrading the type of products they produce and export, the technology, capital, institutions and skills needed to make such new products are more easily adapted from some products than others.” (Hidalgo et al. 2007)
8 Rui Poças
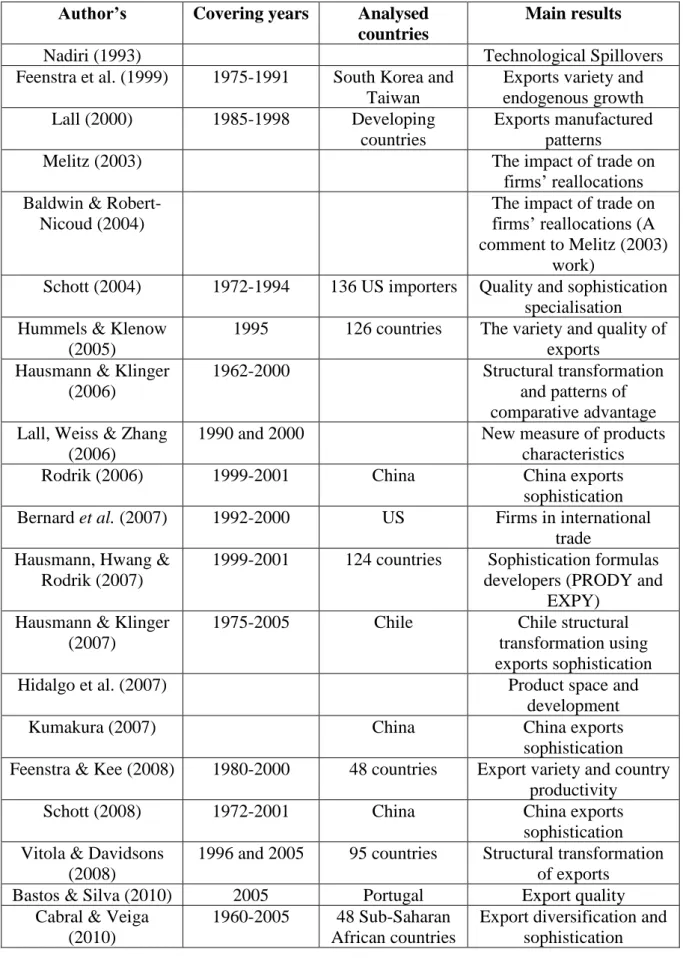
Table 1 – Related literature studies
Author’s Covering years Analysed countries
Main results
Nadiri (1993) Technological Spillovers Feenstra et al. (1999) 1975-1991 South Korea and
Taiwan
Exports variety and endogenous growth Lall (2000) 1985-1998 Developing
countries
Exports manufactured patterns
Melitz (2003) The impact of trade on firms’ reallocations Baldwin &
Robert-Nicoud (2004)
The impact of trade on firms’ reallocations (A comment to Melitz (2003)
work)
Schott (2004) 1972-1994 136 US importers Quality and sophistication specialisation Hummels & Klenow
(2005)
1995 126 countries The variety and quality of exports
Hausmann & Klinger (2006)
1962-2000 Structural transformation and patterns of comparative advantage Lall, Weiss & Zhang
(2006)
1990 and 2000 New measure of products characteristics Rodrik (2006) 1999-2001 China China exports sophistication Bernard et al. (2007) 1992-2000 US Firms in international
trade Hausmann, Hwang &
Rodrik (2007)
1999-2001 124 countries Sophistication formulas developers (PRODY and
EXPY) Hausmann & Klinger
(2007)
1975-2005 Chile Chile structural transformation using exports sophistication Hidalgo et al. (2007) Product space and
development Kumakura (2007) China China exports
sophistication Feenstra & Kee (2008) 1980-2000 48 countries Export variety and country
productivity Schott (2008) 1972-2001 China China exports
sophistication Vitola & Davidsons
(2008)
1996 and 2005 95 countries Structural transformation of exports
Bastos & Silva (2010) 2005 Portugal Export quality Cabral & Veiga
(2010)
1960-2005 48 Sub-Saharan African countries
Export diversification and sophistication
University of Minho 9
Hausmann & Klinger (2010)
1985-2007 Ecuador Ecuador structural transformation using exports sophistication Khandelwal (2010) 1989-2001 US importers Quality ladders of US
imports
Mandel (2010) 1994-2006 US importers Heterogeneous Firms and Import Quality Minondo (2010) 1999-2001 113 countries Exports quality and
productivity Xu (2010) China China exports
sophistication Zhu et al. (2010) 1992-2006 171 countries Export sophistication
drivers Baldwin & Harrigan
(2011)
2005 228 US exporters Export quality
Benkovskis & Rimgailaite (2011).
1999-2009 10 EU new member states
Quality and variety of EU new member states Hallak & Schott
(2011)
1989-2003 43 US trading partners
Differences in product quality
Mishra, Lundstrom & Anand (2011)
1990-2007 103 countries Service export sophistication Petrin, White & Reiter
(2011)
1976-1996 US Reallocations and technical progress Sutton & Trefler
(2011)
1980 and 2005 94 countries Quality and GDP per capita on export basket Jarreau & Poncet
(2012)
1997-2009 China Export sophistication
Jesus et al. (2012) 124 countries Product complexity Johnson (2012) 1985-1995 and
2000
125 countries Prices and quality of exports Szcygielski &
Grabowski (2012)
1994-2009 183 Germany exporters
Are unit values correct measures of exports
quality? Henn, Papageorgiou &
Spatafora (2013)
1962-2010 178 countries Export quality in developing countries Jesus et al. (2013) 1962-2006 China China’s sophistication and
diversification Feenstra & Romalis
(2014)
1984-2008 200 countries Export prices and quality
Gao, Whalley & Ren (2014)
1995-2010 35 China’s importers
China’s export variety, quality and quantity Vandenbussche (2014) 2005-2011 EU exporting
countries
New quality indicator
Gervais (2015) 1972-1997 US Product quality Thorbecke & Pai
(2015)
East Asian exports sophistication
10 Rui Poças
2.1. Export quality measure
The general meaning of quality, can be seen as conformance to requirements, the requirements may not fully represent customer expectations (Crosby, 1979). Drucker (1985) says that quality in a product or service is not what the supplier puts in, it is what the customer gets out and is willing to pay for.
In another view of quality, Walton and Deming (1988) concentrate on the efficient production of the quality that the market expects. Linking quality and management, they say that costs go down while productivity goes up, as improvement of quality is accomplished by better management of design, engineering, testing and by improvement of processes.
According to Vandenbussche (2014), the measure of quality is a difficult task given that quality is an unobserved product characteristic. However, it is assumed that consumers care about price, relative to quality, when choosing between products and quality can be defined as any tangible or intangible attribute of a good that increases all consumers’ valuation of it (Hallak and Schott, 2011).
Gervais (2015) said that if the firm invests in an expensive technology and incurs relatively high production costs, consumers classify its output as high quality and as a result, the firm obtains a favourable demand shift and can sell relatively large number of units at a given price.
The quality of traded goods receives less attention than it deserves. In 2006 the global exports of goods and services was 11627,5 billion US dollars at the 2000 constant price, which is 4.6 times of that in 1980 at 2520.2 billion US dollars, and 2.8 times of that in 1990 at 4138.9 billion US dollars, giving quality great influence in this evolution. (Zhu et al. 2010).
Henn, Papageorgiou and Spatafora (2013) achieved some relevant conclusions about the importance of quality on exports. They argued that within any given product line, quality converges both conditionally and unconditionally to the world frontier and also that increases to institutional quality and human capital are associated with faster quality upgrading and, in turn, faster growth in quality is associated with a more rapid output growth. The concepts of quality and sophistication are quite different and its upgrade should be viewed as complementary.
Prices contain information about differences in product quality and contain valuable information to refine our understanding of the causes of trade. They provide evidence about the
University of Minho 11
extent of vertical specialisation and quality heterogeneity within sectors and across countries. (Johnson, 2012).
To determine the products quality, a simple calculation will be used: the total price of a product exports (in thousands of dollars) over the exported quantity for the same product (in tons), widely used on the export literature as unit value:
𝑢 = 𝑉 𝑄
It has become common to measure the quality of exports using their unit value (UV) and is also frequently used to measure quality in empirical research. Nonetheless, this measure has been the subject of several criticisms, mainly due to the determination of their components. For instance, prices might not follow quality closely, if goods are differentiated not only by quality but also by other factors (e.g., due to horizontal product differentiation). Also export prices might reflect international trade costs (Szcygielski and Grabowski, 2012).
Feenstra and Romalis (2014) claim that the unit values of internationally traded goods are heavily influenced by quality. The observed differences in export unit values are attributed predominantly to quality, with very small remaining difference in quality-adjusted export prices and they also find a greater preference for quality in richer countries. Once again the prices of the unit values are related with quality and many authors use this proxy stating to it as the exports quality. Models with quality choice by heterogeneous firms include Gervias (2010) and Mandel (2010).
Hallak and Schott (2011) argue that consumers are assumed to care about the price relative to quality in choosing among products, but that two countries with the same export prices but different global trade balances must have products with different levels of quality, suggesting that among countries with identical export prices, the country with the higher trade balance is revealed to possess higher product quality.
Unit values increase systematically with distance, and tend to be higher in shipments to richer nations - Bastos and Silva (2010) - and within products the unit values tend to increase with the size of the destination market. To estimate the drivers of export unit values they estimate a linear regression of the unit value prices with econometric methods and the results converge to the Baldwin and Harrigan (2011) findings based on product-country data relating to distance unit value differences.
12 Rui Poças
The average unit value of exports is positively related to distance, Baldwin and Harrigan (2011) assume that consumers care about quality and firms’ heterogeneity in productivity shows up in heterogeneous quality in a specific way. The most competitive firms’ charge the highest market prices and the most expensive products seem to be sold to the most distant markets.
Some authors’ attempt to find a more consensual and efficient method for the quality measurement like Hallak and Schott (2011) or Henn, Papageorgiou and Spatafora (2013), however, these new methods are still not sufficiently tested. The same happens with other alternative quality measurement, fairly appreciated, as the Khandelwal (2010) approach and more recently the Vandenbussche (2014) through a new quality metric method.
Khandelwal (2010) proxies’ quality by a variety-fixed effect to capture the time-invariant part of quality combined with time-fixed effect to account for the variation of quality over time, arguing that he has a model where quality can only increase as a result of marginal cost and therefore he does not need to disentangle quality from marginal cost since both always move in the same direction and that, conditioning on price, products with a larger market share, must have a higher quality.
Quality ladders are useful since they give information about the extent of product differentiation in a particular product market. A short quality ladder implies that all products are close substitutes and there is not much possibility for differentiation, while a longer quality ladder suggests that consumers appreciate product differentiation and are willing to pay for it. (Vandenbussche, 2014).
Regardless some valuable alternative approaches for the export quality measure, they are not considered the most appropriate for this research, taking into account the size of the database and the flexibility to work with the data from the two measures. Thus, unit value will be used for quality proxy, presupposing that it will be the most suitable for this research rather than others.
University of Minho 13
2.2. Export sophistication measure
In common language, the term sophistication is associated with complexity, development, progression or advancement. Concerning international trade, export sophistication is a relatively recent concept that, as mentioned above, corresponds to the value differences between products in different categories, as Schott (2004) says is an across-product classification.
Following Jesus et al. (2012), the products complexity is related with the income level of the countries, the high-income countries being the major exporters of more complex products. The authors explain that product complexity refers to the ubiquity of a product, that is, the number of countries that export the product with comparative advantage. Hidalgo et al. (2007) also said that economies grow by upgrading the products they produce as a process of learning how to produce more complex products. They argue that the varieties and quality ladders models assume a continuum of products, so there is always a slightly more advanced product that countries can move to, abstracting away similarities between products when thinking about structural transformation and growth.
Returning to Lall, Weiss and Zhang’s (2006) work, they found no statistically discernible relationship between export growth rates and sophistication. They claim that a rise in product sophistication may be desirable in terms of entering higher value processes and products, but that this applies within given activities or products and so, when considered across-products, there is no effect of a rise in sophistication on export growth.
Could this fact really be true? And if so, what drives some countries to expand the range of their exports towards more sophisticated goods and yet specialise in low-quality varieties? (Hausmann, Hwang and Rodrik, 2007).
Developing this research question, Sutton and Trefler (2011) found that between 1980 and 2005, low-income countries had moved into producing more sophisticated products, producing, however, low-quality or low-end products within these industries and, as a result, this diversification has not led to a big boost in the per capita GDP. They argue that as the country advances into the production of higher-ranked products, the rise in wage causes its effective cost level to rise, and its global market share in this industry to fall.
Rodrik (2006) implicitly assumed that low-quality high-category goods are better for economic growth than high-quality low-category goods. In their study on China’s exports
14 Rui Poças
sophistication, he argued that China has ended up with an export basket that is significantly more sophisticated than what would be normally expected, having government policies helped nurture domestic capabilities in consumer electronics and other advanced areas that would most likely not have developed in their absence. Kumakura (2007) identifies several problems about the export sophistication index employed in Rodrik’s work, developed in Hausmann, Hwang and Rodrik (2007), arguing that this index has several technical and other weaknesses that can impart an inappropriate policy implication because the value of this index is influenced heavily by factors unrelated to technology and policy and is not appropriate when it is used to assess the relationship between export structure and economic growth.
Following Jesus et al. (2013) the key factor underlying the intriguing China’s fast development during the last 50 years is its ability to master and accumulate new and more complex capabilities, reflected in the increase in diversification and sophistication of its export basket.
In a study about Sub-Saharan Africa countries, relating the sophistication and the diversification, Cabral and Veiga (2010) present some political and economic factors that determine the success of these strategies for this group of countries. Using separate regressions for each measure, they find a positive correlation between the sophistication and diversification for the success of the countries development variables including growth stability, infant mortality and life expectancy. Relating the GDP growth, the authors found a positive relation between exports diversification and exports sophistication but this relationship was not robust. Zhu et al. (2010) suggest that the export sophistication of countries is enhanced by capital intensity and engagement in knowledge creation and transfer via investment in education, R&D, foreign direct investment and imports.
“It is essential for the improvement of a nation’s welfare, as observations show that in a longer perspective the level of economic development is related to the degree of export sophistication. The speed of structural transformation depends on the distance in the product space between the potential export goods and the existing export goods with revealed comparative advantage.” (Vitola and Davidsons, 2008).
Hausmann, Hwang and Rodrik (2007) constructed an index of the “income level of a country’s exports”, and showed that it predicts subsequent economic growth. For that, they
University of Minho 15
developed a model to find a function of the productivity level associated with a country’s export basket, nominated as EXPY, equals:
𝐸𝑋𝑃𝑌𝑖 = ∑ (𝑥𝑖𝑗
𝑋𝑖) 𝑃𝑅𝑂𝐷𝑌𝑙
𝑙
Determinate through an index they called PRODY that it´s a weighted average of the per capita GDP’s (GDPPC) of countries exporting a given product, and representing the income level associated with that product, equals:
𝑃𝑅𝑂𝐷𝑌𝑘 = ∑ (𝑥𝑗𝑘/𝑋𝑗) ∑ (𝑥𝑗 𝑗𝑘/𝑋𝑗)
𝑌𝑗
𝑗
These formulas were the basis for this work. They allowed us to calculate the income level of the products that may be greater, even if its manufacturing level is lower, for example, it can yield more to produce an Agricola good than a technological one. To better understand the concrete results of this work, we have to expand the meaning of these formulas.
At the product level, by calculating the PRODY, relevant information was obtained individually, for each category of products with higher income levels, i.e. indicate what the countries should or not produce. Being however an average total set of all the countries, which means that it may not be true for a specific country to produce some product with a higher global income, meaning that each country should always take into account all the specific variables of each product as well as the variables of their own country’s specific conditions such as, political factors, export barriers and production conditions for these products among others.
On the other hand, at the country level (using the EXPY), the results show the level of productivity of a country's exports basket which means, in other words, that it reveals an analysis of its international trade, the exports evaluation of each country individually. With this information, a country can observe where it can improve, what it is producing and exporting with lower productivity and obtain some positive and negative historical examples from other countries.
As Minondo (2010) discusses, a limitation of the PRODY, and hence the EXPY index, is that it does not correct the differences in quality within a product category, for example, using
16 Rui Poças
exports’ unit value as a proxy. This author uses three quality ranges, for each commodity, based on the unit values of the countries that export that commodity, low quality, medium quality and high quality and they show, that if products are distinguished by its quality level there is no longer a robust relationship between specialising in products associated with higher productivity levels and faster growth.
The aforementioned author, argues that their alternative economic mechanism is related to a country’s quality upgrading frontier and shows that, countries that start producing low-quality products grow faster than countries producing closer to the low-quality frontier, and this convergence process occurs because countries specialised in the low-quality ranges have more room to improve productivity than those specialised in the high-quality ranges.
Using a similar methodology of this work for the sophistication measure of exports, PRODY for the products income and the EXPY for countries productivity, detailed in chapter 3, several authors presented many significant conclusions about a country’s sophistication as Cabral and Veiga (2010). These formulas allow us to analyse a single country’s sophistication like Hausmann and Klinger (2007) and (2009) made for Chile and for Ecuador with implications for this country’s structural transformation.
Jarreau and Poncet (2012) find evidence in support of regions specialising in more sophisticated goods subsequently grow faster in regions from China. For China and Asia studies, these formulas following Hausmann, Hwang and Rodrik (2007) work, originated several analyses like Thorbecke and Pai (2015) and Schott (2008) that question China’s ladder sophistication. Schott (2008) also questions if the price of a developing country’s export reflects its ability to produce a given level of quality, or if that country’s quality is a weighted average of inputs potentially sourced from developed economies.
Jarreau and Poncet (2012) confirm Hausmann, Hwang and Rodrik (2007) prediction that regions that specialise in more sophisticated goods subsequently grow faster stating that there is a substantial variation in export sophistication controlling for the level of development, and that this difference in turn matters for growth but they also found that growth gains from improved technological capabilities only occur when these capabilities are developed by domestic-owned firms and embedded in ordinary trade.
China’s sophistication has been a well-studied topic, the recent studies found that China is exporting highly sophisticated goods that are not comparable with its income level. Xu (2010) have questioned this fact arguing that product quality has not been fully accounted for in this
University of Minho 17
observation, causing an overestimation of the sophistication of China’s exports. This author also reflects on the average income used in the sophistication measurement causing an underestimation of China’s capability of exporting sophisticated goods.
This sophistication proxy for services was used by Mishra, Lundstrom and Anand (2012) which positively related the association between economic growth and the sophistication of services on exports. They argue that including services in growth considerations does not imply neglecting manufacturing exports and its benefits but that services can be an additional channel for promoting high growth.
Despite some author’s individual analyses, this study does not focus on a specific country but rather on the overall performance of many countries being a global survey to assess the correlation between exports sophistication and quality on the countries development.
University of Minho 19
3. Research design
This chapter features the type of research and methodology. The data collection is presented, the calculations explained and the method that was used in this work, showing that this research aims to contribute to the international trade theories through a study at a global level by analysing the exports quality and sophistication from the countries worldwide.
3.1. Type of research
According to Arnal, Rincón and Latorre (1992) the term science is associated with a rigorous, methodical and systematic knowledge form, that seeks to optimise the available information regarding the problems of theoretical and/or practice origin, whose primary function is the understanding, explanation, prediction and control of the events.
The essential purpose of this research is to increase personal and scientific knowledge on the topic. To this end, essentially quantitative research was conducted, although with qualitative analysis on the results.
The research type is descriptive, relating the phenomena as they exist, identifying variables and inventorying facts and using statistical techniques for summarising the information, and also a correlational research, relating the variables effects, assessing interactions and differentiating groups (Barañano, 2008).
3.2. Details of data
The first step accomplished, before the collecting of data, was to investigate all the formulas used on the proxy for the sophistication and for the quality, in order to assess their feasibility and verify all the necessary requirements for its determination and aiming to find all the necessary data required for the next stage of the data collection.
The data was collected directly from online databases, downloading the files, one by one, mainly through the International Trade Centre (ITC), exported in Microsoft Office Excel spreadsheet format. It was necessary to export the files with the export value and the unit value data of 6049 product categories, totalling more than 12.000 downloads. These products correspond at the 6-digit level of the Harmonized System, the most significant classification system for the products, using the latest revision (HS Revision 2012).
20 Rui Poças
The Harmonized System (HS) is an international nomenclature defined by the World Customs Organisation (WCO) for the products classification. It allows participating countries to classify traded goods on a common basis for customs purposes. At the international level, the Harmonized System for classifying goods is a six-digit code system.
The HS comprises presently more than 6000 article/product descriptions, on the set of all the revisions, that appear as headings and subheadings, arranged in 96 chapters of product categories, and more 3 special chapters wherein only one is utilised in this work (99 - Commodities not elsewhere specified), on a total of 97 chapters of products categories, the other two special chapters being excluded (Chapter 77 is reserved for future international use only and chapter 98 comprises special classification provisions).
The six digits of a product code can be interpreted by groups of two digits. The first two digits (HS-2) identify the chapter the good is classified in, e.g. “09 = Coffee, tea, mate and spices”. The next two digits (HS-4) identify groupings within that chapter, e.g. “0902 = Tea, whether or not flavoured”. The next two digits (HS-6) are even more specific, e.g. “090210 = Green tea (not fermented)” (International Trade Centre (ITC)).
All the products into the HS system can be classified by one logical interpretation according to their form and function, following also an increasing order of complexity, being ordered progressively by their characteristics, following the general rules of interpretation of the internationally standardised system of names and numbers to classify traded products developed by the World Customs Organization (WCO). These rules apply to all products. Any product for which there is no current classification can be listed under “Other” classification.
As explained above, for calculating the exports sophistication and quality the HS-6 at the 6 digits’ level was used, working with 6049 different products, a disaggregated data.
The population of this research was composed by 217 countries. It was decided to have a large number of countries because the author considered that being a quantitative analysis, even if it takes some more time, it would be positive to include almost all the existing countries in the globe. All the countries belong to The World Factbook of the Central Intelligence Agency (CIA) of the United States online database.
Finally, the search is performed for 14 years (from 2001 to 2014), using all the available years in the ITC, which gives a wide and current time period, giving value to the research and an advantage over less current studies.
University of Minho 21
The other variables included on this research were exported through the World Bank’s World Development Indicators (WDI), except the variable “Mean years of schooling” exported through the International Human Development Indicators from the United Nations Development Programme.
3.3. Research method
After the data collection, Microsoft Office Access was used to aggregate all the files to work with one single file with all the required data. This program made it possible to do the calculations with all the necessary data. The formulas for the exports sophistication were as aforementioned, developed by Hausmann, Hwang and Rodrik (2007):
𝑃𝑅𝑂𝐷𝑌𝑘= ∑ (𝑥𝑖𝑘/𝑋𝑖) ∑ (𝑥𝑗 𝑖𝑘/𝑋𝑖)
𝑌𝑖
𝑖
The Sum of i countries exporting k products, of the division of the numerator, that is the weight of the country i to export k on the total exports on the denominator, which is the Sum of the weight of all countries exporting k, multiplied by Yi the per capita GDP of the country i.
Having the PRODY calculation for the 6049 products it was possible to calculate the country’s EXPY using the formula:
𝐸𝑋𝑃𝑌𝑖 = ∑ (
𝑥𝑖𝑘 𝑋𝑖
) 𝑃𝑅𝑂𝐷𝑌𝑘 𝑘
The Sum of k products, of the division of the weight of the product k on the country i on the total of its exports, multiplied by the PRODY of k.
On the quality side, a simple mean was used of the unit value by the country i on the year j equals:
___ 𝑈𝑉𝑖𝑗
After these calculations, we have the sophistication and the quality variables aggregated for the group of 217 countries for the 14 years.
22 Rui Poças
During the research, great limitations of the quality measure by the unit values were found. Being the unit value the price of different products exported by a country, the variable will not be a good measure of quality, only representing the type of products (with high or low prices) of the country’s exports basket, for example a country that exports mainly expensive products like diamonds will have high unit values but does not mean that this country is exporting with high quality.
Attempting to solve these imitations, the author developed a new quality measure named QUALY based on a unit value ratio through the formula:
𝑄𝑈𝐴𝐿𝑌 = ∑𝑢𝑣𝑖𝑘 𝑢𝑣 ̅̅̅̅𝑘 . 𝑥𝑖𝑘 𝑋𝑖 𝑘 𝑥𝑖𝑘
𝑋𝑖 = weight of the product k on the country i total exports
𝑢𝑣𝑖𝑘
𝑢𝑣
̅̅̅̅𝑘 = quality ratio of the country i on the product k
𝑢𝑣𝑖𝑘 = unit value of the country i on the product k
𝑢𝑣
̅̅̅̅𝑘 = unit value mean of the product k equals:
∑ 𝑢𝑣𝑖𝑘
𝑥𝑖𝑘 𝑋𝑘 𝑖
𝑥𝑖𝑘
𝑋𝑘 = weight of the country i on the product k total exports
𝑥𝑖𝑘 = exported value of the country i on the product k
𝑋𝑘 = total export value of the product k
This new variable, the QUALY, was added to the model. However, it is only a comparative variable to observe the differences, the unit value remaining the main quality indicator of this work although its’ observed limitations.
Aiming to assess the relevance of the measures for the country’s development, some relevant and appropriate variables were added to complement the econometric model. The variables are economic indicators of the countries development and the baseline model follow the economic growth model of Aisen and Veiga (2013), some additional explanatory variables
University of Minho 23
common to other economic development regressions found in the literature were added (see table 8 in appendices). The variables included in the econometric model are the following:
• Per capita GDP (constant 2005 US$) (GDPPC): GDP per capita is gross domestic product divided by midyear population. GDP is the sum of gross value added by all resident producers in the economy plus any product taxes and minus any subsidies not included in the value of the products.
• General government final consumption expenditure (% of GDP) (GOV): General government final consumption expenditure (formerly general government consumption) includes all government current expenditures for purchases of goods and services (including compensation of employees). It also includes most expenditures on national defence and security, but excludes government military expenditures that are part of government capital formation. General government usually refers to local, regional and central governments. • Expenditure on education as percentage of total government expenditure (%)
(EDUC): General government expenditure on education (current, capital, and transfers) is expressed as a percentage of total general government expenditure on all sectors (including health, education, social services, etc.). It includes expenditure funded by transfers from international sources to government. • Gross capital formation (% of GDP) (INVEST): Gross domestic product (GDP)
from the expenditure side is made up of household final consumption expenditure, general government final consumption expenditure, gross capital formation (private and public investment in fixed assets, changes in inventories, and net acquisitions of valuables), and net exports (exports minus imports) of goods and services. Such expenditures are recorded in purchaser prices and include net taxes on products.
• Inflation, GDP deflator (annual %) (INFL): Inflation as measured by the annual growth rate of the GDP implicit deflator shows the rate of price change in the economy as a whole. The GDP implicit deflator is the ratio of GDP in current local currency to GDP in constant local currency.
• Population growth (annual %) (POPG): Annual population growth rate for year t is the exponential rate of growth of midyear population from year t-1 to t, expressed as a percentage.
24 Rui Poças
• Trade (% of GDP) (TRADE): Trade is the sum of exports and imports of goods and services measured as a share of gross domestic product.
• Labour force (total) (LABOUR): Total labour force comprises people ages 15 and older who meet the International Labour Organization definition of the economically active population: all people who supply labour for the production of goods and services during a specified period.
• Mean years of schooling (of adults) (years) (AVERAGE_EDUC): Average number of years of education received by people ages 25 and older, converted from education attainment levels using official durations of each level.
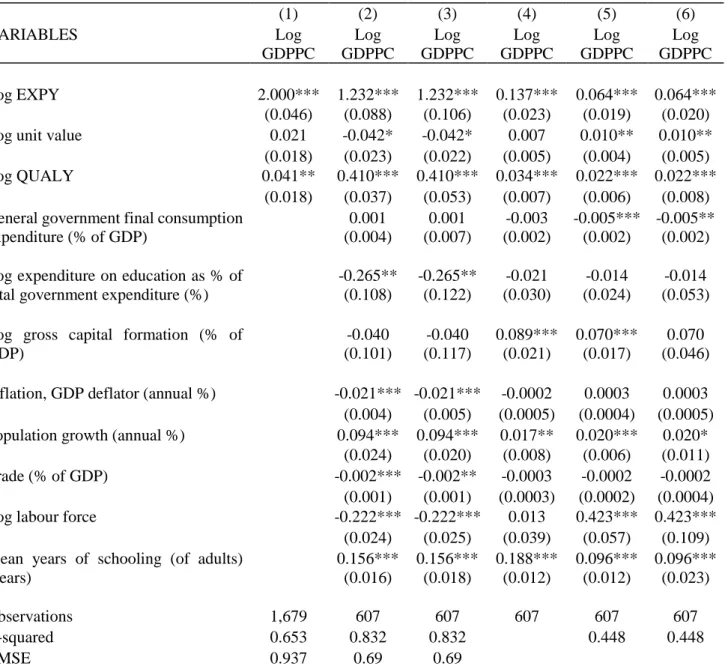
The econometric model was developed to explain the countries development through the dependent variable GDPPC, being the exports sophistication (EXPY) and the exports quality (Unit value and QUALY) and the remaining economic indicators the explanatory variables through the model:
EQUATION 1: 𝑙𝑛𝐺𝐷𝑃𝑃𝐶 = 𝛽0+ 𝛽1𝑙𝑛𝐸𝑋𝑃𝑌𝑖+ 𝛽2𝑙𝑛𝑈𝑉___
𝑖 + 𝛽3𝑙𝑛𝑄𝑈𝐴𝐿𝑌 + 𝛽4𝐺𝑂𝑉 +
𝛽5𝑙𝑛𝐸𝐷𝑈𝐶 + 𝛽6𝑙𝑛𝐼𝑁𝑉𝐸𝑆𝑇 + 𝛽7𝐼𝑁𝐹𝐿 + 𝛽8𝑃𝑂𝑃𝐺 + 𝛽9𝑇𝑅𝐴𝐷𝐸 + 𝛽10𝑙𝑛𝐿𝐴𝐵𝑂𝑅 + 𝛽11𝐴𝑉𝐸𝑅𝐴𝐺𝐸_𝐸𝐷𝑈𝐶 + 𝑢𝑖
To compare the effects with the Aisen and Veiga (2013) model of economic growth the second regression was created by changing the dependent variable to the growth of the GDPPC, used on the authors model, enabling comparisons between the results and providing additional information concerning the two different regressions, given by the general form:
EQUATION 2: 𝑙𝑛𝐺𝐷𝑃𝑃𝐶𝑔𝑟𝑜𝑤𝑡ℎ = 𝛽0 + 𝛽1𝑙𝑛𝐸𝑋𝑃𝑌𝑖+ 𝛽2𝑙𝑛𝑈𝑉___
𝑖 + 𝛽3𝑙𝑛𝑄𝑈𝐴𝐿𝑌 +
𝛽4𝐺𝑂𝑉 + 𝛽5𝑙𝑛𝐸𝐷𝑈𝐶 + 𝛽6𝑙𝑛𝐼𝑁𝑉𝐸𝑆𝑇 + 𝛽7𝐼𝑁𝐹𝐿 + 𝛽8𝑃𝑂𝑃𝐺 + 𝛽9𝑇𝑅𝐴𝐷𝐸 + 𝛽10𝑙𝑛𝐿𝐴𝐵𝑂𝑅 + 𝛽11𝐴𝑉𝐸𝑅𝐴𝐺𝐸_𝐸𝐷𝑈𝐶 + 𝑢𝑖
In both models ‘ui’ is a white noise error term. These regressions and data analysis are
made with the help of the statistical software program STATA, being all the data indicators exported to the integrated statistics program to be analysed. It is expected to accomplish the desired results to reply to the initial research questions, analysing the data in detail in chapter 4 of data analyses and results.
University of Minho 25
3.4. Econometric methods
Econometrics is based upon the development of statistical methods for estimating economic relationships, testing economic theories, and evaluating and implementing business policy and to predict economic time series. (Wooldridge, 2004).
Given a random sample, the method of ordinary least squares is used to estimate the slope and intercept parameters in the population model. To attain the desired results, the OLS model seems appropriate because it provides the necessary correlation results to reply to the starting research questions.
The name “ordinary least squares” comes from the fact that these estimates minimise the sum of squared residuals. With OLS, it possible to derive unbiasedness, consistency, and other important statistical properties relatively easily. OLS is appropriate for estimating the parameters appearing in the conditional mean function.
Two important issues in applied economics are understanding how change the units of measurement of the dependent and/or independent variables affects OLS estimates and knowing how to incorporate popular functional forms used in economics into regression analysis. OLS estimates change in entirely expected ways when the units of measurement of the dependent and independent variables change.
The mechanics of simple regression do not depend on how y and x are defined, the interpretation of the coefficients does depend on their definitions. For successful empirical work, it is much more important to become proficient at interpreting coefficients than to become efficient at computing formulas.
Multiple regression analysis is more amenable to ceteris paribus analysis because it allows us to explicitly control for many other factors that simultaneously affect the dependent variable. This is important for testing economic theories because multiple regression models can accommodate many explanatory variables that may be correlated.
The multiple regression model allows us to effectively hold other factors fixed while examining the effects of a particular variable on the dependent variable. It explicitly allows the independent variables to be correlated. Although the model is linear in its parameters, it can be used to model nonlinear relationships by appropriately choosing the dependent and independent variables.
26 Rui Poças
The method of ordinary least squares is easily applied to estimate the multiple regression model. Each slope estimate measures the partial effect of the corresponding independent variable on the dependent variable, holding all other independent variables fixed.
The regression analysis is appropriate for the necessary correlations of this study, detailed in the next chapter, to analyse the statistical influence and relevance of the exports quality and sophistication, as explanatory variables of the country’s production and development.
University of Minho 27
4.
Data analyses and results
With no surprise, the countries that appear on the top list with the highest sophistication indices (EXPY) are also countries at the top of the world development and/or economic power (see the full list in the table 6 in appendices).
Looking into the ranking top 5, it has Luxembourg, Ireland, Switzerland, Finland and Andorra, which are recognised for their high development. Therefore, it’s not surprising that they also appear leading the sophistication ranking, revealing an association between their good export practices and their development.
The EXPY value means the productivity level associated with the country’s export basket, the country’s sophistication, so the products included on the country’s export basket will influence all the EXPY results. Accordingly, it’s expected that countries like Luxembourg and Ireland, the highest ranked countries, are exporting products with a higher income level associated. Other reasons related with these results are for example some fiscal advantages of these countries and also their high GDPPC being the Luxembourg the country with the highest value in this indicator in the sample.
The relevance of the country’s export basket also helps to explain some surprising ratings, as the USA ranked in 15th with a relatively low result of 16.508 (thousand dollars)
compared with their high development, being the country exporting some products with a lower associated income level. The EXPY mean value for all the countries is 9,174 (thousand dollars) and Portugal ascend in 35th position with a good result of 13,501 (thousand dollars) having
exported some goods with a high-income level. At the bottom of the ranking are countries like Nepal, Ethiopia or Papua New Guinea, with no surprise, being some of the world less developed countries and also with very low GDPPC.
In terms of quality (see table 7 in appendices), there are some surprising countries on the top of the list, like African countries such Angola or Namibia. This reason appears to relate the high prices of some products exported by these countries, such as minerals like precious stones, influencing the unit value results, distorting the quality measurement. This is a problem of the quality measurement through the unit value reflecting some high prices that are not related with quality but with the product characteristics like the unit value of gold. Consequently, countries that mainly export these type of extremely high value products rise
28 Rui Poças
fairly in the rank such as Myanmar, one of the poorest countries in the world, being the 55th on the quality rank.
Leading this proxy are the Netherlands and the Switzerland, the quality leaders, both countries being some of the best examples on development and richness. At the bottom of the list are Sao Tome and Principe and Gambia, not surprising, less developed countries. The results converge to Hausmann and Klinger (2006) and Feenstra and Romalis (2014) argument, that rich countries produce more challenging products.
In the following graph 1, are the obtained results for the products sophistication (PRODY). We can see that, although existing a small growing trend, there is no statistical correlation with the gradual increase of products by category. The products in the HS system are classified following an increasing order of complexity by their characteristics’, meaning that a stronger correlation was expected to exist and a much higher PRODY for the products in higher categories which does not exist.
These results are in disagreement with Hausmann, Hwang and Rodrik (2007) arguing that “items with low PRODY tend to be primary commodities”, in fact the graph shows that a higher level of complexity of the product, or a product with highest level of manufacturing, it is not associated with an increase in its income and primary products often have higher productivity levels.
It is possible to note, in table 5 (see appendices), the products with smallest and largest productivity level associated with the sophistication products database with 6049 products. It is true that at the bottom are primary products, but it is also true that at the top of the list are also some primary products in low categories like some food products as the “030615 Frozen Norway lobsters”, exported by countries with high GDPPC, or the product “030390 Frozen Livers and roes” being possible to observe that is not necessary to belong to a high complexity level to be a high productivity level product.
University of Minho 29
Graph 1 – Sophistication by product category (PRODY)
Source: Own computations. Data in US dollar thousands.
The product with the highest classification of the sophistication rank it’s the “590290 Tire cord fabric made of viscose rayon high tenacity yarns”, a product on the middle of the products categories number 59, this product being mainly exported by Luxembourg, the country with the highest GDPPC.
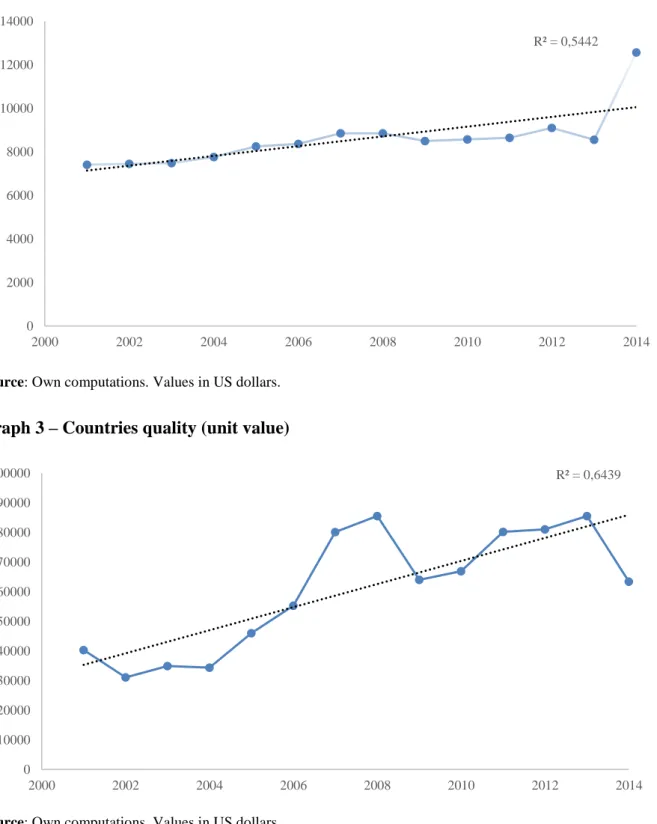
In the next graph 2, it’s possible to discern the countries sophistication during the 14 years, until 2014, as being progressively growing with a rising trend (R² = 0.5442), meaning a rise in the countries sophistication over this period.
The same happened with the quality for the same period (graph 3), although with a big change after 2008, during the world crisis, with a rising trend, bigger than the sophistication with a R² = 0.6439. We must see that the prices volatility is greater and more sensitive to economic changes, which explains some unit values and quality results.
R² = 0,0144 0 10000 20000 30000 40000 50000 60000 70000 0 1000 2000 3000 4000 5000 6000 P RO D Y (T h o u sa n d d o llar s) Product
30 Rui Poças
Graph 2 – Countries sophistication (EXPY)
Source: Own computations. Values in US dollars.
Graph 3 – Countries quality (unit value)
Source: Own computations. Values in US dollars.
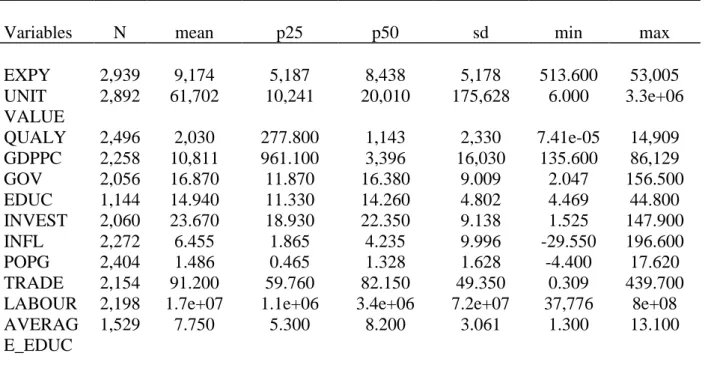
Table 2 reveals the description of all the variables of this research. Note that comma is the thousands separator and dot is the decimal separator. Starting with the EXPY and the unit value it is possible to observe the large differences between the two variables, being the relative values of the unit value considerably higher with a mean of $61,702 while the mean for the
R² = 0,5442 0 2000 4000 6000 8000 10000 12000 14000 2000 2002 2004 2006 2008 2010 2012 2014 R² = 0,6439 0 10000 20000 30000 40000 50000 60000 70000 80000 90000 100000 2000 2002 2004 2006 2008 2010 2012 2014