Contents lists available atScienceDirect
Human Movement Science
journal homepage:www.elsevier.com/locate/humovStability of pace and turn parameters of elite long-distance
swimmers
Jorge E. Morais
a,b,d,⁎, Tiago M. Barbosa
b,c,d, Henrique P. Neiva
a,d,
Daniel A. Marinho
a,daUniversity of Beira Interior, Convento de Sto. António, 6201-001 Covilhã, Portugal
bPolytechnic Institute of Bragança, Campus Sta. Apolónia, Apartado 1101, 5301-856 Bragança, Portugal
cNational Institute of Education, Nanyang Technological University, NIE5-03-32, 1 Nanyang Walk, Singapore 637616, Singapore
dResearch Centre in Sports, Health and Human Development, University of Beira Interior, Convento de Sto. António, 6201-001 Covilhã, Portugal
A R T I C L E I N F O Keywords: Freestyle Stroke mechanics Variation Performance A B S T R A C T
This study aimed to assess the stability of the performance, pace and turn parameters of elite long-distance male swimmers during an 800 m freestyle race. The sample was composed by 38 male swimmers, participating in the 800 m event at the 2016 LEN European Aquatic Championships (long course meter). The performance, and a set of pace and turn parameters were analyzed. A customized software was used to perform each race analysis. Swimmers spent 64.05 ± 0.50% and 35.95 ± 0.49% of the final race time in the clean swim and turns, re-spectively. In the pace parameters, the clean swim was the only one that did not differ between the first and second half of the race (1.63 ± 0.05 vs 1.62 ± 0.05 m·s−1), and in the turn parameters, the water break distance was also similar (5.13 ± 1.17 vs 5.06 ± 0.98 m). A sig-nificant and moderate-strong variation was verified for the performance (total race lap effect: p < 0.001, η2= 0.62), and a significant and moderate variation for the pace parameters (total race: p < 0.001, 0.15 ≤ η2≤ 0.33), and for the turn parameters (total race: p < 0.01, 0.15 ≤ η2≤ 0.33). Present data (pace and turn variation) shows that elite long-distance male swimmers do not maintain a similar pattern during an 800 m freestyle race. Future research is need to understand if this lack of pace and turn stability is the best way to enhance the perfor-mance, or if swimmers should be advised to control their pace and turn. Nevertheless, coaches are advised to help swimmers with feedback about their pace (i.e., controlling the intermediate 30 m) and turn performances (i.e., controlling the 5 m in and 15 m out), leading to a positive effect in their final race time.
1. Introduction
Major swimming events, such as World and European Championships, and Olympic Games, include short- (50 m and 100 m), middle- (200 m and 400 m), and long-distance races (800 m and 1500 m). This kind of characterization, tagging the type of race event according to distance, is based in the anaerobic and aerobic thresholds (Maglischo, 2012). Moreover, these are terms used on the deck by swimming fraternity to label and classify the difference race distances.
A swimming race is an event that is composed by four phases: the start, the clean swim, the turn(s), and the finish (Hay &
https://doi.org/10.1016/j.humov.2018.11.013
Received 27 September 2018; Received in revised form 20 November 2018; Accepted 26 November 2018
⁎Corresponding author at: Department of Sport Sciences, University of Beira Interior, Convento de Sto. António, 6201-001 Covilhã, Portugal. E-mail address:[email protected](J.E. Morais).
Human Movement Science 63 (2019) 108–119
0167-9457/ © 2018 Elsevier B.V. All rights reserved.
Guimaraes, 1983). The contribution of each phase of the race may differ according to the distance event. For example, the start has significant contribution in short-distance events, but few relevance for long races (Morais, Marinho, Arellano, & Barbosa, 2018). Throughout the last decades, several authors studied the stroke profile (during the clean swim phase) of elite swimmers in such major competitions (e.g.,Hellard et al., 2008; Wakayoshi, Nomura, Takahashi, Mutoh, & Miyashita, 1992). However, the majority of such studies only assessed short and/or middle-distance events (i.e., 50 m, 100 m and 200 m) (e.g.,Arellano, Brown, Cappaert, & Nelson,
1994; Hellard et al., 2008; Veiga & Roig, 2016).
Middle- and long-distance swimmers are characterized by having different kinematic patterns in comparison to their sprinters (short-distance) counterparts. For instance, in the 2009 World Championships it was verified that the stroke parameters differed between events. Long-distance male swimmers (800 m) presented a lower swim velocity, stroke frequency and stroke index, but a higher stroke length in comparison to sprinter swimmers (100 m) at the same event (Jesus et al., 2011). Nevertheless, there is no evidence about long-distance elite swimmers’ profile, with respect to their stroke mechanics, and performance. This lack of in-formation is even enhanced when it comes to their turning profile. Some studies analyzed the turning performance of elite swimmers, but only in short- and middle-distance events (e.g.,Arellano et al., 1994; Mason & Cossor, 2001; Veiga & Roig, 2016). It can not be found in the literature data about the turning profile (i.e., several phases of the turn) of long-distance swimmers.
Long-distance sports (i.e., endurance), are characterized by the ability to maintain a given movement or pattern during a large amount of time, adopting a somewhat constant pace throughout the most part of the race (e.g.,Foster, Schrager, Snyder, &
Thompson, 1994; Garland, 2005; McGibbon, Pyne, Shephard, & Thompson, 2018). The assessment of the stability (i.e., variation) is a
way to verify the maintenance of such movement or pattern, by verifying its hypothetical continuance (that may change through time) (Costa, Marinho, Bragada, Silva, & Barbosa, 2011; Pyne, Trewin, & Hopkins, 2004). One might claim that the ability to keep a given swimming velocity based on stroke mechanics (stroke frequency or stroke length), has a direct and positive effect on the swimmers’ performance (Lipinska, 2009). Only two studies assessed the kinematic pattern of elite long-distance swimmers (800 m)
(Lipinska, 2009; Lipinska, Allen, & Hopkins, 2016a). However, such analysis was made based in split times, where a bias in the
velocity measurement occur because of the turning phase. Moreover, in an 800 m race a swimmer performs 15 turns. It was estimated that an increase by one tenth of a second in each turn, would increase the performance of the total race time (Morais et al., 2018). This rationality could be verified if a swimmer presents a higher stability during the turn, i.e., being able to maintain such perfor-mance during a given amount of turns. We could not find in the literature data about the turning stability of long-distance elite swimmers, which may be of extreme importance in the final race time.
Hence, the aim of this study was to assess the stability of the performance, pace and turn parameters of long-distance elite swimmers during an 800 m freestyle race, at the European Championships. It was hypothesized that a moderate-high stability (i.e., low and no-significant variation: no-significant differences between pairwise) for the performance, pace and turn parameters would be verified.
2. Methods
2.1. Subjects
This analysis included the performances of all 38 male swimmers (4 heats and the final), participating in the 800 m event at the 2016 LEN European Aquatic Championships (London, LCM-long course meter, 50 m swimming pool). The swimmers’ performance, obtained in this event, corresponded to 92.79% of the world record time (452.12 s) at the time of the Championships.
2.2. Data collection
Each race analysis was performed using the videos provided by the organization. The video setup included high-definition cameras (f = 50 Hz), and the system provided real-time multi-angle recordings. Each lane (for each swimmer) had a pan-tilt-zoom camera (AXIS v5915, Lund, Sweden) tracking the swimmers. Hence, each camera (one per lane) followed along the swimming pool back and forth each swimmer. Two extra cameras (AXIS q1635, Lund, Sweden) were fixed at the ends of the swimming pool, enabling the single recording of the start and the turn(s). The starting lights were synchronized with the official timer, and visible by all cameras. An in-house customized software for swimming race analysis was used to perform each race. Such analysis was made by an expert analyst. To assess the agreement between measures, the Intra-Class Correlation Coefficient was used (ICC ranged between 0.987 and 0.999).
2.3. Performance parameters
The official website of the event (www.london2016.microplustiming.com) was used to retrieve the swimmers’ official times (i.e., the final race time and each 50 m split time).
2.4. Pace parameters
During the 800 m race, 16 laps were analyzed. The following pacing parameters (retrieved during the 15 m and the 35 m of each lap) were selected for analysis: (i) the clean swim (during the free swimming, i.e., without the effect of the wall push-off and the approaching to the wall); (ii) the stroke frequency (SF); (iii) the stroke length (SL), and; (iv) the stroke index (SI). The clean swim
(velocity, in m·s−1) was calculated during the middle 20 m stretch (considering the swimmer’s vertex, between the 15 m and the 35 m) as: v = d/t, where d is the distance and t the time swum. The SF (in cycles·min−1, and afterwards converted to Hz) was obtained by computing the period of the time spent to complete a full stroke cycle. The mean of all complete strokes, during the intermediate 20 m, was used for analysis. The SL was calculated as SL = v/SF (Craig & Pendergast, 1979), and the SI (in m2·s−1) as SI = v*SL (Costill et al., 1985).
2.5. Turn parameters
In each race, 15 turns were analyzed. In each turn, the following turning parameters were analyzed: (i) the 5 m in (the time between the last 5 m mark of each lap and the swimmer’s touch on the wall); (ii) the water break time (the time between the swimmer’s touch on the wall and the head water break); (iii) the water break distance (the distance between the wall and the swimmer’s head break); (iv) the 15 m out (the time between the touch on the wall and the 15 m mark) and; the total turn, that was selected as the turn main outcome (the time between the last 5 m of each lap and the 15 m of the following lap) (Morais et al., 2018). The distance used was calibrated based on the pool’s marks (i.e., 5 m and 15 m marks in the swim lanes).
2.6. Statistical procedures
The normality of the distribution was assessed with the Kolmogorov-Smirnov test, and the Levene test was used to analyze the homoscedasticity. The descriptive statistics included the mean ± 1 standard deviation (SD), the difference between pairwise (%), and the 95% of the confidence interval (95CI).
The differences between the first and second half of the race (i.e., T0-400 m vs T400-800 m), for all parameters assessed (per-formance, pace and turn), were verified with paired-samples t-test (p ≤ 0.05). The swimmers’ stability (per(per-formance, pace and turn) was assessed based in two approaches: (i) mean stability, and; (ii) normative stability (Costa et al., 2011; Morais et al., 2013). The mean stability included the mean ± 1SD. The data variation was assessed with the ANOVA repeated measures, followed by the Bonferroni post-hoc test to verify hypothetical significant differences between each pairwise (p < 0.05). The effect size index (eta square – η2) was computed and interpreted as: (i) without effect if 0 < η2≤ 0.04; (ii) minimum if 0.04 < η2≤ 0.25; (iii) moderate if 0.25 < η2≤ 0.64 and; (iv) strong if η2> 0.64. The Cohen’s d was also computed to verify the magnitude of the effect size: (i) small if d ≥ 0.2; (ii) moderate if d ≥ 0.5 and; (iii) large if d ≥ 0.8 (Cohen, 1988).
The normative stability was investigated with the Pearson’s correlation coefficient between each pairwise. As a rule of thumb, it was defined that the stability was: (i) very weak if r < 0.04; weak if 0.04 ≤ r < 0.16; moderate if 0.16 ≤ r < 0.49; high if 0.49 ≤ r < 0.81, and very high if 0.81 ≤ r < 1.0 (Costa et al., 2011).
3. Results
3.1. Mean stability (performance and pace)
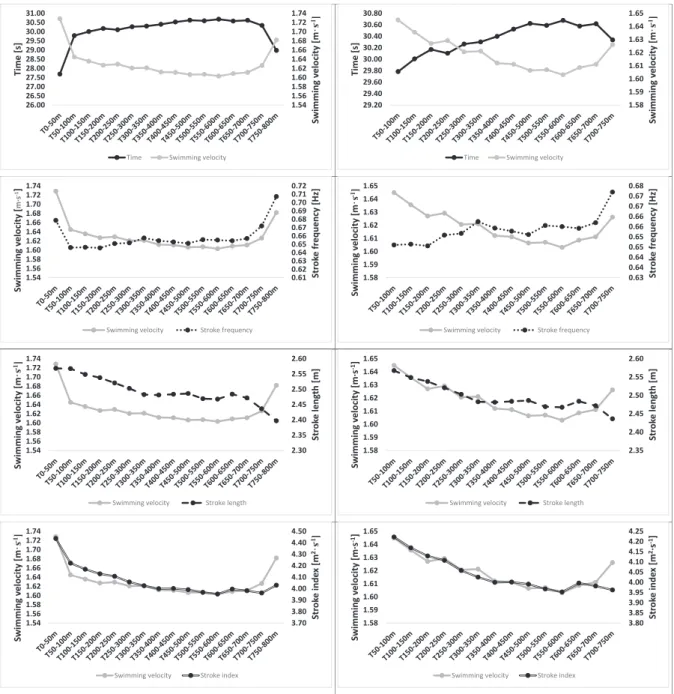
The swimmers spent 294.61 ± 9.15 s (CI: 291.46;297.75) executing the clean swim (i.e., pace parameters), which corresponded to 61.05% of the total race time.Table 1presents the descriptive data for the performance and pace parameters for the total race, first and second half of the race, and in each lap. Overall, it can be observed that the first half (T0-400 m) of the race was faster in comparison to the second (T400-800 m). The total race performance (i.e., time spent to cover the distance) decline between the first and the second half of the race (from 238.70 to 242.94 s). Moreover, the pace parameters presented the same trend (clean swim from 1.63 to 1.62 m·s−1, SL from 2.51 to 2.46 m and, SI from 4.11 to 3.98 m2·s−1) (Table 1andFig. 1). Removing the first and the last lap (T0-50 m: 27.68 ± 0.49 s and, T750-800 m: 28.97 ± 1.26 s, respectively), the second one was the fastest lap recorded (T50-100 m: 29.78 ± 0.63 s). This same lap presented the highest clean swim velocity (1.64 ± 0.04 m·s−1), SL (2.56 ± 0.22 m) and SI (4.21 ± 0.37 m2·s−1). The T550-600 m split was the slowest lap (30.67 ± 1.13 s), and also presented the slowest pace parameters for the clean swim (1.60 ± 0.06 m·s−1), SF (0.65 ± 0.07 Hz), and SI (3.94 ± 0.37 m2·s−1) (Table 1).
Table 2presents the data variation and the pairwise comparison between the highest and lowest difference. The lap performance
during the total race time (T0-800 m), race’s first half (T0-400 m), and second half (T400-800 m) presented a significant and mod-erate-strong variation (F = 60.22, p < 0.001, η2= 0.62; F = 301.12, p < 0.001, η2= 0.89; F = 82.75, p < 0.001, η2= 0.69, respectively). However, after deleting the first and/or last lap (i.e., total race: T0-50 m and T750-800 m; first half: T0-50 m; second half: T750-800 m), the variation decline (F = 8.14, p = 0.002, η2= 0.18; F = 21.58, p < 0.001, η2= 0.37; F = 5.47, p = 0.003, η2= 0.13, respectively). Overall, the pace parameters (i.e., clean swim, SF, SL, and SI) presented the same trend (before and after deleting such laps), but with a significant and without-moderate variation (Table 2). As far as the pairwise concerns, the magnitude of the difference (both highest and lowest), decline after deleting the first and/or last lap (i.e., total race: T0-50 m and T750-800 m; first half: T0-50 m; second half: T750-800 m). All lap times were significantly different (p < 0.05) when comparing the heat versus the final’s times, except the first and last lap. Same trend was verified for the pace parameters (clean swim, SF, SL and SI), except for the clean swim in T0-50 m, T50-100 m, and T750-800 m.
3.2. Mean stability (turn)
Table 1 Descriptive statistics (mean, one standard deviation and 95% confidence interval) for the performance, pace and turn parameters. Performance (s) Clean swim (m·s −1) SF (Hz) SL (m) SI (m2 ·s −1 ) Total turn (s) 5 m-in (s) Water break t. (s) Water break d. (m) 15 m-out (s) Total race Total race T800 m 481.62 ± 12.94 (477.36;485.87) 1.62 ± 0.04 (1.61;1.64) 0.66 ± 0.06 (0.64;0.68) 2.49 ± 0.20 (2.42;2.55) 4.05 ± 0.33 (3.94;4.16) Turn 1–15 11.57 ± 0.35 (11.45;11.69) 3.38 ± 0.12 (3.34;3.42) 2.17 ± 0.33 (2.06;2.29) 5.09 ± 0.99 (4.76:5.43) 8.19 ± 0.26 (8.10;8.28) Race first half Race first half T0-400 m 238.70 ± 5.98 (236.74;240.67) 1.63 ± 0.05 * (1.61;1.65) 0.65 ± 0.06 (0.63;0.67) 2.51 ± 0.21 (2.44;2.58) 4.11 ± 0.35 (3.99;4.23) Turn 1–8 11.51 ± 0.32 (11.40;11.62) 3.34 ± 0.11 (3.30;3.37) 2.23 ± 0.35 (2.11;2.35) 5.13 ± 1.17 # (4.74;5.53) 8.18 ± 0.24 (8.09;8.26) Race second half Race second half T400-800 m 242.94 ± 8.74 (240.07;245.82) 1.62 ± 0.05 * (1.60;1.64) 0.66 ± 0.06 (0.64;0.69) 2.46 ± 0.20 (2.39;2.53) 3.98 ± 0.35 (3.87;4.11) Turn 9–15 11.63 ± 0.44 (11.48;11.78) 3.42 ± 0.16 (3.37;3.47) 2.12 ± 0.33 (2.00;2.23) 5.06 ± 0.98 # (4.72;5.39) 8.21 ± 0.32 (8.10;8.31) Lap Turn T0-50 m 27.68 ± 0.49 (27.52;27.84) 1.73 ± 0.03 (1.71;1.74) 0.68 ± 0.07 (0.65;0.70) 2.57 ± 0.22 (2.49;2.65) 4.43 ± 0.36 (4.30;4.56) Turn 1 11.32 ± 0.22 (11.23;11.42) 3.23 ± 0.08 (3.10;3.27) 2.32 ± 0.38 (2.16;2.48) 5.87 ± 0.73 (5.56;6.18) 8.09 ± 0.18 (8.01;8.16) T50-100 m 29.78 ± 0.63 (29.57;29.99) 1.64 ± 0.04 (1.63;1.66) 0.65 ± 0.06 (0.62;0.67) (2.56 ± 0.22) (2.48;2.64) 4.21 ± 0.37 (4.08;4.34) Turn 2 11.52 ± 0.35 (11.37;11.67) 3.36 ± 0.13 (3.30;3.41) 2.11 ± 0.31 (1.98;2.24) 5.52 ± 0.76 (5.19;5.84) 8.16 ± 0.26 (8.05;8.27) T100-150 m 30.00 ± 0.78 (29.74;30.26) 1.63 ± 0.04 (1.62;1.65) 0.65 ± 0.06 (0.63;0.67) 2.55 ± 0.22 (2.47;2.62) 4.16 ± 0.38 (4.03;4.29) Turn 3 11.50 ± 0.35 (11.36;11.65) 3.32 ± 0.14 (3.26;3.38) 2.16 ± 0.35 (2.01;2.30) 5.57 ± 0.70 (5.27;5.86) 8.18 ± 0.25 (8.08;8.29) T150-200 m 30.16 ± 0.80 29.90;30.43) 1.62 ± 0.04 (1.61;1.64) 0.65 ± 0.06 (0.62;0.67) 2.54 ± 0.21 (2.46;2.61) 4.12 ± 0.35 (4.00;4.24) Turn 4 11.63 ± 0.43 (11.44;11.80) 3.41 ± 0.16 (3.34;3.47) 2.16 ± 0.39 (1.99;2.32) 5.45 ± 0.70 (5.15;5.75) 8.22 ± 0.30 (8.09;8.35) T200-250 m 30.10 ± 0.90 (29.80;30.39) 1.63 ± 0.05 (1.61;1.65) 0.65 ± 0.06 (0.63;0.67) 2.52 ± 0.21 (2.44;2.59) 4.10 ± 0.39 (3.96;4.23) Turn 5 11.58 ± 0.47 (11.39;11.78) 3.35 ± 0.16 (3.29;3.42) 2.15 ± 0.35 (2.00;2.30) 5.48 ± 0.67 (5.19;5.76) 8.23 ± 0.34 (8.09;8.38) T250-300 m 30.26 ± 0.90 (29.96;30.56) 1.62 ± 0.05 (1.60;1.63) 0.65 ± 0.06 (0.63;0.67) 2.50 ± 0.20 (2.43;2.57) 4.04 ± 0.36 (3.92;4.17) Turn 6 11.66 ± 0.43 (11.48;11.84) 3.41 ± 0.15 (3.35;3.48) 2.15 ± 0.35 (2.00;2.30) 5.42 ± 0.61 (5.16;5.67) 8.25 ± 0.32 (8.11;8.38) T300-350 m 30.30 ± 0.91 (30.00;30.60) 1.62 ± 0.05 (1.60;1.64) 0.66 ± 0.06 (0.64;0.68) 2.48 ± 0.21 (2.41;2.55) 4.02 ± 0.36 (3.90;4.14) Turn 7 11.63 ± 0.40 (11.46;11.80) 3.39 ± 0.15 (3.33;3.45) 2.12 ± 0.31 (1.99;2.25) 5.44 ± 0.68 (5.16;5.73) 8.24 ± 0.29 (8.12;8.36) T350-400 m 30.39 ± 0.89 (30.10;30.69) 1.61 ± 0.05 (1.59;1.63) 0.65 ± 0.06 (0.63;0.68) 2.48 ± 0.21 (2.41;2.55) 4.00 ± 0.35 (3.87;4.11) Turn 8 11.71 ± 0.38 (11.55;11.87) 3.45 ± 0.15 (3.38;3.51) 2.11 ± 0.32 (1.98;2.25) 5.39 ± 0.57 (5.15;5.63) 8.26 ± 0.27 (8.15;8.38) T400-450 m 30.52 ± 1.34 (30.08;30.96) 1.61 ± 0.06 (1.59;1.63) 0.65 ± 0.06 (0.63;0.67) 2.48 ± 0.20 (2.41;2.55) 3.99 ± 0.36 (3.86;4.11) Turn 9 11.63 ± 0.40 (11.46;11.80) 3.35 ± 0.16 (3.29;3.42) 2.09 ± 0.32 (1.96;2.23) 5.33 ± 0.65 (5.05;5.61) 8.28 ± 0.29 (8.16;8.40) T450-500 m 30.62 ± 1.09 (30.26;30.98) 1.60 ± 0.05 (1.59;1.62) 0.65 ± 0.06 (0.63;0.67) 2.48 ± 0.21 (2.41;2.55) 3.97 ± 0.34 (3.86;4.10) Turn 10 11.78 ± 0.42 (11.60;11.95) 3.48 ± 0.18 (3.40;3.55) 2.08 ± 0.37 (1.92;2.24) 5.32 ± 0.68 (5.03;5.60) 8.30 ± 0.29 (8.18;8.42) T500-550 m 30.58 ± 1.18 (30.19;30.97) 1.60 ± 0.06 (1.58;1.62) 0.66 ± 0.06 (0.63;0.68) 2.46 ± 0.21 (2.39;2.54) 3.95 ± 0.38 (3.82;4.08) Turn 11 11.71 ± 0.44 (11.53;11.90) 3.41 ± 0.17 (3.34;3.48) 2.12 ± 0.34 (1.97;2.26) 5.10 ± 1.28 (4.56;5.64) 8.30 ± 0.30 (8.18;8.43) T550-600 m 30.67 ± 1.13 (30.30;31.04) 1.60 ± 0.06 (1.58;1.62) 0.65 ± 0.07 (0.63;0.68) 2.47 ± 0.22 (2.39;2.54) 3.94 ± 0.37 3.81 ± 4.07) Turn 12 11.76 ± 0.37 (11.60;11.91) 3.47 ± 0.14 (3.41;3.53) 2.04 ± 0.36 (1.89;2.19) 4.93 ± 1.24 (4.41;5.46) 8.29 ± 0.27 (8.18;8.40) T600-650 m 30.57 ± 1.13 (30.20;30.94) 1.61 ± 0.06 (1.58;1.63) 0.65 ± 0.07 (0.63;0.68) 2.48 ± 0.26 (2.39;2.57) 3.98 ± 0.44 (3.82;4.14) Turn 13 11.70 ± 0.37 (11.55;11.86) 3.41 ± 0.15 (3.35;3.47) 2.09 ± 0.37 (1.93;2.24) 5.04 ± 1.25 (4.51;5.57) 8.29 ± 0.28 (8.17;8.41) T650-700 m 30.61 ± 1.10 (30.25;30.97) 1.61 ± 0.06 (1.59;1.63) 0.66 ± 0.07 (0.63;0.68) 2.47 ± 0.22 (2.39;2.54) 3.96 ± 0.36 (3.84;4.09) Turn 14 11.71 ± 0.33 (11.57;11.85) 3.47 ± 0.16 (3.41;3.54) 2.00 ± 0.37 (1.85;2.16) 4.90 ± 1.25 (4.38;5.43) 8.23 ± 0.21 (8.14;8.32) T700-750 m 30.33 ± 1.07 (29.98;30.68) 1.62 ± 0.06 (1.60;1.64) 0.67 ± 0.06 (0.65;0.69) 2.43 ± 0.21 (2.36;2.51) 3.95 ± 0.36 (3.82;4.07) Turn 15 11.48 ± 0.35 (11.33;11.63) 3.40 ± 0.16 (3.33;3.47) 2.00 ± 0.35 (1.85;2.15) 5.18 ± 0.71 (4.88;5.48) 8.07 ± 0.26 (7.96;8.19) T750-800 m 28.97 ± 1.26 (28.56;29.38) 1.68 ± 0.08 (1.65;1.70) 0.71 ± 0.08 (0.68;0.73) 2.39 ± 0.21 (2.32;2.46) 4.01 ± 0.37 (3.88;4.14) SF – stroke frequency; SL – stroke length; SI – stroke index; Water break t. – water break time; Water break d. – water break distance; *and #first and second half of the race (T0-400 m vs T400-800 m) no-significantly different (p > 0.05) for pace and turn, respectively.
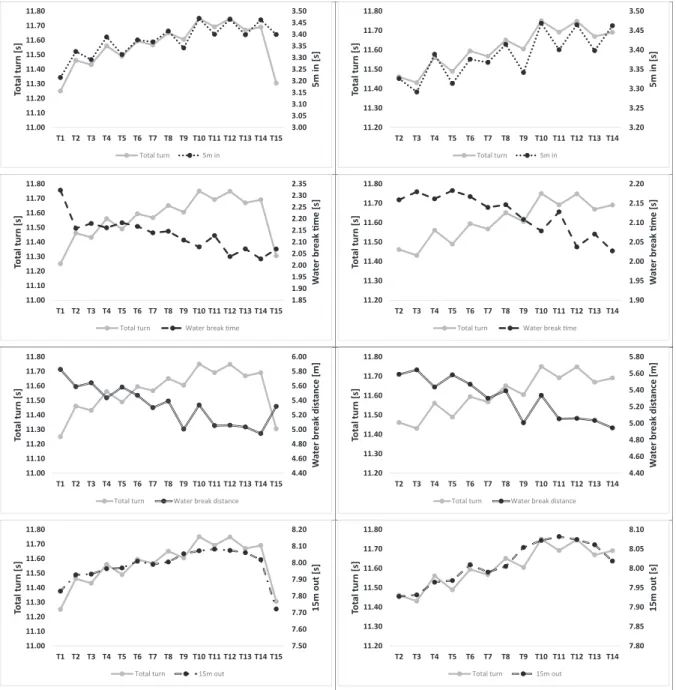
main outcome), corresponding to 35.95% of the total race time. On average, they spent 11.57 ± 0.35 s performing the total turn
(Table 1andFig. 2). Swimmers spent more time on performing total turn in the second half of the race (first half:11.51 ± 0.32 s,
second half: 11.63 ± 0.44 s). The same trend was verified for the 5 m in (first half, T0-400 m: 3.34 ± 0.11 s; second half, T400-800 m: 3.42 ± 0.16 s), and the 15 m out (first half, T0-400: 8.18 ± 0.24 s; second half, T400-TT400-800: 8.21 ± 0.32 s). The fastest total turn (besides the first one: 11.32 ± 0.22 s, and the last: 11.48 ± 0.35 s) occurred in the T100-150 m split (turn 3: 11.50 ± 0.35 s). The slowest was verified in the T450-500 m split (turn 10: 11.78 ± 0.42 s) (Table 1). Significant differences (p < 0.05) were found between the heats and the finals for the total turn and 15 m out, except in the first and last turn.
During the total race (T0-800 m), the 5 m-in presented the highest variation with a significant and moderate effect (F = 15.93, p < 0.001, η2= 0.31). After deleting turn 1 and 15, the total turn was the one presenting the highest variation (F = 12.46, p < 0.001, η2= 0.27). However, after splitting the total race into half’s, the total turn presented the highest variation in T0-400 m, including all turns and after deleting turn 8 (F = 30.21, p < 0.001, η2= 0.47; F = 16.03, p < 0.001, η2= 0.32, respectively). In T400-800 m, it was the 5 m-in presenting the highest variation in both situations (all turns included and after deleting turn 15)
(Table 2). 1.54 1.56 1.58 1.60 1.62 1.64 1.66 1.68 1.70 1.72 1.74 26.00 26.50 27.00 27.50 28.00 28.50 29.00 29.50 30.00 30.50 31.00 Swimming v elocity [m ·s -1] Time [s]
Time Swimming velocity
1.58 1.59 1.60 1.61 1.62 1.63 1.64 1.65 29.20 29.40 29.60 29.80 30.00 30.20 30.40 30.60 30.80 Swimming v elocity [m ·s -1] Time [s]
Time Swimming velocity
0.61 0.62 0.63 0.64 0.65 0.66 0.67 0.68 0.69 0.70 0.71 0.72 1.54 1.56 1.58 1.60 1.62 1.64 1.66 1.68 1.70 1.72 1.74 Str ok e fr equency [Hz] Swimming v elocity [ m·s -1]
Swimming velocity Stroke frequency
0.63 0.64 0.64 0.65 0.65 0.66 0.66 0.67 0.67 0.68 1.58 1.59 1.60 1.61 1.62 1.63 1.64 1.65 Str ok e fr equency [Hz] Swimming v elocity [m ·s -1]
Swimming velocity Stroke frequency
2.30 2.35 2.40 2.45 2.50 2.55 2.60 1.54 1.56 1.58 1.60 1.62 1.64 1.66 1.68 1.70 1.72 1.74 Str ok e leng th [m] Swimming v elo city [m ·s -1]
Swimming velocity Stroke length
2.35 2.40 2.45 2.50 2.55 2.60 1.58 1.59 1.60 1.61 1.62 1.63 1.64 1.65 Str ok e leng th [m] Swimming v elo city [m·s -1]
Swimming velocity Stroke length
3.70 3.80 3.90 4.00 4.10 4.20 4.30 4.40 4.50 1.54 1.56 1.58 1.60 1.62 1.64 1.66 1.68 1.70 1.72 1.74 Str ok e inde x [m 2·s -1] Swimming v elo city [m ·s -1]
Swimming velocity Stroke index
3.80 3.85 3.90 3.95 4.00 4.05 4.10 4.15 4.20 4.25 1.58 1.59 1.60 1.61 1.62 1.63 1.64 1.65 Str ok e inde x [m 2·s -1] Swimming v elocity [m·s -1]
Swimming velocity Stroke index
Fig. 1. Mean values for the lap time, swimming velocity, stroke frequency, stroke length and stroke index. Panels at the left side show the data for the total race (T0-800 m), panels at the right side show the data without the first (T0-50 m) and last (T750-800 m) lap; T – refers to time.
Table 2 Data variation and effect size of the performance, pace and turn parameters in the total race (T0-800 m), first half (T0-400 m), and second half (T400-800 m). The pairwise between the highest and lowest mean difference (pace – all laps included and deleting the first and last lap; turn – all turns included and deleting the first and last turn), is also presented. F ( #) p ( #) η2 ( #) Pairwise Pairwise ( #) Performance – total race (T0-800 m) T0-800 m 52576.43 (49482.09) < 0.001 (< 0.001) 0.99 (0.99) Lap performance (s) 60.22 (8.14) < 0.001 (0.002) 0.62 (0.18) H: P50 vs P600 (9.74%; p < 0.001; d = 3.42) L: P500 vs P700 (0.00%; p = 1.00; d = 1.09) H: P100 vs P600 (2.93%; p = 0.001; d = 0.98) L: P550 vs P700 (0.09%; p = 1.00; d = 0.03) Performance – race first half (T0-400 m) T0-400 m 60496.41 (53962.83) < 0.001 (< 0.001) 0.99 (0.99) Lap performance (s) 301.12 (21.58) < 0.001 (< 0.001) 0.89 (0.37) H: P50 vs P400 (8.91; p < 0.001; d = 3.75) L: P300 vs P350 (0.13%; p = 1.00; d = 0.04) H: P100 vs P400 (2.04%; p < 0.001; d = 0.80) L: P300 vs P350 (0.13%; p = 1.00; d = 0.04) Performance – race second half (T400-800 m) T400-800 m 28320.99 (28100.16) < 0.001 (< 0.001) 0.99 (0.99) Lap performance (s) 82.75 (5.47) < 0.001 (0.003) 0.69 (0.13) H: P600 vs P800 (5.86%; p < 0.001; d = 1.42) L: P500 vs P700 (0.00%; p = 1.00; d = 0.00) H: P600 vs P750 (1.12%, p = 0.002; d = 0.31) L: P500 vs P700 (0.00%; p = 1.00; d = 0.00) Pace – total race (T0-800 m) Clean swim (m·s −1 ) 30.30 (5.96) < 0.001 (0.005) 0.48 (0.15) H: P50 vs P600 (7.81%; p < 0.001; d = 2.55) L: P500 vs P550 (0.00%; p = 1.00; d = 0.05) H: P100 vs P600 (2.50%; p = 0.027; d = 0.78) L: P500 vs P550 (0.00%; p = 1.00; d = 0.00) Stroke frequency (Hz) 13.81 (3.21) < 0.001 (0.02) 0.29 (0.09) H: P200 vs P800 (8.45%; p < 0.001; d = 0.92) L: P100 vs P150 (0.00%; p = 1.00; d = 0.00) H: P200 vs P750 (2.98%; p = 0.041; d = 0.33) L: P300 vs P400 (0.00%; p = 1.00; d = 0.00) Stroke length (m) 14.88 (10.79) < 0.001 (< 0.001) 0.31 (0.25) H: P50 vs P800 (7.08%; p < 0.001; d = 0.81) L: P400 vs P500 (0.00%; p = 1.00; d = 0.00) H: P100 vs P750 (5.32%; p < 0.001; d = 0.62) L: P400 vs P500 (0.00%; p = 1.00; d = 0.00) Stroke index (m 2·s −1) 31.44 (16.03) < 0.001 (< 0.001) 0.49 (0.33) H: P50 vs P600 (12.40%; p < 0.001; d = 1.38) L: P550 vs P750 (0.25%; p = 1.00; d = 0.03) H: P100 vs P600 (6.83%; p = 0.041; d = 0.74) L: P550 vs P750 (0.25%; p = 1.00; d = 0.03) Pace – race first half (T0-400 m) Clean swim (m·s −1 ) 97.87 (11.81) < 0.001 (< 0.001) 0.75 (0.27) H: P50 vs P400 (7.45%; p < 0.001; d = 2.65) L: P300 vs P350 (0.00%; p = 1.00; d = 0.00) H: P100 vs P400 (1.86%; p < 0.001; d = 0.66) L: P300 vs P350 (0.00%; p = 1.00; d = 0.00) Stroke frequency (Hz) 11.42 (2.97) < 0.001 (0.046) 0.26 (0.08) H: P50 vs P200 (4.61%; p < 0.001; d = 0.46) L: P150 vs P200 (0.00%; p = 1.00; d = 0.00) H: P200 vs P350 (1.53%; p = 0.057; d = 0.17) L: P300 vs P400 (0.00%; p = 1.00; d = 0.00) Stroke length (m) 12.22 (13.29) < 0.001 (< 0.001) 0.28 (0.29) H: P50 vs P400 (3.62%; p = 0.013; d = 0.41) L: P350 vs P400 (0.00%; p = 1.00; d = 0.00) H: P100 vs P350 (3.62%; p = 0.001; d = 0.42) L: P350 vs P400 (0.00%; p = 1.00; d = 0.00) Stroke index (m 2·s −1) 63.76 (24.03) < 0.001 (< 0.001) 0.66 (0.42) H: P50 vs P400 (11.00%; p < 0.001; d = 1.27) L: P200 vs P250 (0.48%; p = 1.00; d = 0.05) H: P100 vs P150 (1.19%; p < 0.001; d = 0.13) L: P200 vs P250 (0.48%; p = 1.00; d = 0.05) Pace – race second half (T400-800 m) Clean swim (m·s −1 ) 39.53 (6.49) < 0.001 (< 0.001) 0.53 (0.16) H: P600 vs P800 (4.76%; p < 0.001; d = 1.13) L: P450 vs P700 (0.00%; p = 1.00; d = 0.00) H: P600 vs P750 (1.84%; p = 0.001; d = 0.50) L: P450 vs P700 (0.00%; p = 1.00; d = 0.00) Stroke frequency (Hz) 29.37 (7.12) < 0.001 (< 0.001) 0.46 (0.16) H: P500 vs P800 (8.45%; p < 0.001; d = 0.92) L: P550 vs P600 (0.00%; p = 1.00; d = 0.00) H: P500 vs P750 (2.98%; p = 0.002; d = 0.33) L: P550 vs P600 (0.00%; p = 1.00; d = 0.00) Stroke length (m) 7.72 (3.01) < 0.001 (0.037) 0.18 (0.08) H: P500 vs P800 (3.33%; p = 0.001; d = 0.40) L: P450 vs P650 (0.00%; p = 1.00; d = 0.00) H: P500 vs P750 (1.63%; p = 0.016; d = 0.20) L: P450 vs P650 (0.00%p = 1.00; d = 0.00) Stroke index (m 2·s −1) 1.63 (1.11) 0.175 (0.349) 0.04 (0.03) H: P750 vs P800 (1.73%; p = 0.766; d = 0.19) L: P550 vs P750 (0.25%; p = 1.00; d = 0.03) H: P450 vs P600 (1.26%; p = 0.836; d = 0.14) :P550 vs P750 (0.25%; p = 1.00; d = 0.03) Turn – total race (T0-800 m) Total turn (s) 9.47 (12.46) < 0.001 (< 0.001) 0.22 (0.27) H: Turn 1 vs Turn 10 (4.25%; p < 0.001; d = 1.36) L: Turn 4 vs Turn 7 (0.08%; p = 1.00; d = 0.03) H: Turn 3 vs Turn 10 (2.72%; p = 0.035; d = 0.80) L: Turn 4 vs Turn 7 (0.08%; p = 1.00; d = 0.03) 5 m-in (s) 15.93 (11.04) < 0.001 (< 0.001) 0.31 (0.24) H: Turn 1 vs Turn 10 (7.49%; p < 0.001; d = 1.78) L: Turn 13 vs Turn 15 (0.00%; p = 1.00; d = 0.16) H: Turn 3 vs Turn 10 (5.18%; p = 0.032; d = 1.07) L: Turn 12 vs Turn 14 (0.00%; p = 1.00; d = 0.00) (continued on next page )
Table 2 (continued ) F ( #) p ( #) η2 ( #) Pairwise Pairwise ( #) Water break time (s) 7.42 (4.88) < 0.001 (< 0.001) 0.18 (0.12) H: Turn 1 vs Turn 14 (14.49%; p < 0.001; d = 0.77) L: Turn 2 vs Turn 4 (0.00%; p = 1.00; d = 0.39) H: Turn 4 vs Turn 14 (6.76%; p = 0.035; d = 0.43) L: Turn 2 vs Turn 4 (0.00%; p = 1.00; d = 0.00) Water break dist. (m) 3.43 (2.67) 0.01 (0.037) 0.13 (0.10) H: Turn 1 vs Turn 15 (10.11%; p = 0.017; d = 0.60) L: Turn 4 vs Turn 7 (0.35%; p = 1.00; d = 0.02) H: Turn 3 vs Turn 14 (8.81%; p = 0.143; d = 0.56) L: Turn 12 vs Turn 14 (0.18%; p = 1.00; d = 0.01) 15 m-out (s) 5.93 (6.23) 0.01 (< 0.001) 0.15 (0.15) H: Turn 1 vs Turn 11 (3.01%; p < 0.001; d = 0.95) L: Turn 10 vs Turn 12 (0.00%; p = 1.00; d = 0.31) H: Turn 2 vs Turn 11 (1.81%; p = 0.024; d = 0.52) L: Turn 10 vs Turn 13 (0.12%; p = 1.00; d = 0.03) Turn – race first half (T0-400 m) Total turn (s) 30.21 (16.03) < 0.001 (< 0.001) 0.47 (0.32) H: Turn 1 vs Turn 8 (4.17%; p < 0.001; d = 1.06) L: Turn 4 vs Turn 7 (0.08%; p = 1.00; d = 0.03) H: Turn 3 vs Turn 8 (2.64%; p < 0.001; d = 0.64) L: Turn 4 vs Turn 7 (0.09%; p = 1.00; d = 0.03) 5 m-in (s) 19.90 (9.76) < 0.001 (< 0.001) 0.36 (0.22) H: Turn 1 vs Turn 8 (5.86%; p < 0.001; d = 1.50) L: Turn 6 vs Turn 7 (0.29%; p = 1.00; d = 0.07) H: Turn 3 vs Turn 8 (3.52%; p = 0.001; d = 0.77) L: Turn 6 vs Turn 7 (0.30%; p = 1.00; d = 0.07) Water break time (s) 4.75 (0.39) 0.001 (0.807) 0.12 (0.01) H: Turn 1 vs Turn 7 (8.22%; p = 0.05; d = 0.48) L: Turn 2 vs Turn 4 (0.00%; p = 1.00; d = 0.00) H: Turn 5 vs Turn 7 (1.82%; p = 1.00; d = 0.11) L: Turn 2 vs Turn 4 (0.00%; p = 1.00; d = 0.00) Water break dist. (m) 4.28 (1.10) 0.012 (0.341) 0.16 (0.04) H: Turn 1 vs Turn 8 (7.84%; p = 0.010; d = 0.56) L: Turn 4 vs Turn 7 (0.35%; p = 1.00; d = 0.77) H: Turn 3 vs Turn 8 (5.07%; p = 0.657; d = 0.32) L: Turn 6 vs Turn 7 (1.96%; p = 1.00; d = 0.03) 15 m-out (s) 15.04 (6.72) < 0.001 (< 0.001) 0.31 (0.16) H: Turn 1 vs Turn 6 (2.19%; p < 0.001; d = 0.79) L: Turn 6 vs Turn 8 (1.21%; p = 1.00; d = 0.20) H: Turn 2 vs Turn 8 (2.16%; p = 0.039; d = 0.37) L: Turn 2 vs Turn 3 (0.00%; p = 1.00; d = 0.00) Turn – race second half (T400-800 m) Total turn (s) 7.05 (8.04) 0.008 (< 0.001) 0.17 (0.19) H: Turn 10 vs Turn 15 (2.71%; p = 0.097; d = 0.68) L: Turn 11 vs Turn 14 (0.00%; p = 1.00; d = 0.44) H: Turn 10 vs Turn 11 (0.51%; p < 0.001; d = 0.12) L: Turn 11 vs Turn 14 (0.00%; p = 1.00; d = 0.00) 5 m-in (s) 15.56 (19.82) < 0.001 (< 0.001) 0.31 (0.36) H: Turn 9 vs Turn 10 (3.75%; p < 0.001; d = 0.74) L: Turn 13 vs Turn 15 (0.00%; p = 1.00; d = 0.16) H: Turn 10 vs Turn 11 (2.05%; p < 0.001; d = 0.37) L: Turn 11 vs Turn 13 (0.00%; p = 1.00; d = 0.00) Water break time (s) 2.60 (4.87) 0.054 (0.001) 0.07 (0.12) H: Turn 11 vs Turn 14 (5.31%; p = 0.001; d = 0.32) L: Turn 13 vs Turn 15 (0.47%; p = 1.00; d = 0.03) H: Turn 11 vs Turn 14 (5.31%; p = 0.001; d = 0.32) L: Turn 10 vs Turn 13 (0.47%; p = 1.00; d = 0.03) Water break dist. (m) 0.56 (0.52) 0.645 (0.663) 0.02 (0.02) H: Turn 9 vs Turn 10 (0.55%; p = 1.00; d = 0.04) L: Turn 12 vs Turn 14 (0.19%; p = 1.00; d = 0.01) H: Turn 11 vs Turn 12 (3.00%; p = 1.00; d = 0.20) L: Turn 9 vs Turn 13 (0.18%; p = 1.00; d = 0.01) 15 m-out (s) 6.10 (2.40) 0.015 (0.063) 0.15 (0.06) H: Turn 11 vs Turn 15 (4.80%; p = 0.253; d = 0.56) L: Turn 10 vs Turn 12 (0.00%; p = 1.00; d = 0.00) H: Turn 11 vs Turn 14 (0.73%; p = 0.339; d = 0.20) L: Turn 10 vs Turn 12 (0.00%; p = 1.00; d = 0.00) Pace – total race (T0-800 m): #analysis performed after deleting P50 and P800 (i.e., lap 1 and 16, respectively); Pace – race first half (T0-400 m) # analysis performed after deleting P50 (i.e., lap 1); Pace – race second half (T400-800 m): # – analysis performed after deleting P800 (i.e., lap 16). Turn: # – analysis performed after deleting 1 and 15 (i.e., first and last turn). H – highest and significant mean difference; L – lowest and no-significant mean difference.
3.3. Normative stability (performance and pace)
The performance (including all laps and after deleting the first and/or the last lap) presented a weak-very high stability (P100-450: r = 0.163, p = 0.32; P550-650: r = 0.989, p < 0.001). Nevertheless, inspecting the race per half’s, it can be observed that the stability increases to high-very high (first half T0-400 m – after deleting the first lap), and to very high (second half T400-800 m – after deleting the last lap) (Table 3).
In the pacing parameters, with all laps included, the clean swim presented the highest range (i.e., lowest stability), from weak (P50-550: r = 0.066, p = 0.70) to very-high (P600-650: r = 0.974, p < 0.001). Same trend was verified after deleting the first and/ or the last lap. On the other hand, the SI presented the lowest range (i.e., highest stability) from high (P50-800: r = 0.716, p < 0.001) to very-high (P600-700: r = 0.974, p < 0.001). Same trend was verified after deleting the first and/or the last lap
(Table 3). 3.00 3.05 3.10 3.15 3.20 3.25 3.30 3.35 3.40 3.45 3.50 11.00 11.10 11.20 11.30 11.40 11.50 11.60 11.70 11.80 T1 T2 T3 T4 T5 T6 T7 T8 T9 T10 T11 T12 T13 T14 T15 5m in [s] Tot al turn [s] Total turn 5m in 3.20 3.25 3.30 3.35 3.40 3.45 3.50 11.20 11.30 11.40 11.50 11.60 11.70 11.80 T2 T3 T4 T5 T6 T7 T8 T9 T10 T11 T12 T13 T14 5m in [s] Tot al turn [s] Total turn 5m in 1.85 1.90 1.95 2.00 2.05 2.10 2.15 2.20 2.25 2.30 2.35 11.00 11.10 11.20 11.30 11.40 11.50 11.60 11.70 11.80 T1 T2 T3 T4 T5 T6 T7 T8 T9 T10 T11 T12 T13 T14 T15 W at er br eak time [s] Tot al turn [s]
Total turn Water break time
1.90 1.95 2.00 2.05 2.10 2.15 2.20 11.20 11.30 11.40 11.50 11.60 11.70 11.80 T2 T3 T4 T5 T6 T7 T8 T9 T10 T11 T12 T13 T14 W at er br eak time [s] Tot al turn [s]
Total turn Water break time
4.40 4.60 4.80 5.00 5.20 5.40 5.60 5.80 6.00 11.00 11.10 11.20 11.30 11.40 11.50 11.60 11.70 11.80 T1 T2 T3 T4 T5 T6 T7 T8 T9 T10 T11 T12 T13 T14 T15 W at er br eak dis tance [m] Tot al turn [s]
Total turn Water break distance
4.40 4.60 4.80 5.00 5.20 5.40 5.60 5.80 11.20 11.30 11.40 11.50 11.60 11.70 11.80 T2 T3 T4 T5 T6 T7 T8 T9 T10 T11 T12 T13 T14 W at er br eak dis tance [m] Tot al turn [s]
Total turn Water break distance
7.50 7.60 7.70 7.80 7.90 8.00 8.10 8.20 11.00 11.10 11.20 11.30 11.40 11.50 11.60 11.70 11.80 T1 T2 T3 T4 T5 T6 T7 T8 T9 T10 T11 T12 T13 T14 T15 15m out [s] Tot al turn [s]
Total turn 15m out
7.80 7.85 7.90 7.95 8.00 8.05 8.10 11.20 11.30 11.40 11.50 11.60 11.70 11.80 T2 T3 T4 T5 T6 T7 T8 T9 T10 T11 T12 T13 T14 15m out [s] Tot al turn [s]
Total turn 15m out
Fig. 2. Mean values for the total turn, 5 m-in, water breakout time, water breakout distance and 15 m-out. Panels at the left side show the turns for the total race (T0-800 m), panels at the right side show the turns without the first (T0-50 m) and last (T750-800 m) turn; T – refers to the turn.
3.4. Normative stability (turn)
During the total race (T0-800 m), and including all turns, the total turn ranged between weak to very high correlation (from P200-750, r = 0.148, p = 0.39 to P550-600, r = 0.969, p < 0.001). However, after deleting the first and the last lap (T0-800 m), the total turn increased to a moderate-very high correlation (from P100-700, r = 0.310, p = 0.06 to P550-600, r = 0.969, p < 0.001). When splitting the total race by half’s (T0-400 m and T400-800 m), the total turn revealed a moderate-very high correlation (all laps included), and a very high correlation (after deleting the first and the last lap, T0-400 m and T400-800 m, respectively) (Table 3). The water break distance was the parameter presenting the lowest pairwise correlation (i.e., less stability) in all laps included (T0-800 m: P450-550, r = -0.009, p = 0.96; T0-400 m: P100-350, r = 0.313, p = 0.08; T400-(T0-800 m: P450-550, r = -0.009, p = 0.96). This was also verified after deleting the first and/or the last lap. On the other hand, the water break time presented a high-very high correlation (all laps included: from P50-550, r = 0.515, p = 0.001 to P450-550, r = 0.938, p < 0.001). Moreover, after deleting the Table 3
Pearson’s correlation coefficients (for the highest and lowest pairwise) for the performance, pace and turn parameters in the total race (T0-800 m), first half (T0-400 m) and second half (T400-800 m).
Total race T0-800 m: without P50 and P800 (or turn 15) T0-400 m: without P50;
T400-800 m: without P800 (or turn 15)
Highest Lowest Highest Lowest
Performance T0-800 m (s) P550-650 (r = 0.989, p < 0.001) P100-450 (r = 0.163, p = 0.32)* P550-650 (r = 0.989, p < 0.001) P100-450 (r = 0.163, p = 0.32)* T0-400 m (s) P250-300 (r = 0.972, p < 0.001) P50-250 (r = 0.671, p < 0.001) P250-300 (r = 0.972, p < 0.001) P100-350 (r = 0.703, p < 0.001) T400-800 m (s) P550-650 (r = 0.989, p < 0.001) P450-800 (r = 0.746, p < 0.001) P550-650 (r = 0.989, p < 0.001) P450-750 (r = 0.858, p < 0.001) Pacing Clean swim (m·s−1) T0-800 m P600-650 (r = 0.974, p < 0.001) P50-550 (r = 0.066, p = 0.70)* P600-650 (r = 0.974, p < 0.001) P100-550 (r = 0.094, p = 0.59)* T0-400 m P300-400 (r = 0.954, p < 0.001) P50-250 (r = 0.409, p = 0.01) P300-400 (r = 0.954, p < 0.001) P100-250 (r = 0.487, p = 0.003) T400-800 m P600-650 (r = 0.974, p < 0.001) P450-800 (r = 0.602, p < 0.001) P600-650 (r = 0.974, p < 0.001) P450-750 (r = 0.784, p < 0.001) SF (Hz) T0-800 m P600-700 (r = 0.985, p < 0.001) P400-800 (r = 0.668, p < 0.001) P600-700 (r = 0.985, p < 0.001) P100-750 (r = 0.755, p < 0.001) T0-400 m P150-200 (r = 0.981, p < 0.001) P50-350 (r = 0.790, p < 0.001) P150-200 (r = 0.981, p < 0.001) P100-400 (r = 0.855, < 0.001) T400-800 m P450-500 (r = 0.980, p < 0.001) P650-800 (r = 0.740, p < 0.001) P450-500 (r = 0.980, p < 0.001) P450-750 (r = 0.880, p < 0.001) SL (m) T0-800 m P600-700 (r = 0.987, p < 0.001) P50-650 (r = 0.699, p < 0.001) P600-700 (r = 0.987, p < 0.001) P100-650 (r = 0.800, p < 0.001) T0-400 m P350-400 (r = 0.979, p < 0.001) P50-400 (r = 0.821, p < 0.001) P350-400 (r = 0.979, p < 0.001) P100-400 (r = 0.893, p < 0.001) T400-800 m P600-700 (r = 0.987, p < 0.001) P450-800 (r = 0.838, p < 0.001) P600-700 (r = 0.987, p < 0.001) P650-750 (r = 0.863, p < 0.001) SI (m2·s−1) T0-800 m P600-700 (r = 0.974, p < 0.001) P50-800 (r = 0.716, p < 0.001) P600-700 (r = 0.974, p < 0.001) P100-650 (r = 0.748, p < 0.001) T0-400 m P300-400 (r = 0.970, p < 0.001) P50-400 (r = 0.836, p < 0.001) P300-400 (r = 0.970, p < 0.001) P100-350 (r = 0.888, p < 0.001) T400-800 m P600-700 (r = 0.974, p < 0.001) P450-800 (r = 0.842, p < 0.001) P600-700 (r = 0.974, p < 0.001) P450-650 (r = 0.859, p < 0.001) Turn Total turn (s) T0-800 m P550-600 (r = 0.969, p < 0.001) P200-750 (r = 0.148, p = 0.39)* P550-600 (r = 0.969, p < 0.001) P100-700 (r = 0.310, p = 0.06)* T0-400 m P200-300 (r = 0.959, p < 0.001) P50-400 (r = 0.616, p < 0.001) P200-300 (r = 0.959, p < 0.001) P100-400 (r = 0.827, p < 0.001) T400-800 m P550-600 (r = 0.969, p < 0.001) P650-750 (r = 0.333, p = 0.04) P550-600 (r = 0.969, p < 0.001) P550-700 (r = 0.884, p < 0.001) 5 m-in (s) T0-800 m P600-650 (r = 0.897, p < 0.001) P400-550 (r = 0.117, p = 0.49)* P600-650 (r = 0.897, p < 0.001) P400-550 (r = 0.117, p = 0.49)* T0-400 m P200-300 (r = 0.800, p < 0.00) P50-400 (r = 0.306, p = 0.06)* P200-300 (r = 0.800, p < 0.001) P150-400 (r = 0.458, p = 0.005) T400-800 m P600-650 (r = 0.897, p < 0.001) P700-750 (r = 0.746, p < 0.001) P600-650 (r = 0.897, p < 0.001) P550-700 (r = 0.747, p < 0.001)
Water break time (s)
T0-800 m P450-550 (r = 0.938, p < 0.001) P50-550 (r = 0.515, p = 0.001) P450-550 (r = 0.938, p < 0.001) P400-650 (r = 0.671, p < 0.001)
T0-400 m P150-250 (r = 0.938, p < 0.001) P50-400 (r = 0.621, p < 0.001) P150-250 (r = 0.938, p < 0.001) P100-400 (r = 0.678, p < 0.001)
T400-800 m P450-550 (r = 0.938, p < 0.001) P600-750 (r = 0.661, p < 0.001) P450-550 (r = 0.938, p < 0.001) P600-650 (r = 0.844, p < 0.001)
Water break distance (m)
T0-800 m P550-650 (r = 0.971, p < 0.001) P450-550 (r = -0.009, p = 0.96*) P550-650 (0.971, p < 0.001) P450-550 (-0.009, p = 0.96*) T0-400 m P150-250 (r = 0.947, p < 0.001) P100-350 (r = 0.313, p = 0.08*) P150-250 (0.947, p < 0.001) P100-350 (0.313, p = 0.08*) T400-800 m P550-650 (r = 0.971, p < 0.001) P450-550 (r = -0.009, p = 0.96*) P550-650 (0.971, p < 0.001) P450-550 (-0.009, p = 0.96*) 15 m-out (s) T0-800 m P500-550 (r = 0.971, p < 0.001) P100-750 (r = 0.018, p = 0.91*) P500-550 (r = 0.971, p < 0.001) P100-700 (r = 0.314, p = 0.06*) T0-400 m P200-250 (r = 0.965, p < 0.001) P50-400 (r = 0.664, p < 0.001) P200-250 (r = 0.965, p < 0.001) P100-400 (r = 0.839, p < 0.001) T400-800 m P500-550 (r = 0.971, p < 0.001) P450-750 (r = 0.206, p = 0.22*) P500-550 (r = 0.971, p < 0.001) P450-700 (r = 0.867, p < 0.001)
Highest – highest correlation (higher stability); Lowest – lowest correlation (lowest stability); SF – stroke frequency; SL – stroke length; SI – stroke index*p ≥ 0.05.
last lap (T400-800 m) the correlation was very high (from P600-650, r = 0.844, p < 0.001 to P450-550, r = 0.938, p < 0.001)
(Table 3).
4. Discussion
The aim of the current study was to assess the stability of the performance, pace and turn parameters of elite long-distance swimmers. Contrarily to what it was hypothesized, a significant and moderate variation was verified for the performance, pace and turn parameters in the total race (T0-800), first (T0-400), and second half (T400-800 m). All parameters were significantly different between the first and the second half of the race. Overall, the first half (T0-400 m) was fastest (performance), with higher SL and SI (pace), and fastest total turn. No differences were found between the first and second half for the clean swim velocity (pace) and the water break distance after turns.
As stated earlier, a swimming race is composed by four phases. In short-distance events such as the freestyle 100 m race, the start may contribute with nearly 12% to the total race time (Morais et al., 2018). However, in this long-distance particular case (800 m freestyle), the start contributes with 1.40% and the finish with 0.06% to the total race time. In this sense, it seems that in an 800 m long-distance event, the clean swim (16 laps, 61.05% of the total race time) and the turn (15 turns, 35.95% of the total race time) are the major phases responsible for the 800 m performance.
4.1. Performance and pace stability
The performance and pace parameters analyzed presented a significant and moderate-strong variation (low stability), where a sinusoidal profile was observed. Increases and decreases of such parameters (performance and pace) were observed between laps, and in some cases significant variations were found (Table 2). This was verified for the total race (T0-800 m), first (T0-400 m), and second half (T400-800 m), with total laps included. This was also verified after removing the first and last lap (total race), the first lap (first half), and the last lap (second half). However, and despite the variability maintained significant, it allowed to decrease the highest difference between pairwise (Table 2). This option of deleting the referenced laps, was made to ensure a more intrinsic analysis of the stability. The first lap includes the start (which help swimmers to enhance their lap performance), and in the last lap swimmers “boost” their stroke mechanics in order to enhance their performance, disregarding the pace aspects (Lipinska et al., 2016a;
McGibbon et al., 2018).
Overall, the second half of the race (T400-800 m) was significantly slower (4.24 s, 1.67%) in comparison to the first one (T0-400 m), despite hypothetical race strategies that might occur. However, a deeper observation suggests that elite swimmers choose to increase/decrease their swimming velocity within each half of the race (Fig. 1). A study conducted byLipinska (2009), showed that elite female swimmers swam faster in the first (0–200 m) and last (600–800 m) quarter of the race, being slower during the second (200–400 m) and third (400–600 m) quarters of the race. Hence, contrarily to what was expected, the capability of maintaining a constant pace to enhance the performance was not observed in elite long-distance swimmers. The pace parameters (SL and SI) responsible for the stroke mechanics presented the same trend (decrease) between the first and second half of the race. Between laps, the SF showed a sinusoidal profile (increases/decreases) during the total race (T0-800 m), and the SL a constant decrease in the first half (T0-400 m), and a sinusoidal (increases/decreases) in the second half (T400-800 m) (Fig. 1). The clean swim speed, showed a no-significant slight decrease (from 1.63 to 1.62 m·s−1). This speed “maintenance” might be due to the increase verified in the SF (from 0.65 to 0.66 Hz). Meaning that elite long-distance swimmers compensate the SL decrease with a SF increase to maintain their swim speed (Lipinska et al., 2016a; Lipinska, Allen, & Hopkins, 2016b).
4.2. Turn stability
The total race (T0-800 m) and the first half (T0-400 m) variation was significant and with a minimum-moderate effect, and the second half (T400-800 m) significant and with a without-moderate effect (Tables 2 and 3). The first and/or the last turn removal for the stability assessment, comes with the same rationality as for the pace, and the trend was similar (allowed to decrease the highest difference between pairwise). The time spent to perform the total turn (main outcome) increased between the first and the second half (all laps included: 11.51 s vs 11.63 s,Table 1). Deleting first and last turn, first half: 11.55 s, and second half: 11.69 s, respec-tively. The water break distance was the only turn parameter that did not significantly differed between the first and the second half of the race.
Such as the pace parameters, the total turn (main outcome) also showed a sinusoidal profile with significant variations between some turns (low stability). There is no information in the literature about the turning stability of elite long-distance swimmers, and few studies assessed the turning profile/performance of elite swimmers (e.g.,Jesus et al., 2011; Veiga & Roig, 2016). However, some differences can be noted in the 15 m out.Jesus et al. (2011)reported an overall 7.64 s time spent to reach the 15 m, and present data revealed an 8.19 s (Δ = 7.20%). Present data shows that long-distance swimmers are not capable of maintain a similar turning pattern during the total race (Tables 1 and 2). Moreover, the slowest turns occurred simultaneously to the lowest clean swim split (e.g., T450-500 m: clean swim = 1.60 m·s-1; Turn 10: total turn = 11.78 s). It might be suggested that a turning profile maintenance, despite a variation in the clean swim, could enhance the turning performance. Indeed, this maintenance it’s a characteristic of long-distance sports (Damasceno et al., 2013; Foster et al., 1994; Garland, 2005).
4.3. World record comparison
The male 800 m freestyle world record (452.12 s) was achieved at the 2009 FINA World Championships, held in Rome. It was possible to retrieve the following data: (i) performance: all split time; (ii) pace: 14 laps (8 in first half and 6 in the second); (iii) turns: 9 total turn time (5 in the first half and 4 in the second). Contrarily to what was verified in the present data, with all laps included, the comparison of the first (T0-400 m) and second half (T400-800 m) showed a positive split (226.79 s vs 225.33 s, improvement by 0.64%), and an increase of the clean swim speed (1.69 m·s−1vs 1.72 m·s−1), and SF (0.65 Hz vs 0.69 Hz). Moreover, present data shows that the time to cover a distance (in the clean swim, intermediate 20 m) during the total race, revealed to be 4.63% slower in each lap, in comparison to the world record. As for the turn parameters, the total turn showed a mean of 10.76 s during the total race (10.66 s in the first half, and 10.85 s in the second). It’s a 0.81 s faster in each turn in comparison to the present data. This means that in the 15 turns of an 800 m freestyle race, the swimmers analyzed “loss” 12.15 s only in the turn phase. Despite this world record was achieved during the polyurethane era (FINA banned it since 2010), one might claim that increasing the pace and turn stability (i.e., decreasing the pace and/or turns variation between laps) could lead to a meaningful enhancement of long-distance male swimmers. At least for elite long-distance female swimmers, it was reported that reducing the gap time/velocity between the parts of an 800 m freestyle race (achieving a similar distribution of swimming velocity during the entire race) could lead to a performance enhancement
(Lipinska, 2009).
Endurance sports and/or competitions are characterized by the ability of maintaining the inherent movement or pattern a given sport/competition (Foster et al., 1994; Garland, 2005). In the case of long-distance swimming, the swimmers presented a low stability of the pace (stroke mechanics) and turn parameters. This low stability is characterized by a significant and meaningful difference between the parameters assessed during the multiple laps. It might be speculated that increasing such parameters in some laps, would have a negative effect (forced decrease) in other ones. Previous coaching suggested swimmers to maintain a constant pace during a long-distance race (Lipinska, 2009). However, new reports about elite long-distance race analysis observed that swimmers do not maintain their pace during the total race (Cisale, 2018), and has it happens in other endurance sports. In the present data, this was also verified. It seems that elite long-distance swimmers are showing this sinusoidal profile (increase/decrease) in their pace and turn parameters. So, one might argue if: (i) long-distance elite swimmers should be advised to better “learn” and maintain their optimal pace and turn performance during the total race, presenting a more linear profile (without significant increases/decreases) for such parameters, or; (ii) they should choose a race strategy with variations between half’s and/or partial parts of the race, based in their energetic and/or stroke mechanics pattern. In this sense, future research about this topic is needed to verify how stability affects elite long-distance swimmers’ performance, and how swimmers should behave to enhance their performance.
The following main limitations were addressed: (i) these assumptions were presented based in a holistic perspective of the race (without knowing the race strategy of each swimmer), and; (ii) for future researches about this topic, it might be suggested to assess the variation within each half and/or partial part (per example every 100 m) of the race.
5. Conclusions
It can be concluded that pace and turn performances are the major responsible for the 800 m freestyle race. Elite male long-distance swimmers showed a significant and moderate variation (i.e., low stability) in the pace and turn parameters. This is enhanced between the first and second half of the race. The turn variation (i.e., increase/decrease) happened simultaneously with the clean swim increase/decrease. Coaches are advised to “control” the swimmers’ variations between laps, which will help them excelling.
Conflict of interest
The authors have no professional relationships to disclose with companies or manufacturers who will benefit from the results of the present study.
Acknowledgments
To LEN (Ligue Européenne de Natation) and Spiideo AB for providing the videos.
This project was supported by the National Funds through FCT – Portuguese Foundation for Science and Technology (UID/DTP/ 04045/2013) – and the European Fund for regional development (FEDER) allocated by European Union through the COMPETE 2020 Programme (POCI-01-0145-FEDER-006969). We would like also to thank the support of the University of Beira Interior and Santander Universities (Bolsa BIPD/ICIFCSH-Santander Universidades-UBI/2017).
References
Arellano, R., Brown, P., Cappaert, J., & Nelson, R. C. (1994). Analysis of 50-, 100-, and 200-m freestyle swimmers at the 1992 Olympic Games. Journal of Applied
Biomechanics, 10(2), 189–199.
Cisale, G. (2018). Katie Ledecky’s world record under the x ray.https://swimswam.com/katie-ledecky-world-record-under-x-ray/.
Cohen, J. (1988). Statistical Power Analysis for the Behavioral Sciences. Hillsdale, NJ: Lawrence Earlbaum Associates.
Costa, M. J., Marinho, D. A., Bragada, J. A., Silva, A. J., & Barbosa, T. M. (2011). Stability of elite freestyle performance from childhood to adulthood. Journal of Sports
Sciences, 29(11), 1183–1189.
middle-distance events. International Journal of Sports Medicine, 6, 266–270.
Craig, A. B., & Pendergast, D. R. (1979). Relationships of stroke rate, distance per stroke, and velocity in competitive swimming. Medicine and Science in Sports, 11,
278–283.
Damasceno, M., Correia-Oliveira, C. R., Narita, T., Pasqua, L., Bueno, S., Lima-Silva, A. E., & Bertuzzi, R. (2013). Estratégia adotada em provas de natação estilo crawl:
Uma análise das distâncias de 800 e 1500m. Revista Brasileira de Cineantropometria & Desempenho Humano, 15, 361–370.
Foster, C., Schrager, M., Snyder, A. C., & Thompson, N. N. (1994). Pacing strategy and athletic performance. Sports Medicine, 17(2), 77–85.
Garland, S. (2005). An analysis of the pacing strategy adopted by elite competitors in 2000 m rowing. British Journal of Sports Medicine, 39(1), 39–42.
Hay, J. G., & Guimaraes, A. C. S. (1983). Quantitative look at swimming biomechanics. Swimming Technique, 20(2), 11–17.
Hellard, P., Dekerle, J., Avalos, M., Caudal, N., Knopp, M., & Hausswirth, C. (2008). Kinematic measures and stroke rate variability in elite female 200-m swimmers in the four swimming techniques: Athens 2004 Olympic semi-finalists and French National 2004 Championship semi-finalists. Journal of Sports Sciences, 26(1),
35–46.
Jesus, S., Costa, M., Marinho, D., Garrido, N., Silva, A., & Barbosa, T. (2011). 13th FINA World Championship finals: Stroke kinematical and race times according to
performance, gender and event. Portuguese Journal of Sport Sciences, 11, 275–278.
Lipinska, P. (2009). Kinematic tactics in the women's 800 m freestyle swimming final at the Beijing 2008 Olympic Games. Baltic Journal of Health and Physical Activity,
1(1), 86.
Lipinska, P., Allen, S. V., & Hopkins, W. G. (2016b). Relationships between Pacing Parameters and Performance of Elite Male 1500-m Swimmers. International Journal
of Sports Physiology and Performance, 11(2), 159–163.
Lipinska, P., Allen, S. V., & Hopkins, W. G. (2016a). Modeling parameters that characterize pacing of elite female 800-m freestyle swimmers. European Journal of Sport
Sciences, 16(3), 287–292.
Maglischo, E. W. (2012). Part II: Training fast twitch muscle fibers: Why and how. Journal of Swimming Research, 19, 1–18.
Mason, B., & Cossor, J. (2001). Swim turn performances at the Sydney 2000 Olympic Games. Conference Proceedings of International Society of Biomechanics in Sports
(pp. 65–69). University of San Francisco Biomechanics Symposia.
McGibbon, K. E., Pyne, D. B., Shephard, M. E., & Thompson, K. G. (2018). Pacing in swimming: A systematic review. Sports Medicine, 48(7), 1621–1633.
Morais, J. E., Marinho, D. A., Arellano, R., & Barbosa, T. M. (2018). Start and turn performances of elite sprinters at the 2016 European Championships in swimming.
Sports Biomechanics [Epub ahead of print].
Morais, J. E., Saavedra, J. M., Costa, M. J., Silva, A. J., Marinho, D. A., & Barbosa, T. M. (2013). Tracking young talented swimmers: Follow-up of performance and its
biomechanical determinant factors. Acta of Bioengineering and Biomechanics, 15(3), 129–138.
Pyne, D. B., Trewin, C. B., & Hopkins, W. G. (2004). Progression and variability of competitive performance of Olympic swimmers. Journal of Sports Sciences, 22(7),
613–620.
Veiga, S., & Roig, A. (2016). Underwater and surface strategies of 200 m world level swimmers. Journal of Sports Sciences, 34(8), 766–771.
Wakayoshi, K., Nomura, T., Takahashi, G., Mutoh, Y., & Miyashita, M. (1992). Analysis of swimming races in the 1989 Pan Pacific swimming championships and 1988 Japanese Olympic trials. In Biomechanics and Medicine in Swimming (pp. 135-141). Swimming Science VI.