Carlos Pestana Barros & Nicolas Peypoch
A Comparative Analysis of Productivity Change in Italian and Portuguese Airports
WP 006/2007/DE _________________________________________________________
António Afonso and Ricardo M. Sousa
Assessing Long-Term Fiscal Developments: Evidence from Portugal WP 03/2009/DE/UECE _________________________________________________________ Department of Economics WORKING PAPERS ISSN Nº0874-4548
School of Economics and Management TECHNICAL UNIVERSITY OF LISBON
Assessing Long-Term Fiscal Developments:
Evidence from Portugal
*
António Afonso
#Ricardo M. Sousa
$January 2009
Abstract
Drawing on quarterly data for Portugal, we use a Three-Stage Least Square method and a system of equations to recursively estimate two components of fiscal policy – responsiveness and persistence – and to infer about the sources of fiscal deterioration (improvement). The results suggest that: (i) government spending exhibits higher persistence than government revenue; and (ii) government revenue is more responsive to the business cycle than government spending.
Keywords: Fiscal deterioration, Portugal. JEL classification: E62, H50.
* The opinions expressed herein are those of the authors and do not necessarily reflect those of the ECB or
the Eurosystem.
# ISEG/TULisbon - Technical University of Lisbon, Department of Economics; UECE – Research Unit on
Complexity and Economics; R. Miguel Lupi 20, 1249-078 Lisbon, Portugal. UECE is supported by FCT (Fundação para a Ciência e a Tecnologia, Portugal), financed by ERDF and Portuguese funds. European Central Bank, Directorate General Economics, Kaiserstraße 29, D-60311 Frankfurt am Main, Germany. Emails: [email protected], [email protected].
$ University of Minho, Department of Economics and Economic Policies Research Unit (NIPE), Campus of
Gualtar, 4710-057 - Braga, Portugal; London School of Economics, Department of Economics and Financial Markets Group (FMG), Houghton Street, London WC2 2AE, United Kingdom. E-mails: [email protected], [email protected].
2
1. Introduction
Public spending control has been a problem in Portugal, with significant increases in primary spending in the last two decades. Indeed, the gains obtained from the reduction in the interest payments on government debt, were mostly used to increase public spending, and seldom seen as a window of opportunity to consolidate public finances. Therefore, it seems fair to say that after entering the European Union (EU) in 1986, and adhering to the European and Monetary Union in 1999, Portugal’s track record in implementing fiscal policy could have been more ambitious. Portugal was the first EU country to breach the Stability and Growth Pact in 2002, becoming subject to the Excessive Deficit Procedure, a situation that occurred again in 2005.
Studies addressing the issue of the sustainability of public finances usually test whether government spending and government revenue display a fiscal sustainable “equilibrium” pattern. In fact, any inadequate fiscal policy may lead to potential “fiscal deterioration” and, therefore, to the lack of public finances sustainability.
In this paper, we follow Afonso et al. (2008b) and examine the role of two major characteristics of fiscal policy behaviour in allowing one to infer about the conditions of fiscal sustainability or fiscal deterioration: i) responsiveness, that is, the sensitivity of fiscal variables to economic developments; and ii) persistence, that is, dependence of fiscal behaviour on its own past developments.
We depart notably from Fatas and Mihov (2003) and Afonso et al. (2008a) in that we aim at testing whether time-varying behaviour of the fiscal policy characteristics can simultaneously influence the conditions of fiscal deterioration. As a result, we estimate a system that includes both the expenditure and revenue equations, drawing upon quarterly fiscal data.
The results suggest that fiscal deterioration has been a major characteristic of public finances in Portugal, reflected in the consecutive budget deficits and the rise of the debt-to-GDP ratio. The higher persistence of government spending relative to government revenue has been the major determinant of the fiscal deterioration. Moreover, although government revenue has typically been more responsive than government spending, it has not been sufficient to change the path of deterioration in public finances.
The paper is organized as follows. Section 2 briefly reviews the related literature. Section 3 presents the empirical methodology. Section 4 describes the data and presents and discusses the empirical results. Section 5 concludes.
2. Related literature
The sustainability of public finances has been commonly assessed via unit root and cointegration tests, by checking whether the first differences of the debt series are stationary or whether government spending and revenue are co-integrated. The rejection of these tests is typically interpreted as evidence against of either strong or weak fiscal sustainability.
While such analysis has been carried out on a country basis (Hamilton and Flavin, 1986; Trehan and Walsh, 1991; Ahmed and Rogers, 1995; Quintos, 1995), fiscal developments have also been assessed for OECD and EU country groupings with panel unit root and cointegration tests (Afonso and Rault, 2007).
Despite its intuitive application, some authors have argued that the rejection of sustainability based on standard cointegration tests is invalid because the present-value borrowing constraint could be satisfied even when deficit and debt are difference- stationary or when government spending and revenue are not cointegrated (Bohn, 2007).
In light of these criticisms, this work uses a new approach developed by Afonso et al. (2008b) to assess fiscal deterioration or fiscal improvement for Portugal. It looks at how fiscal policy characteristics affect both government spending and revenue and emphasizes their time-varying and interplay nature. It also improves upon the work of Afonso et al. (2008a) who extend the analysis of Fatás and Mihov (2006) by using instrumental variables method (IV), but estimate, separately, the equations for government expenditure and revenue.
3. Methodology
The empirical methodology used to analyze the role of responsiveness and persistence in determining conditions of potential fiscal deterioration is based on the recursive estimation of the following system of structural equations:
( )
( )
(
)
(
)
( )
( )
( )
(
)
1 ,
1 ,
log log log 1, 2, ,
log log log 1, 2, ,
G G G G t k k t k t k t R R R R t k k t k t k t G Y G t T R Y R t T α β γ ε α β γ ε − − ⎧ = + + + = ⎪ ⎨ ⎪ = + + + = ⎩ K K (1)
where G is real government spending, R is real government revenue and Y is real GDP. The coefficient βk measures the responsiveness of fiscal policy for each sample of length k
4
(where k =k +h and h=1 K,2, ,T −k),1 that is, the behaviour of fiscal policy over the business cycle. By its turn, the coefficient γk represents a measure of fiscal persistence, i.e.
the degree of dependence of the current fiscal behaviour from its own past setting.
Moreover, it is necessary to include the level of the current and lagged value of government spending and revenue in the regressions in order to capture the persistence of fiscal policy.
The estimation of system (1) is difficulted by the presence of lagged endogenous variables among the explanatory variables. Consequently, we use a Three-Stage Least Square (TSLS) method (Zellner and Theil, 1962), which insures consistent estimates. Moreover, in order avoid any endogeneity bias due to the simultaneity in the determination of output, government spending and revenue, current GDP (Y) is instrumented with two lags of GDP, the index of oil prices (as in Fatás and Mihov, 2006), and the lagged value for revenue and spending, respectively in the spending and revenue equation.
Once system (1) is recursively estimated and each of the
(
T − k +1)
sets of parameters estimates (i.e. one set for each sample period) is stored, we compute the corresponding Wald-statistics and test the following joint restrictions:0:
G R G R
k k k k
H γ =γ ∧β =β . (2) When the null hypothesis is accepted, we conclude that the behaviour of both government spending and revenues evolve dynamically in a way that avoids any structural change of the fiscal position. On the contrary, rejection of the null hypothesis signals a deterioration or improvement in fiscal behaviour. In order to discriminate between these two cases and to assess whether changes in the fiscal position are due to different responsiveness or persistence, we test the following single hypothesis:
0: 1: G R G R k k k k H γ =γ H γ ≠γ (3) 0: G R 1: G R k k k k H β =β H β ≠β . (4) Therefore, one can obtain three possible outcomes: i) fiscal deterioration (due to fiscal persistence and/or to fiscal responsiveness); ii) fiscal improvement (due to persistence and/or responsiveness); iii) indeterminacy, when government spending
1
_
kis the length of the sample window used to initialize the recursive estimation procedure, and we set
_
persistence is bigger than revenue persistence ( G R k k
γ >γ ), but spending responsiveness is lower than revenue responsiveness ( G R
k k
β <β ), and vice versa ( G R; G R
k k k k
γ <γ β >β ).
4. Empirical Analysis 4. 1. Data
We use quarterly data for Portugal covering the period 1978:1-2007:4.2 National currency data for all years prior to the switch to the euro have been converted using the fixed euro conversion rate in order to provide comparable series across time. All variables are seasonally adjusted and are expressed in natural logarithms of real terms.
For the government finance statistics – that is, government spending and government revenue –, we use budgetary data on a cash basis. It refers to the Central Government, therefore, with the exclusion of the Local and/or the Regional Authorities. The data is typically disseminated through the monthly publications of the Ministry of Finance and the Bank of Portugal. The latest figures are also published in the Special Data Dissemination Standard (SDDS) section of the International Monetary Fund website.
The gain of using high frequency fiscal data is paramount vis-à-vis the absence of quarterly data for the general government. In fact, the patterns of the infra-annual budgetary cash data are quite similar to the ones found for the annual national accounts data provided by the European Commission (AMECO database), which is in accordance to the findings of Afonso and Sousa (2009) for several OECD countries.
For GDP and GDP deflator, we use the Long Series from the Bank of Portugal.
4.2. Results and Discussion
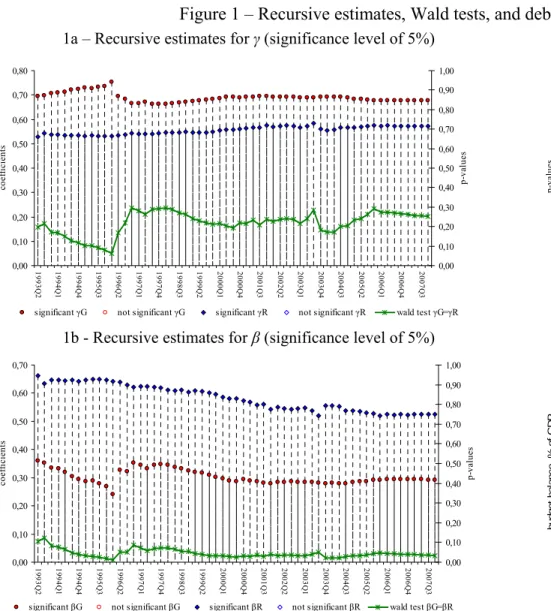
Figures 1a and 1b present the recursive estimates of the measures of persistence and responsiveness for government spending and revenue, while Figure 1c summarizes the results of the Wald test of the joint hypothesis (of equality) in the parameters. Finally, Figure 1d shows how the budget balance (in percentage of GDP) and the debt-to-GDP ratio have evolved over time.
Figure 1a shows that the estimates of persistence for government spending are larger than the ones for government revenue. Note, however, that the Wald tests indicate that the discrepancy in the behaviour of government spending and revenue is not
2 Other papers that also use higher frequency data, either quarterly or montly, are,MacDonald (1992),
Quintos (1995) for the US, Smith and Zin (1991) for Canada, and Baglioni and Cherubini (1993) for Italy. Afonso (2005) provides a broad review of the empirical evidence.
6
significant for most of the sample windows. In contrast, the responsiveness is larger for government revenue than government spending (Figure 1b). Moreover, as suggested by the Wald tests, the difference in the estimates is highly significant.
These results are in line with the empirical evidence reported in Figure 1d which shows that Portugal has been characterized by fiscal deterioration – summarized by consecutive budget deficits and a substantial rise of debt-to-GDP ratio – roughly since 1974.
Our analysis suggests that this path for public finances has mainly been driven by the higher persistence of government spending relative to revenue.
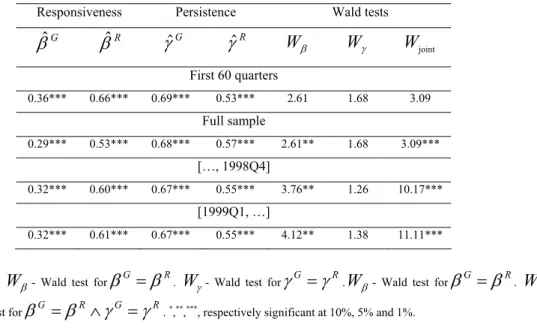
Finally, Table 1 summarises the recursive estimates for several sub-periods, notably before and after the Euro adoption. It shows that the responsiveness of both government spending and revenue has fallen over time. In contrast, while the persistence of spending has remained roughly unchanged, the persistence of government revenue slightly increased over time. Moreover, the fiscal policy characteristics did not seem to change at the time of the Euro adoption.
Table 1 – Recursive window estimates for responsiveness and persistence
Responsiveness Persistence Wald tests
G βˆ βˆR γˆG γˆR β W Wγ Wjoint First 60 quarters 0.36*** 0.66*** 0.69*** 0.53*** 2.61 1.68 3.09 Full sample 0.29*** 0.53*** 0.68*** 0.57*** 2.61** 1.68 3.09*** […, 1998Q4] 0.32*** 0.60*** 0.67*** 0.55*** 3.76** 1.26 10.17*** [1999Q1, …] 0.32*** 0.61*** 0.67*** 0.55*** 4.12** 1.38 11.11***
Notes: Wβ- Wald test forβG =βR. Wγ - Wald test forγG=γR.Wβ- Wald test forβG=βR. Wjoint-
Wald test forβG =βR∧γG =γR. *,**,***, respectively significant at 10%, 5% and 1%.
5. Conclusion
In this paper, we use the approach developed by Afonso et al. (2008b) to assess long-term fiscal developments for Portugal. We draw on quarterly data and a Three-Stage Least Square method, and recursively estimate the responsiveness and the persistence government spending and revenue within a system of equations.
The results confirm that Portugal’s fiscal position has significantly deteriorated over time, reflecting the consecutive budget deficits. This scenario has been driven by the high persistence of government spending. In fact, despite the larger responsiveness of the government revenue, this feature of fiscal policy was not enough to change the path of deterioration in public finances.
From the policy maker’s point of view, the empirical findings of this paper pose important challenges for fiscal policy Indeed, for a country where the persistence of government spending is large it may be difficult for fiscal authorities to act in a timely and temporary manner in order to stabilize the economy.
References
Afonso, A. (2005). “Fiscal Sustainability: the Unpleasant European Case”, FinanzArchiv, 61(1), 19-44.
Afonso, A., and Rault, C. (2007). “What do we really know about fiscal sustainability in the EU? A panel data diagnostic”, ECB Working Paper Nº. 820.
Afonso, A., and Sousa, R. M. (2009), “The macroeconomic effects of fiscal policy”, ECB Working Paper Nº. 991.
Afonso, A., Agnello, A.; and Furceri, D. (2008a). “Fiscal Policy Responsiveness, Persistence and Discretion”, ECB Working Paper Nº. 954.
Afonso, A., Agnello, A.; Furceri, D. and Sousa, R. M. (2008b). “Assessing Long-Term Fiscal Developments: a New Approach”, European Central Bank, manuscript.
Ahmed, S., and Rogers, J. (1995). “Government Budget Deficits and Trade Deficits. Are Present Value Constraints Satisfied in Long-term Data?” Journal of Monetary
Economics 36, 351–374.
Baglioni, A., and Cherubini, U. (1993). “Intertemporal Budget Constraint and Public Debt Sustainability: The Case of Italy,” Applied Economics 25, 275–283.
Bohn, H. (2007). “Are stationarity and cointegration restrictions really necessary for the intertemporal budget constraint?" Journal of Monetary Economics, 54(7), 1837-1847. Fatás, A., and Mihov, I. (2003). “The Case for Restricting Fiscal Policy Discretion”,
Quarterly Journal of Economics, 118, 1419-1447.
Fatás, A., and Mihov, I. (2006). “The Macroeconomics Effects of Fiscal Rules in the US States”, Journal of Public Economics, 90, 101-117.
Hamilton, J., and Flavin, M. (1986). “On the Limitations of Government Borrowing: A Framework for Empirical Testing”, American Economic Review 76, 808–816.
8
MacDonald, R. (1992). “Some Tests of the Government’s Intertemporal Budget Constraint Using U.S. Data”, Applied Economics 24, 1287-1292.
Quintos, C. (1995). “Sustainability of the Deficit Process with Structural Shifts”, Journal
of Business & Economic Statistics 13, 409–417.
Smith, G., and Zin, S. (1991). “Persistent Deficits and the Market Value of Government Debt,” Journal of Applied Econometrics 6, 31–44.
Trehan, B., and Walsh, C. (1991). “Testing Intertemporal Budget Constraints: Theory and Applications to U.S. Federal Budget and Current Account Deficits”, Journal of Money,
Credit, and Banking 23, 206–223.
Zellner, A., and Theil, H. (1962). “Three Stage Least Squares: Simultaneous Estimation of Simultaneous Equations”, Econometrica, 30(1), 54-78.
Appendix. Data description and sources
GDP
Data for GDP are quarterly, seasonally adjusted, and comprise the period 1978:1-2007:4. The source is the Bank of Portugal.
Price Deflator
All variables were deflated by the GDP deflator (2000=100). Data are quarterly, seasonally adjusted, and comprise the period 1978:1-2007:4. The source is the Bank of Portugal. Government Spending
The source is the Bank of Portugal, collected from the Monthly Bulletin of the Directorate-General of Public Accounting. Government Spending is defined as Central Government total authorized spending (on a cash basis). We seasonally adjust quarterly data using Census X12 ARIMA, and the series comprise the period 1978:1-2007:4.
Government Revenue
The source is the Bank of Portugal, collected from the Monthly Bulletin of the Directorate-General of Public Accounting. Government Revenue is defined as Central Government total revenue (on a cash basis). We seasonally adjust quarterly data using Census X12 ARIMA, and the series comprise the period 1978:1-2007:4.
Figure 1 – Recursive estimates, Wald tests, and debt and budget balance ratio (1978:1-2007:4).
1a – Recursive estimates for γ (significance level of 5%) 1c – Joint Wald test H0 :γikG =γikR ∧βikG =βikR
0,00 0,10 0,20 0,30 0,40 0,50 0,60 0,70 0,80 19 93Q 2 19 94Q 1 19 94Q 4 19 95Q 3 19 96Q 2 19 97Q 1 19 97Q 4 19 98Q 3 19 99Q 2 20 00Q 1 20 00Q 4 20 01Q 3 20 02Q 2 20 03Q 1 20 03Q 4 20 04Q 3 20 05Q 2 20 06Q 1 20 06Q 4 20 07Q 3 co ef fi cien ts 0,00 0,10 0,20 0,30 0,40 0,50 0,60 0,70 0,80 0,90 1,00 p-va lue s
significant γG not significant γG significant γR not significant γR wald test γG=γR
0,00 0,05 0,10 0,15 0,20 0,25 0,30 199 3Q 2 199 3Q 4 199 4Q 2 199 4Q 4 199 5Q 2 199 5Q 4 199 6Q 2 199 6Q 4 199 7Q 2 199 7Q 4 199 8Q 2 199 8Q 4 199 9Q 2 199 9Q 4 200 0Q 2 200 0Q 4 200 1Q 2 200 1Q 4 200 2Q 2 200 2Q 4 200 3Q 2 200 3Q 4 200 4Q 2 200 4Q 4 200 5Q 2 200 5Q 4 200 6Q 2 200 6Q 4 200 7Q 2 200 7Q 4 p-va lu es
1b - Recursive estimates for β (significance level of 5%) 1d - Debt and budget balance ratio
0,00 0,10 0,20 0,30 0,40 0,50 0,60 0,70 19 93Q 2 19 94Q 1 19 94Q 4 19 95Q 3 19 96Q 2 19 97Q 1 19 97Q 4 19 98Q 3 19 99Q 2 20 00Q 1 20 00Q 4 20 01Q 3 20 02Q 2 20 03Q 1 20 03Q 4 20 04Q 3 20 05Q 2 20 06Q 1 20 06Q 4 20 07Q 3 co ef fi cien ts 0,00 0,10 0,20 0,30 0,40 0,50 0,60 0,70 0,80 0,90 1,00 p-va lue s
significant βG not significant βG significant βR not significant βR wald test βG=βR
-14,0 -12,0 -10,0 -8,0 -6,0 -4,0 -2,0 0,0 2,0 4,0 197 3 197 5 197 7 197 9 198 1 198 3 198 5 198 7 198 9 199 1 199 3 199 5 199 7 199 9 200 1 200 3 200 5 200 7 budget bal anc e, % of G D P 0,0 10,0 20,0 30,0 40,0 50,0 60,0 70,0 80,0 debt -t o-G D P r a ti o, %
Budget Balance Debt