Introduction
Model Forest (MF) is a concept based on an innova-tive approach that combines the social, cultural and economic needs of local communities with the long-term management of sustainable forest landscapes (Brandt et al., 1996). MF is a partnership of public and private organizations that have a common interest in achieving sustainable forest management (SFM) within
a locally defined forest area. The International Model Forest Network (IMFN) is a voluntary association of partners (countries and organizations) from around the world working toward a common goal, which is the sustainable management and use of forests and forested landscapes. Each MF in the network is unique by virtue of its ecosystems, history of resource use, and the cul-tural and political realities that are in place. There are currently 55 MF initiatives catalogued by IMFN, among
A decision support system for a multi stakeholder’s decision process
in a Portuguese National Forest
J. Garcia-Gonzalo
1*, J. H. N. Palma
1, J. P. A. Freire
1, M. Tome
1, R. Mateus
1,
L. C. E. Rodriguez
2, V. Bushenkov
3and J. G. Borges
11 Instituto Superior de Agronomia. Centro de Estudos Florestais. Universidade Técnica de Lisboa. Tapada da Ajuda, 1349-017. Lisboa, Portugal
2 Departamento de Ciências Florestais. Escola Superior de Agricultura Luiz de Queiroz. Universidade de São Paulo. Avda. Pádua Dias, 11. 13418-900 Piracicaba, SP, Brasil 3 Centro de Investigação em Matemática e Aplicações. University of Évora. Portugal
Abstract
Aim of study: In this paper, we present a decision support system (DSS) to support decision making where different stakeholders have to generate landscape and forest level strategic plans. We further present an interactive approach that may take advantage of a posteriori preference modelling (i.e. Pareto frontier technique) to facilitate the specification of the levels of achievement of various objectives.
Area of study: The approach was applied to one planning cycle of a real world study case, the Leiria National Forest in Portugal. The Leiria National Forest, a managed area of approximately eleven thousand hectares in which 8,679 hectares are even aged stands of maritime pine (Pinus pinaster Ait) aimed at the production of wood.
Material and methods: The interactive approach, at first, tries to generate Pareto efficient frontiers for different objectives. Then, multiple decision makers are involved in the process to seek an agreement towards the definition of a consensual strategic plan.
Main results: The system developed in this article integrates an information management subsystem, a module to generate alternative management regimes, growth model routines and a decision module that generates and solves mathematical formulations. It also provides a module to display reports and view the resulting solutions (management plans). We also build the Pareto frontier for different criteria. The results show that the proposed DSS can help solve strategic planning problems subject to sustainable management constraints where people organize themselves and participate jointly to manage their natural resources.
Research highlights: The interactive approach facilitates the involvement of multiple stakeholders in the decision making process.
Key words: decision support system; participatory planning; linear programming; mixed integer goal program-ming; sustainable forest management.
* Corresponding author: [email protected] Received: 26-11-12. Accepted: 29-04-13.
Abbreviations used: decision maker (DM), decision support system (DSS), forest value (FV), international model forest network (IMFN), Leiria National Forest (LNF), model forest (MF), Portuguese National Forest Service (PNFS).
which there are four initiatives in Mediterranean countries.
Many countries have not labeled similar national initiatives as Model Forests, or even become members of the IMFN. Portugal, for instance, has a network of public forests that could be considered MF candidates due to the role they play in the local communities and their importance on building Portuguese rural and urban landscapes. This paper will refer to this Portu-guese network of prospective model forests as pilot forests, and describe how decision support systems (DSS) could help on converting these pilot forests into MFs. These forests may be used as study cases where multi objective planning techniques are used to cope with the set of conflicting interests that shape local rural and urban landscapes in Portugal.
The Leiria National Forest (LNF) was chosen as an example and it encompasses a public area covered by even-aged stands of maritime pine (Pinus pinaster Ait.). The area is managed to fulf ill multiple objec-tives: timber production, regulation of age class dis-tribution, sand dunes conservation, climate change mitigation and recreation. Simultaneously, the use of maritime pine by the timber industry plays an impor-tant role. This pine tree is a very imporimpor-tant species in Portugal, covering approximately 926 thousand hecta-res, or 27.2% of the total forested area in Portugal (AFN 2010). The sustainability of such landscape is challenged by the nature of the local climate. Dry and hot summers, and rainy winters, characterize the region and contribute to the fragility of the local ecosystem exposing it to high levels of fire risk (Scarascia-Mug-nozza et al., 2000).
The purpose of this research was to develop a DSS to generate strategic management plans for this Natio-nal Forest (e.g. to achieve a regulated age class area distribution and promoting biodiversity while sustai-ning timber supply objectives). In addition, this ma-nuscript further presents an interactive approach that may take advantage of a posteriori preference mo-delling (i.e. Pareto frontier technique) to facilitate the specification of the levels of achievement of various objectives. This may facilitate the involvement of mul-tiple stakeholders in the decision making process.
Material and methods
The interactive approach was applied to one planning cycle of a real world study case, the Leiria National
Forest in Portugal. The following sections are organi-zed in order to offer first a description of the LNF study case, followed by the presentation of the most impor-tant stakeholders involved in the decision process, and finally the main components of a multilateral stakehol-der and multiple objectives modular platform are laid out to assist the planning process. The general assump-tion is that, once data is available in a readable form, all stakeholders can interact with the system taking two basic steps.
The Leiria National Forest
The Leiria National Forest was chosen as a study case due to its importance in Portugal. The Portuguese National Forest Service aims at balancing the age class area distribution of the LNF. Whether taken as an in-termediate objective to achieve a final sustainable objec-tive, or not, this regulation approach requires quantitati-ve and qualitatiquantitati-ve methods for helping LNF managers to choose among many competing management alternati-ves in consonance with local communities aspirations. Fig. 1 shows a map of the Leiria National Forest, its even-aged stands of maritime pine and their age class distribution. The Leiria National Forest extends over an area of approximately 11,000 hectares; of which 8,679.5 are timber productive stands and the rest corresponds to a protection area along the coast mana-ged to prevent the erosion ofthe dunes and to pro-tect the stands located in the production area. The total area was divided into 367 homogeneous manage-ment units (MU) (Miragaia et al., 2000; Borges et al. 2003). A set of 342 units were identif ied as timber stands for the purposes of this study, and the protective stands were kept unmanaged. Timber stand areas range from 1 to 33 hectares. All stand divisions are kept clean and work as paths for harvesting access and fire control operations.
Logs harvested are the main timber product extrac-ted from the Leiria National Forest. Logs with large diameters harvested from clear cuts are the most valua-ble asset. Logs with smaller diameters also go to the market, and are usually extracted from thinning opera-tions or harvested from stands prescribed to be mana-ged according to short rotations. These different dia-meters are considered as different commercial sizes in the decision support system.
Timber prices vary according to the diameter class. Stumpage timber prices are established before
harves-ting as a function of average tree size in the stand. Prices per cubic meter used in this study conside-red the following values: 15 €/m3 for early
thin-nings (up to 20 years), 29 €/m3for thinnings in young
stands (20-30 years) and 40 €/m3for late thinned trees
(30 to 60 years) and 65 €/m3for wood from the final
harvest.
During the last decades, the Leiria National Forest has been managed with the main objective of
regula-ting age class area distribution. Even volume and in-come flow regulation over time have not been priori-tized. Severe fires in 2003 have significantly affected the age class distribution (9 10-year age classes are used) and the current area distribution among age classes is very uneven, with more than 50% of the total area concentrated in stands aging 10 to 34 yr (Fig. 2). A typical forest management regime at the Leiria National Forest consists of natural regeneration or Figure 1. Management units (stands) and age class distribution in the Leiria National Forest.
0 700 1,400 2,800 4,200 5,600 Meters N Leiria National Forest
Age class distribution
Initial Inventory 0-10] ]10-20] ]20-30] ]30-40] ]40-50] ]50-60] ]60-70] ]70-80] > 80
artif icial regeneration of approximately 2,500 seed-lings per hectare, followed by a pre-commercial thinning at age 15 years that leaves 1,500 residual trees per hectare. The need for thinning afterwards is che-cked every five years, from ages 20 to 50 years, usually leaving the stand with an average of 200 to 250 trees per hectare for final harvesting.
Rotation ages have been close to 80-90 years but there is a tendency to reduce it to 70-80 years. Residual basal area after a thinning results in values in the range of 18 to 24 m2/ha. Planting costs consider a f ixed
estimate for soil preparation (i.e. 448 € ha–1) and a
va-riable component accounting for the seedlings (i.e. 0.22 € plant–1). These operational costs were obtained
from the CAOF’s Database of ANEFA-The National Association of Forest, Agriculture and Environment Enterprises (www.anefa.pt).
Stakeholders
As economic, ecological and social objectives guide most of LNF forest managers’ decisions, interventions have to be scheduled seeking the mitigation of specific demands such as timber production, recreation, climate change mitigation, regulation of age class area distri-bution and sustainability. The offering of recreational activities for all local communities neighboring the national forest, for instance, has grown in importance as a response to the increasing demand. Stakeholders in such cases usually become vocal as leading repre-sentatives from local commercial associations, tourism officials and sport enthusiasts that organize themselves and formalize their demands in many different ways. Another important objective is the climate change mi-tigation where carbon sequestration may be used as a proxy of this objective.
Simultaneously, the use of maritime pine by the timber industry have also generated an important
demand. Their interests often conflict with non-timber and even with technical guidelines such as the rule that subjects the management of the LNF to the normal forest principle of maintaining the forested area in a well-distributed number of age classes (Clutter et al., 1983). Severe fires, though, including a large-scale event observed in 2003, have drastically affected the current distribution of hectares per age class. Consequently, the Portuguese National Forest Service (PNFS), appointed to prepare a new forest plan for the LNF, has emphasized the importance to recover and to balance again the area distribution among age classes. Appoted by the government to implement all operational in-terventions, the PNFS has acted as one of the most influential stakeholders in the planning process.
The situation and nature of the different stakehol-ders participating in the process create an appropriate environment to explore the use of a multi-participatory DSS. The approach taken to explore this opportunity first generates acceptable forest prescriptions and para-meterizes different and eventually conflicting goals. Immediately after, all stakeholders evaluate the results and interpret the consequences of different optimal strategies that are summarized in a graphical interface specially created to show the correspondent Pareto frontier.
The decision support system
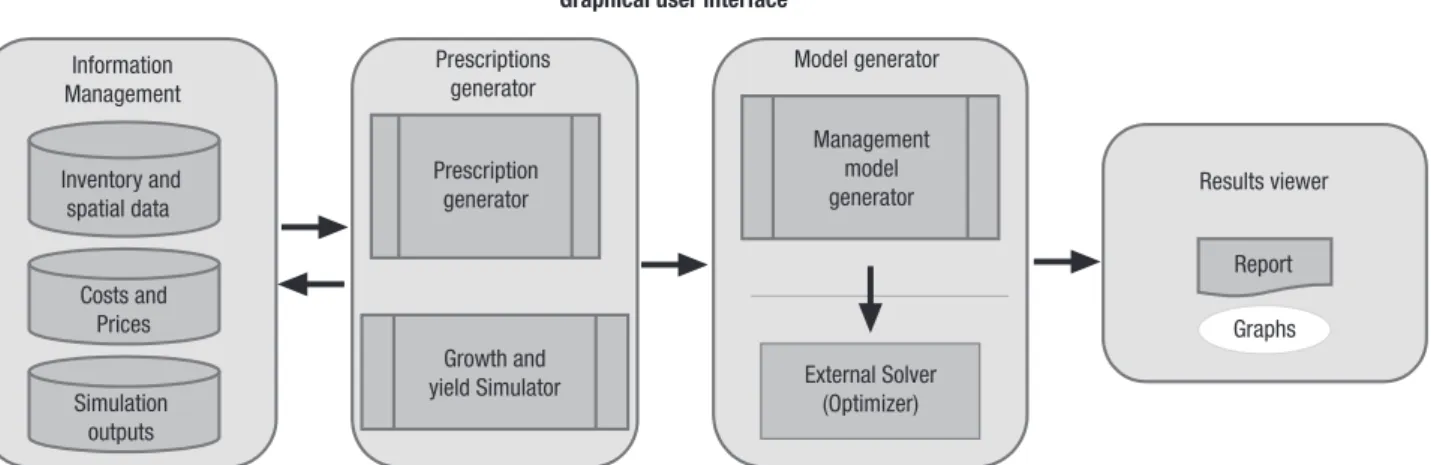
The main component assisting the stakeholders is a decision support system (SADfLOR v pp 1.0) that integrates four independent and compatible modules, encapsulated in one single graphical interface. The implementation uses the SADfLOR platform that integrates specific systems (such as the one presented in this article) to support management planning (Falcão and Borges 2005). The four modules are: information management, prescriptions generator, model generator and results viewer (Fig. 3).
All participants have access and can search the input data stored in the information management module. Maintained and regularly updated by the Portuguese Forest Service this module offers an interface to a very comprehensive relational database that stores all re-levant information about the target forest. The second module hosts a set of routines and growth and yield functions that allow the analysts to generate and explore the outcomes of different forest prescriptions. Once the participants agree on which forest prescrip-Figure 2. Age class distribution at year 2007.
Area (%) Cumulative area (%) 0-10 10-20 20-30 30-40 40-50 50-60 60-70 70-80 > 80 Age class Area (ha) Cumula tive area (%) 2,500 2,000 1,500 1,000 500 0 100 90 80 70 60 50 40 30 20 10 0
tions are allowed, a third module is available to assem-ble these alternative prescriptions into a consistent mathematical model which is solved, generating results that are preformatted back into the database to be viewed by the fourth module, the results viewer.
The management information module
The management information system (MIS) stores spatial and non-spatial information, including adminis-trative attributes of land units (e.g. forest stands or land units). It also stores topological data to allow spatial recognition of land units within the landscape. Further, it stores financial and economic data that will allow financial analysis for strategic management planning. The database architecture used in this module follows the INfLOR 2.1 guidelines (Miragaia et al., 1998; Marques and Borges, 2007). In addition, the module offers interfaces for the user to upload inventory data from TXT files and to enter timber prices and operation costs without the need to edit directly the internal data-base tables.
The prescriptions generator module
This module generates prescriptions for each land unit over time. The quality of a good DSS depends on the quality of the prescriptions generator (Davis et al., 2001). The prescriptions generator is instrumental for building reliable scenarios and policy models. This module integrates a prescription writer and a growth and yield model (García-Gonzalo et al., submitted;
Tomé et al., 2010). Based on the SADfLOR system de-veloped by Falcão and Borges (2005), the structure of the module is flexible and independent from other components of the system in order to allow updates and changes in the growth and yield simulator without affecting the rest of the system. In addition, different growth and yield models can be added to the system. The interface is built upon input forms that allow users to specify simulation parameters and silvicultural practices. The user can define ranges, for instance, for different parameters such as rotation length and initial planting density (Fig. 4).
The model generator module
Generally, forest management models require the generation of mathematical programming matrices to describe the decision problem (e.g. Bettinger et al., 2009). The model generator is designed to formulate forest management problems in three different versions, the linear programming (LP), the mixed integer pro-gramming (MIP) and goal propro-gramming versions (GP). The model generator reads outputs from the pres-criptions simulator (e.g. harvest volumes) and financial data from the management information module (i.e. interest rate, prices and costs) and creates the coeffi-cients for all needed equations in the problem formu-lation. The structure of the files with the generated ma-trices was designed to adjust to the requirements of the LP/MIP solvers. The generator module allows the user to choose from different problem types, for instance, unconstrained timber net present value optimization, timber net present value optimization subject to harvest Graphical user interface
Information Management Simulation outputs Results viewer Prescriptions generator Model generator GraphsGraphs Growth and yield Simulator Costs and Prices Management model generator External Solver (Optimizer) Prescription generator Inventory and spatial data Report
Figure 3. Structure of the DSS and the different modules. A graphical user interface allows the user to interact with all the
flow constraints, unconstrained age class regulation and timber net present value optimization, unconstrai-ned age class regulation and timber net present value optimization subject to net revenues flow constraints. The module is linked to an external solver (CPLEX), and can be also integrated to GNU open source LP/MMIP solvers. The forest management problem is defined accor-ding to a typical Model I formulation (Johnson and Scheurman, 1977). In order to analyze tradeoffs among plans with different objectives in the LNF, strategic models were formulated in linear programming (LP), and mixed integer goal programming (MIGP). In total, four tradeoff scenarios were considered: (i) unconstrai-ned maximization of the forest value; (ii) maximization of the forest value and regulation of volume harvested between subsequent periods; (iii) maximization of forest value and regulation of age class area distribu-tion; and (iv) maximization of forest value with regula-tion of both area distriburegula-tion among age classes and harvest flows.
The LP formulation was used to find targets for the forest value (FV) and maximum sustainable yield per period (i.e. 10-year periods) ensuring regulation of age class area distribution. These results were used as targets in the MIGP formulation. The complete for-mulation was defined as follows:
Max FV (for LP) or Min
(for MIGP) [1] subject to:
stand integrity
∀i [2]
forest value and net revenue accounting variables [3]
∀t [4]
wood control with accounting variables (for commer-cial size s and period t)
∀s,t [5] ∀s,t [6] ∀s,t [7]
Management models
(LP, MIP, GP):
•Maximization of SEV •Regulation of age distribution •Regulation of harvest flows 0 100 200 300 400 500 600 700 800 0 10 20 304050 60 70 80 90 100Prices
Costs
Production
indicators
: Volume cut Volume thinned Carbon above soilFinal report with production indicators and preliminary operations scheduling Prices Costs Production indicators: Volume cut Volume thinned Carbon above soil
Management models (LP, MIP, GP): • Maximization of SEV • Regulation of age distribution • Regulation of havest flows Optimization
Final report with production indicators and preliminary operations scheduling
Inventory data
Prescriptions Growth and Yield
simulations
∀s,t [8]
[9]
∀s,t [10]
age class control with accounting variables (for age class k and period t)
∀k,t [11] ∀k,t [12] ∀k,t [13] ∀k,t [14] ∀i,t [15]
0≤ xij≤ 1 for LP or ∈ {0,1} for MIGP ∀k,i [16] where:
FV = total net present forest value (includes value of the ending inventory).
Z* = mean percentage deviation from targeted wood production and age class sizes. dwmean = mean percentage deviation from targeted
wood production.
damean = mean percentage deviation from targeted age class sizes.
N = number of stands.
S = number of commercial wood sizes. T = number of periods in the planning horizon. Mi = number of prescriptions for stand i. Kt = number of age classes in period t. fvij = net present forest value of stand i if
assigned to prescription j (includes value of ending inventory).
xij = proportion of stand i managed according to prescription j for the linear pro-gramming (LP) formulation; and a bi-nary 0/1 variable that takes value 1 if prescription j is assigned to stand i, or 0
otherwise, for the mixed integer goal programming (MIGP) formulation. nrijt = net revenue in period t from stand i if
assigned to prescription j. NRt = total net revenue in period t.
wijt = volume of wood size s available in period t from stand i according to prescription j. Wst = total volume of wood size s harvested in
period t.
α = maximum allowed volume fluctuation (%) between two consecutive periods. TWst = target for wood size s harvested in period t. d+
TWst, dTW– st = positive and negative deviations (in per-centage) from target for wood size s of period t.
θijkt = binary 0/1 parameter that takes value 1 when prescription j assigns the area of the stand i into age class k in period t, and 0 otherwise.
Ai = total area (hectares) of stand i. ACkt = area in age class k in period t.
β = maximum allowed area deviation (%) from the ideal value (TACkt) for each age class k and period t.
TACkt = target area for age class k in period t (total area of the forest divided by the number of age classes).
dAC+kt, dAC–kt = positive and negative deviations (in percentage) from target for area of the each age class k in period t.
Equation [1] defines the two types of objective func-tions considered in the formulafunc-tions, FV is maximized in the linear programming formulation (LP), and the mean percentage deviation from targets is minimized in the mixed integer goal programming (MIGP) formula-tion. Equation [2] states that the area of a stand assigned to the different prescriptions cannot exceed the total area of the stand. Equations [3] and [4] endogenously calcu-late the total forest value (FV) and net returns (NRt). Equations [5] to [9] create accounting variables, devia-tions from production targets and total mean percenta-ge deviation for the control of timber wood production in each size class in each period. Equations [11] to [15] create accounting variables, deviations from age class targets and total mean percentage deviation from tar-gets for area control in each age class in each period. Equation [16] ensures that the decision variables take a value between 0 and 1 for the LP formulation and bi-nary values 0 or 1 for the MIGP formulation.
Four different tradeoff scenarios (Table1) were created by combining the LP and MIGP formulations presented in section “The model generator module”.
In order to generate the Pareto frontier between competing objectives, a multi-objective formulation was used with the objective of maximizing forest value, minimizing deviations from a target age class distribu-tion and maximizing carbon stock in the forest. For this purpose two new equations were created:
Max [17]
∀k,t [18] where Cstocktis the carbon stock in the forest ecosys-tem for period t, and cstockijtis the average carbon stock associated to prescription j in stand i in period t. Equation [17] used as an objective function aims to maximize average carbon stock in the forest ecosys-tem. In this case, in order to generate the Pareto frontier for three competing objectives we used equations [1] to [16] and [18]. The maximum fluctuation used to pa-rameterize constraints 6, 7, 12 and 13 was 30%. Once the Pareto frontier is approximated, and a final point is selected on the interactive decision map, the
corres-ponding feasible and non-dominated solution is evalua-ted according to the Reference Point Method (RPM) (Wierzbicki, 1981).
The results viewer module
Users were offered the opportunity to explore and analyze the results on an interactive interface. Each evaluation cycle generates a specific forest manage-ment strategy that affects differently each goal or targets set by different stakeholders and forest mana-gers. Tables and graphs are the main tools used by this module to interact with the decision maker (DM).
The prescription generator module was used to create possible silvicultural regimes parameterized by values that limit the age at which the forest is thinned and the thinning intensity levels for all 367 stands, over a planning horizon of one hundred years. Following the guidelines established by the Portuguese National Forest Service, the simulation of maritime pine prescriptions considered different rotation lengths and the thinning regimes for each land unit according to traditional silvi-cultural regimes used in the LNF. Clear cut ages varied from 50 to 95 yr, with a 5 yr interval. Potential thinning ages ranged from 20 to 50 yr, with a 5 yr interval. Thin-ning intensity was calculated using a relative spacing measure of stand density known as Wilson factor (Wilson, 1946) and follows the PNFS recommended value of 0.27. This value was applied to the Wilson factor formula, as in equation 19, to get the number of trees to thin.
[19] where Fw is the Wilson factor, Hdomis the dominant height and N the number of trees per hectare. In order to run this model the prescription simulator interprets inventory data and applies the possible prescriptions to each management unit.
Application of the participatory DSS in a study case The management problem for decision-making at the LNF was set up during interviews with the national forest service. Potential timber production in the LNF was estimated over medium to long periods in order to regulate age class distribution in the area. This is espe-cially important due to the current unbalanced age class distribution observed after the recent severe fires. Du-Table 1. Formulation of the analyzed tradeoff scenarios
Equations Equations Scenario used in LP used in the formulation MIGP
formulation Max FV Max FV
1. Unconstrained maximization Eqs. 2-5, 11 Eqs. 2-5, 11
of FV 0≤ xij≤ 1 xij∈ {0,1}
Max FV Min dwmean
2. Regulation of harvests flows Eqs. 2-7 Eqs. 2-5, 8-10 0≤ xij≤ 1 xij∈ {0,1}
Max FV Min damean
3. Regulation of age classes Eqs. 2-5, Eqs. 2-5,
11-13 11, 14-15
0≤ xij≤ 1 xij∈ {0,1}
Max FV Min Z*
4. Regulation of both age classes Eqs. 2-7, Eqs. 2-5, 8-11
and harvest flow 11-13 14-15
ring the interviews, forest managers highlighted the importance of analyzing trade-offs between regulation of age class area distribution, maximization of mone-tary incomes and maximization of carbon sequestration (as a proxy of climate change mitigation) taking into account regulation of harvest flows.
Previous planning processes in the area were deve-loped without using any computerized tool and without applying any type of operations research methods. In this context, the forest service was very supportive and participative in the development of the DSS described in this paper. The sequence of steps presented was implemented during a f irst planning cycle and the mathematical formulation mainly focused on conven-tional forest products to produce a reference scenario that was compared on subsequent planning cycles to full scale multi criteria (MC) formulations (see formulation). In this first planning cycle two different models were developed (i.e. LP, MIGP) to generate plans for the 100 years planning horizon (2007-2106). Approximately, 100 prescriptions to each management unit resulted in formulations with approximately 40,000 binary variables.
The MC model in combination with the mathema-tical formulations and interactive decision process culminated with the generation of the Pareto frontier graphs. These graphs and reports were presented to the managers supported by the viewer module. The last MC planning cycle relied on a posteriori preference modeling method to facilitate the specification of the levels of achievement of various objectives in a typical multi-objective forest management planning frame-work. The approach combines the use of mathematical programming and interactive decision maps techniques (Lotov et al., 2001, 2004). The method provides infor-mation about non-dominated points in the feasible set in the criteria space (FSCS) so that decision-makers may take advantage of trade-off information. The Pareto frontiers were then visualized as Decision Maps that can be investigated interactively by the DM to select an appropriate criteria combination (feasible goal) directly in the computer screen.
When the preferable goal is identified, the computer automatically calculates the decision variables of the model corresponding to the preferable goal. The main steps of the Interactive Decision Maps/Feasible Goals Method (IDM/FGM) technique are: (i) construction or approximation of the Pareto frontier; (ii) interactive display of decision maps; (iii) identification of a prefe-rable feasible goal; and (iv) computation of the
deci-sion corresponding to the preferable goal. The history of the development and applications of the IDM/FGM technique can be found in Lotov et al. (2001, 2004) and an application in forestry can be found in Borges et al. (2013).
This may be the mean to aggregate social and envi-ronmental goals in communal forest management. Par-ticipatory workshops could help to determine the opti-mal management plan once the selection of a point in the Pareto frontier is agreed among DMs.
Results
The proposed architecture for the DSS was used successfully to address the test problem. The prescrip-tion writer and the growth and yield simulator consi-dered many different management schedules. The in-terpretation of inventory data showed that most land units were occupied by fairly young maritime pine stands. In order to provide useful information to the forest service, the system was further used to assess the opportunity costs associated with the even-flow constraints. The strategic plans provide management planning information for each of the 342 stands along the 100 years planning horizon used (2007-2106). Fur-ther, the comparison of the four tradeoff scenarios used in the study helped to evaluate tradeoffs between strategic objectives of timber production in LNF and financial objectives for each stand.
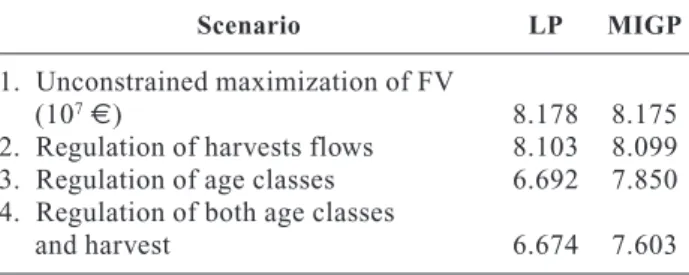
The solution of the four different formulations presents complete information for the strategic pro-blem defined by the Forest Service. For each scenario the maximum FV was computed (Table 2). This infor-mation is important in order to analyze the trade-offs between sustainable objectives. It is clear that adding sustainability constraints reduce significantly FV. The highest reduction was found when the maximum regu-lation of the age distribution was sought (Table 2). Table 2. Forest values (FV) observed for the four tradeoff scenarios
Scenario LP MIGP
1. Unconstrained maximization of FV
(107€) 8.178 8.175
2. Regulation of harvests flows 8.103 8.099
3. Regulation of age classes 6.692 7.850
4. Regulation of both age classes
The unconstrained financial optimization LP mo-dels were used to estimate potential production le-vels over the 100-year planning horizon. These po-tential production levels were used for the MIGP formulations in order to find the strategic plans for the whole LNF.
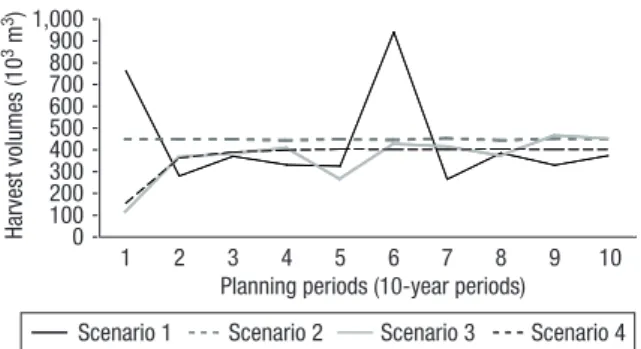
As expected the maximum FV was found for the un-constrained scenario. For the scenario with regulation of harvest flows, FV was reduced 4% (10-year pe-riods). For the scenario with fully regulated age class distribution the reduction in the FV value was even higher (i.e. up to 30%). The different tradeoff scenarios provided also an estimate of strategic sustainable tim-ber flows over the planning horizon (Fig. 5). Uncons-trained FV optimization concentrates cuttings in the first period and even some of the age classes were not represented anymore in the forest (i.e. most of the land units are harvested at ages between 50 and 60 years) (Table 3). Conversely, the regular flow constraints scenario proposed an even distribution of harvests over the planning horizon. Thus, the regulation of harvest
flows has an opportunity cost associated with the delay of final harvests.
Unconstrained forest value optimization resulted in a very unbalanced harvest flow (Fig. 5) and also did not improve the unbalanced age class distribution (Table 3). The regulation of harvest flows scenario re-sulted in a balanced flow of harvests, and a signif i-cantly high volume harvested per period (440,000 m3
per period). However, area distribution among age classes was not regular and most of the land units (i.e. 96% of the units) were cut at ages shorter than 60 years (Table 4).
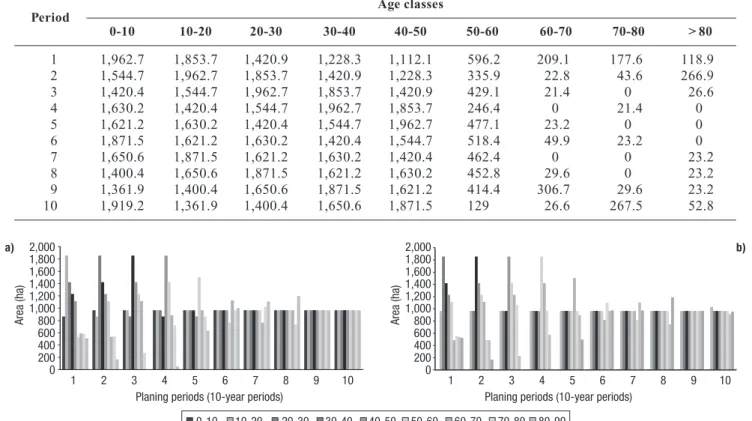
The harvest target was reduced when regulation of age classes was taken into account (tradeoff scenarios 3 and 4) and consequently forest value FV was also reduced. When regulation of age classes was sought and regulation of timber was not included (scenario 3), the age distribution was balanced after 50 years (Fig. 6). However, harvest flow was unregulated ran-ging from 109,000 m3to 460,000 m3(Fig. 5). Scenario
4 showed a very good balance between both the regulation of age classes and harvest flows with a slight decrease in FV compared to scenario 3. Even though the regularity in age classes was slightly sacrificed, a better balanced flow of harvests was obtained (with an almost constant harvest level of 360,000 m3after the
first period).
The Pareto frontier for the three criteria planning problem was generated (Fig. 7). The trade-off informa-tion highlighted the conflictive nature of the relainforma-tion- relation-ship between the forest value and carbon stock. For mean deviations from a target age class distribution overtime ranging from 0% to 50%, larger is the re-duction in the average carbon stock in the forest
0 100 200 300 400 500 600 700 800 900 1,000 1 234 56 789 10 Harvest volumes (10 3 m 3)
Planning periods (10-year periods)
Scenario 1 Scenario 2 Scenario 3 Scenario 4
Figure 5. Timber flows observed in the four tradeoff scenarios
using 10-year planning periods.
Table 3. Area in hectares in each age class for the unconstrained forest value optimization scenario (10-year planning periods) Period Age classes 0-10 10-20 20-30 30-40 40-50 50-60 60-70 70-80 > 80 1 3,025.3 1,853.7 1,420.9 1,228.3 1,112.1 39.2 0 0 0 2 954.5 3,025.3 1,853.7 1,420.9 1,228.3 196.8 0 0 0 3 1,312.2 954.5 3,025.3 1,853.7 1,420.9 112.9 0 0 0 4 1,425.8 1,312.2 954.5 3,025.3 1,853.7 108 0 0 0 5 1,326.2 1,425.8 1,312.2 954.5 3,025.3 612.3 23.2 0 0 6 3,637.6 1,326.2 1,425.8 1,312.2 954.5 0 0 23.2 0 7 954.5 3,637.6 1,326.2 1,425.8 1,312.2 0 0 0 23.2 8 1,303.9 954.5 3,637.6 1,326.2 1,425.8 8.3 0 0 23.2 9 1,126.5 1,303.9 954.5 3,637.6 1,326.2 307.6 0 0 23.2 10 1,633.8 1,126.5 1,303.9 954.5 3,637.6 0 0 0 23.2
ecosystem necessary to compensate increases in the forest value. A well balanced distribution of area
among age classes conflict with forest value, and less intensively with carbon stock. The relationship between a well-balanced age distribution among classes and forest value is more evident than with carbon storage. This trade-off information observed in the study case analysis allows DMs or points (e.g. points A and B) of the Pareto analysis that best reflect their concerns (Fig. 7).
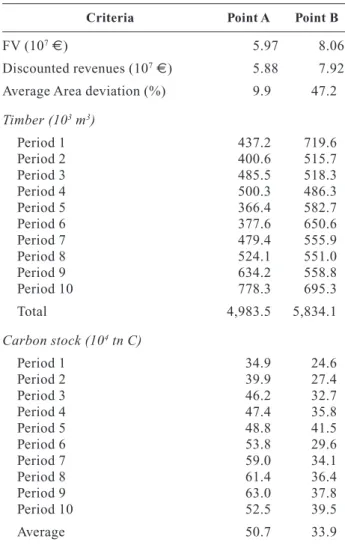
Table 5 illustrates points A and B chosen from the Pareto Frontier presented in Figure 7. While solution B would be associated with a DM concerned only on maximizing revenues, solution A results more balanced in terms of the conflicting goals. It achieves a more balanced age class distribution and a higher value of carbon stock in the forest. In contrast, point B although associated with a higher forest value, prescribes shorter rotations and almost eliminates old age classes (Fig. 8). Point A would probably be selected to convene a final solution, and the results viewer module can be activa-ted to provide all values for the decision and accounting variables. The ability of the Pareto frontier approach to eff iciently drive the analysis offers a very valua-ble tool.
Table 4. Area in hectares in each age class for the regulation of harvest flows scenario (10-year planning periods)
Period Age classes 0-10 10-20 20-30 30-40 40-50 50-60 60-70 70-80 > 80 1 1,962.7 1,853.7 1,420.9 1,228.3 1,112.1 596.2 209.1 177.6 118.9 2 1,544.7 1,962.7 1,853.7 1,420.9 1,228.3 335.9 22.8 43.6 266.9 3 1,420.4 1,544.7 1,962.7 1,853.7 1,420.9 429.1 21.4 0 26.6 4 1,630.2 1,420.4 1,544.7 1,962.7 1,853.7 246.4 0 21.4 0 5 1,621.2 1,630.2 1,420.4 1,544.7 1,962.7 477.1 23.2 0 0 6 1,871.5 1,621.2 1,630.2 1,420.4 1,544.7 518.4 49.9 23.2 0 7 1,650.6 1,871.5 1,621.2 1,630.2 1,420.4 462.4 0 0 23.2 8 1,400.4 1,650.6 1,871.5 1,621.2 1,630.2 452.8 29.6 0 23.2 9 1,361.9 1,400.4 1,650.6 1,871.5 1,621.2 414.4 306.7 29.6 23.2 10 1,919.2 1,361.9 1,400.4 1,650.6 1,871.5 129 26.6 267.5 52.8 0 200 400 600 800 1,000 1,200 1,400 1,600 1,800 2,000 12345 6789 10
Planing periods (10-year periods)
Area (ha) 0 200 400 600 800 1,000 1,200 1,400 1,600 1,800 2,000 Area (ha) 12345 6 789 10
Planing periods (10-year periods)
0-10 10-20 20-30 30-40 40-50 50-60 60-70 70-80 80-90
Figure 6. Age class distribution for the tradeoff scenarios 3 (a) and 4 (b).
a) b)
Figure 7. Pareto frontier for three different objectives,
maxi-mization of forest value (horizontal axis); maximaxi-mization of Cstock (vertical axis); and minimization deviations from a well distributed area per age class target (shades of gray bar).
60 55 50 45 40 35 30 4 4.5 5 5.5 6 6.5 7 7.5 8 8.5 VF (107€) •A Avg C stock (104t C) •B Deviation (%) 5 10 15 20 25 30 35 40 45 50
Discussion
The integration of a management information sys-tem, growth and yield models, interactive silviculture
modeling, and management models and solvers are key aspects of the architecture for a forest DSS. These ele-ments have been integrated in the framework of this research to interactively create a participatory planning environment.
In the framework of the LNF problem, this research confirmed the benefits of combining the use of a deci-sion process based on the generation of the Pareto fron-tiers. Moreover, it successfully integrated techniques that might assist a multi-lateral stakeholders planning process. During this f irst planning cycle, we followed the following steps identified by Davis et al. (2001) for building a model for forest planning problems: i) iden-tify the DM(s); ii) outline the objectives and constraints for the forest in question; iii) establish the perfor-mance/impact measures by which attainment of the objectives are measured; iv) determine the activities, constraints and decision variables (management al-ternatives); and v) determine the solution technique used to find the levels of decision variables that best achieve the multiple objectives and apply it to solve the planning problem.
The mathematical models generated useful informa-tion to analyze trade-offs between the different sustai-nability alternatives. Due to the highly unbalanced ini-tial age-class distribution, regulation may only be ob-tained after 50 years. If only timber production objective was taken into account, without paying any attention to sustainability constraints, the resulting plan would lead to stands younger than 60 years. This is because shorter rotations (50-60 years) are more profitable. Regulation of age class distribution would limit cuttings during the first periods of the planning horizon and would allow a smaller level of harvests over time.
The prescription writer and the growth and yield simulator worked fully integrated in the system and Table 5. Solutions in the feasible set of the criteria space
re-trieved by the Reference Point Method-points A and B from Fig. 7
Criteria Point A Point B
FV (107€) 5.97 8.06
Discounted revenues (107€) 5.88 7.92
Average Area deviation (%) 9.9 47.2
Timber (103m3) Period 1 437.2 719.6 Period 2 400.6 515.7 Period 3 485.5 518.3 Period 4 500.3 486.3 Period 5 366.4 582.7 Period 6 377.6 650.6 Period 7 479.4 555.9 Period 8 524.1 551.0 Period 9 634.2 558.8 Period 10 778.3 695.3 Total 4,983.5 5,834.1 Carbon stock (104tn C) Period 1 34.9 24.6 Period 2 39.9 27.4 Period 3 46.2 32.7 Period 4 47.4 35.8 Period 5 48.8 41.5 Period 6 53.8 29.6 Period 7 59.0 34.1 Period 8 61.4 36.4 Period 9 63.0 37.8 Period 10 52.5 39.5 Average 50.7 33.9 0 200 400 600 800 1,000 1,200 1,400 1,600 1,800 2,000 0 500 1,000 1,500 2,000 2,500 3,000 Area (ha) 1 Area (ha) 23 4 5 6 7 8 9 10 1 2 3 4 56 78 9 10 0-10 10-20 20-30 30-40 40-50 50-60 60-70 70-80 > 80
Planing periods Planing periods
Figure 8. Age class distribution corresponding to the management plans associated with points A and B in Fig. 7.
b) a)
consistently produced all data required during the mathematical model building phase. LP models are a good modeling tool to get harvest targets for the diffe-rent sustainability objectives. However, when imple-menting the management plan, managers may want to apply only one prescription to each stands, this calls for integer formulations. That is the reasoning to use MIGP methods.
In our approach, the LP model was used to calculate the target values for the MIGP model. In addition, the LP formulation also generated the Pareto frontiers, provided complementary results to be compared with MIGP results.
The predictions of outcomes and conditions, the coefficients used in linear programming, the values, and the numerical measures are all treated as if their values were known (Martell et al., 1998). But reality has many uncertainties. Stewart (2005) states that there are at least two broad categories of uncertainty that needs to be distinguished: external uncertainties, which are related to the consequence of our actions, and; internal uncertainties, which are related to the DM’s values and judgments. In addition, it is important to recognize that there are four levels of uncertainty in both categories, with two extremes: determinism at one end and total ignorance (uncertainty) at the other. Decision theory is of much help here as it allows the evaluation of decisions under uncertainty and risk. For instance, scenario analysis and exploratory multi-criteria decision analysis (Vanderpas et al., 2010) or stochastic approaches (Ferreira et al., 2011; García-Gonzalo et al., 2011; Ferreira et al., 2012) are mode-ling approaches that allow the exploration of multiple hypotheses about the future.
According to Reynolds et al. (2008), a clear focus on the decision making process and on the target user is among the crucial lessons learned from the successes and failures of decision support system development. If a system/tool attempts to do everything for everyone, it is likely to be too complex to use and it is unlikely that it will be adopted and actually used in practice (Reynolds et al., 2008). The development of this DSS has taken this into account as a series of meetings with the LNF managers were performed.
Another lesson learned from past development has been the need for transparency (Martins and Borges, 2007). DSS used as “black boxes” may produce good results and good information. However if stakehol-ders/users cannot follow the reasoning used by the system, they will not understand the information
generated and it is unlikely that they will accept its recommendations. This has been taken into account also as the prototype interfaces are easy to interpret, and the report module is linked to popular tools such as Excel for further information analysis.
Since the 90s, different countries have implemented the MF concept, focusing on the need to bring more stakeholders into the planning process, while also incor-porating a broader range of values into the decision making process. LNF managers have embraced the MF concept, as they strive to accomplish most of its prin-ciples. However, some steps are still needed to charac-terize the LNF as a MF, e.g. effective inclusion of local communities into the decision process. As such, the DSS presented in this paper may become very useful. During the second planning cycle the Pareto fron-tiers among several objectives were generated. This information may be instrumental to involve multiple stakeholders. Generating and visualizing the complete set of eff icient (i.e., Pareto optimal) (Pareto, 1909) solutions to forest planning problems should help the DMs to acquire a holistic view of the planning problem and should provide them with more information to select a best compromise management plan. The FGM/IDM technique acknowledges the role of the decision-makers and the importance of considering their preferences in the solution. However, our approach does not require the DM to specify a priori the levels of achievement of various objectives. This interactive approach provides this information by helping the user to select specific sections of the frontier (Miettinen, 1999; Lotov et al., 2004). This allows for the gain of insight about ecological and economic interrelations and generates the information needed for sound policy making. In addition, this methodology may overcome obstacles of a priori preference approaches such as some multiple attribute utility methods (Keeney and Raiffa, 1976)
Regarding National Forest Service’s objectives, other stakeholders are likely to have a range of different objectives depending on whether they belong to the community of forest managers or industry, the broad public or the academic and scientif ic communities (Fontes et al., 2010). Nevertheless, a broader participa-tory process will allow not only for the identification of other important objectives, but also the gathering of new and often hidden relevant data, the creation of insightful ideas and new potential options, and the evaluation of the proposed solutions (Martins and Borges, 2007).
Succinctly, we have presented a tool that supports a multi stakeholder’s decision process, and consequently might support effectively the process of managing MFs. This tool may eventually facilitate the process of incorporating the FM concept into the Portuguese network of public forests.
Acknowledgments
Partial support for this research was provided by Project PTDC/AGR-CFL/64146/2006 “Decision support tools for integrating f ire and forest management planning” funded by the Portuguese Science Founda-tion, by projects MOTIVE (Models for Adaptive Forest Management) and INTEGRAL (Future-oriented inte-grated management of European forest landscapes) funded by 7thEU FP as well as from the ForEAdapt
project, funded by the European Union Seventh Frame-work Programme (FP7-PEOPLE-2010-IRSES) under grant agreement n° PIRSES-GA-2010-269257 and the FORSYS Forest Management Decision Support Systems Cost Action (FP0804). The authors wish to acknowledge the Portuguese Forest Service for pro-viding the inventory data, maps and information for the study. Authors would like to thank the Portugu-ese Science Foundation for funding the PhD of João Freire ‘‘SFRH/BD/75568/2010” and Ricardo Mateus “SFRH/BD/77378/2011”. Finally, authors would like to thank the two anonymous reviewers for their valua-ble comments and suggestions to improve the article.
References
Autoridade Florestal Nacional (AFN), 2010. Inventário Florestal Nacional 2005-2006 – Portugal Continental, ed. Autoridade Florestal Nacional, Ministério da Agricultura do Desenvolvimento Rural e das Pescas, Lisbon, Portugal. Bettinger P, Boston K, Siry J, Grebner DL, 2009. Forest
ma-nagement and planning. New York, Academic Press. Borges JG, Falcão A, Miragaia C, Marques P and Marques
M, 2003. A decision support system for forest resources management in Portugal. In: System analysis in forest resources (Arthaud GJ, Barrett TM, eds). Kluwer Acade-mic Publishers. Managing Forest Ecosystems 7: 155-164. Borges JG, García-Gonzalo J, Bushenkov VA, McDill ME, Marques S, Oliveira MM, 2013. Addressing multi-criteria forest management with Pareto Frontier methods: an application in Portugal. Forest. http://dx.doi.org/10.5849/ forsci.12-100.
Brandt DG, Bouman OT, Bouthillier L, Kessler W, Lapierre L, 1996. The model forest concept: a model for future forest management? Environmental Reviews 4(1): 65-90.
Clutter JL, Forston JC, Pienaar LV, Brister GH, Bailey RL, 1983. Timber management: a quantitative approach. Wiley, New York.
Davis LS, Johnson KN, Howard T, Bettinger P, 2001. Forest management. McGraw Hill Publishing Company, New York.
Falcão A,Borges JG, 2005. Designing decision support tools for Mediterranean forest ecosystems manage-ment: a case study in Portugal. Annals of Forest Science 62: 751-760
Ferreira L, Constantino M, Borges JG, García-Gonzalo J, 2012. A stochastic dynamic programming approach to optimize short-rotation coppice systems manage-ment scheduling. An application to eucalypt planta-tions under wildfire risk in Portugal. Forest Science 58(4): 353-365.
Ferreira L, Constantino M, Borges JG, 2011. Optimizing management of Pinus pinaster Ait stands, under risk of f ire. An application in Portugal. Annals of Operational Research.
Fontes L, Bontemps JD, Bugmann H, Van Oijen M, Gracia C, Kramer K, Lindner M, Rötzer, T, Skovsgaard JP, 2010. Models for supporting forest management in a changing environment, Forest Systems 19(SI): 8-29
García-Gonzalo J, Pukkala T, Borges JG, 2011. Integrating fire risk in stand management scheduling. An application to Maritime pine stands in Portugal. Annals of Operational Research.
García-Gonzalo J, Borges JG, Tomé M, Zubizarreta-Geren-diain A, Submitted. A new tool for simulation and optimi-zation of small scale forestry. A stand management pro-blem in Leiria National Forest.
Johnson KN, Scheurman HL, 1977. Techniques for prescri-bing optimal timber harvest and investment under diffe-rent objectives – Discussion and synthesis For Sci Monogr No 18. 31 pp.
Keeney R, Raiffa H, 1976. Decisions with multiple objec-tives: preferences and value tradeoffs, Wiley, 569 pp. Lotov A, Bushenkov V, Kamenev G, 2004. Interactive
deci-sion maps: approximation and visualization of pareto frontier, series: applied optimization. Vol 89, Kluwer Aca-demic Publishers. 310 pp.
Lotov A, Bushenkov V, Kamenev G, 2001. Feasible goals method: search for smart decisions. Computing Centre of Russian Academy of Ciences, Moscow. 240 pp. Marques S, Borges JG, 2007. Relatório de execução do
sistema de gestão de informação INfLOR 2.1. Departa-mento de Engenharia Florestal, ISA, Lisboa. 23 pp. Martell D, Gunn E, Weintraub A, 1998. Forest management
challenges for operational researchers. European Journal of Operational Research104: 1-17.
Martins H, Borges JG, 2007. Addressing collaborative planning methods and tools in forest management. Forest Ecology and Management 248: 107-118.
Miragaia C, Borges JG, Falcão A, Tomé M, 1998. InFlor, a management information system in forest resources. In: Modelling the growth of tree plantations and agroforestry systems in South and East Africa (Pukkala T, Eerikainen
K, eds). University of Joensuu, Faculty of Forestry Re-search Notes 80(1998). pp: 131-142.
Miragaia C, Borges JG, Tomé M, 2000. InFlor, um sistema de informação em recursos florestais. Aplicação em ges-tão na mata nacional de leiria. Revista Florestal XII(1/2). pp: 51-56.
Miettinen KM, 1999. Nonlinear multiobjective optimization, Kluwer Academic Publishers.
Pareto V, 1971. Manual of political economy, 1909. English translation by Kelley AM, New York, 1971.
Reynolds KM,Twery M, Lexer MJ, Vacik H, Ray D, Shao G, Borges JG, 2008. Decision support systems in natural resource management. In: Handbook on decision support systems (Burstein F, Holsapple C, eds). Springer, Interna-tional Handbooks on Information Systems Series. Hand-book on Decision Support System 2: 499-534.
Scarascia-Mugnozza G, Oswald H, Piussi P, Radoglou K, 2000. Forests of Mediterranean region: gaps in knowledge and research needs, For Ecol Manage 132: 97-109. Stewart TH, 2005. Dealing with uncertainties in MCDA. In:
International series in operations research & management
science (José F, Salvatore G, Matthias E, eds). Vol. 78, Springer, New York. pp: 445-466.
Tomé M, Borges JG, Palma J, García-Gonzalo J, Freire J, 2010. Simulação de planos estratégicos para a mata nacio-nal de Leiria. Technical report, FORCHANGE, Instituto Superior de Agronomia, Lisboa. p: 32.
Vanderpas JWGM, Walkera WE, Marchaua VAWJ, Vanweea GP, Agusdinata DB, 2010. Exploratory mcda for handling deep uncertainties: the case of intelligent speed adapta-tion implementaadapta-tion. Journal of Multi-Criteria Decision Analysis 17: 1-23.
Wierzbicki A, 1981. A mathematical basis for satisf i-cing decision making. In: Organizations: multiple agents with multiple criteria (Morse J, ed). Berlin, Springer. pp: 465-485.
Wilson F.G, 1946. Numerical expression of stocking in terms of height. J For 44: 561- 758.
Wierzbicki A, 1981. A mathematical basis for satisf i-cing decision making. In: Organizations: multiple agents with multiple criteria (Morse J,ed). Berlin, Springer. pp: 465-485.