LOURENÇO T, MATIAS L, FARIA P (2017), Anomalies detection in adhesive wall tiling systems by infrared thermography. Construction and Building Materials, 148, 419-428 (September 2017),
https://doi.org/10.1016/j.conbuildmat.2017.05.052
Anomalies detection in adhesive wall tiling systems by infrared thermography
Tomás Lourenço1, Luís Matias2, Paulina Faria3
1Dep. Civil Engineering, Universidade NOVA de Lisboa, 2829-516 Caparica, Portugal,
2National Laboratory of Civil Engineering (LNEC), 1700-66 Lisbon, Portugal, [email protected]
3CERIS and Department of Civil Engineering, Universidade NOVA de Lisboa, 2829-516 Caparica,
Portugal, [email protected]
Abstract
Adherent tiling systems are widely used all over the world as wall cladding because of their aesthetic and technical characteristics. However, anomalous behaviours often occur; compromising the overall behaviour of facades, and possibly raising safety risks. The need to create expeditious, non-destructive and accurate methods of inspection that can encourage these systems’ inspection and maintenance fomented a research study on infrared thermography’s capacity of early detect anomalous zones in adhesive tiling systems, such as detachments or presence of humidity, in controlled in situ conditions, proving it as a valuable diagnostic tool.
Keywords: wall tiling system, anomaly detection, detachment, NDT, infrared thermography
1. Introduction
Adherent tiling systems are one of the most used wall cladding techniques in several countries. Despite widely used due to its known aesthetic and technical characteristics, it is considered as a complex system, being composed by three components with different characteristics, purposes and technical requirements: the adhesive grout [1], the tiles [2] and the joint filling grout [3].
The complexity of this cladding system makes it vulnerable to numerous possible anomalies that can compromise the systems’ purpose of cladding the wall, protecting it against weathering agents. Among the anomalies that can occur in this kind of cladding - such as the tiles’ cracking, detachment
of the tiles’ glaze, efflorescences -, lack of adhesion and detachment of tiles deserves special attention. This happens not only because tiles detachment is the most commonly verified anomaly in adherent tiling systems - representing approximately 50% of the verified anomalies [4, 5] or even reaching 71% in the case of Brasília [6] - but also because of the consequences it comes with, implying the loss of the cladding’s aesthetic purpose, its functional requirements and raising safety risks.
Detachment of tiles occurs either due to lack of cohesion of the mortar which is traditionally applied to level the surface of the wall or because of loss of adhesion between at least two of the following layers: the support (in this case the surface of the wall to be cladded), the adhesive grout and the tile. At first the loss of adhesion gives place to an empty space that can be filled with air or water. The problem usually evolves into a complete detachment and consequent falling of the tile. In the meantime, especially if the detachment is provoked by thermal expansion [7], the tiles´ buckling can be observed. The earlier phase, characterized by the lack of adhesion between components, is the one that will be studied and, therefore, tiles with lack of adhesion will be named as detached, despite not being actually separated from the wall. Besides the mentioned problems, there is the fact that this anomaly can only be detected by contact and sometimes destructive methods (such as percussion method, sphere-crash test, ultrasounds or pull-off [8, 9]). Furthermore, there is no easy way of solving it but removing and re-adhering the tiles, which in some cases is very difficult due to dimensional variations. The injection of a grout to re-adhering the tiles can be used in a preliminary phase, when the detached tile is not yet significantly displaced from their original position.
Given all the inconvenience and limitations associated with this anomaly it is necessary to study more practical and expeditious methods of inspection, capable of detecting anomalies in a preliminary phase.
Infrared thermography (IRT) is a non-destructive (NDT) and non-contact testing method that consists in measuring the thermal radiation that comes from a surface and transform it into electrical signals
different colours correspond to different temperatures, according to a defined scale.
Despite these NDT’s raising recognition as a building inspection method, being currently used to
analyse for example the existence of thermal bridges, lack of thermal insulation, air
infiltrations/exfiltrations, presence of moisture or anomalies in waterproofing systems [10, 11], at the moment there are no standards covering its use on tiling systems’ inspections. Therefore, following the examples of some studies already made on tilling systems’ inspections [12-16] or directly related subjects, for example detection of moist in waterproofing systems or detection of detachments in renders [17-24], it is important to continue the study of this NDT’s capacities under different conditions to promote its acceptance.
Despite IRT’s capacity in detecting moisture problems has already been proven in situ [14, 16, 22-28] and being not an anomaly specifically related with tiling systems, as it can happen in almost all kinds of constructive solutions; there are two main reasons that lead to believe that humidity detection in tiling systems is considerably different from its detectability in other claddings. In first place the different characteristics between this system’s components, which are known as a challenge to an infrared inspection. In second place, the very low water absorptivity of some tiles (especially the porcelain tiles) which makes it very difficult for the water to be present within the tiles. Hence, unlike in other kinds of façade finishing coatings such as plasters or porous stone claddings, water will only be present either beneath the tile (which might difficult inspections) or over it (visible to the human eye). However, as water evaporation is an endothermic reaction inducing local surface cooling [24, 25], it is considered that, with solar heating, a cooler zone will be noticed when water is introduced beneath the panels. Therefore, studying the humidity detection in this kind of cladding is considered important.
2. Infrared Thermography and anomalies’ detection in building facades
In order to understand infrared thermography it is needed to perceive some basic principles on heat transfer by radiation. Every time there is a temperature differential, energy flows in three different ways: conduction, convection or radiation (obviously the most important to understand when studying
IRT).
Thermal radiation (whose wavelengths are between 0.1 μm and 100 μm) is mainly composed by a infrared radiation (0.78 μm to 100 μm) and is a product of every body’s capacity in emitting energy according to their emittance (capacity to emit radiation in comparison with the maximum efficiency of a black body), regardless off the wavelength and direction.
Each body, at a given temperature, emits radiation in many wavelengths; however, according to Wien’s law of thermal radiation, each temperature corresponds to an emitted wavelength of maximum power. For instance, in the case of the tiling systems whose temperatures are between 15°C and 70°C, the maximum emissive power corresponds to wavelengths between about 8.5 μm and 10 μm. Therefore, in order to read the temperature from a surface, just like photography captures visible radiation (with wavelengths between 0.4 μm and 0.78 μm) to create images, the infrared cameras used in building inspections capture radiation with wavelengths mostly comprehended between 7.5 μm and 13 μm.
Despite being a reasonably simple method of inspection (especially when leading qualitative surveys) it is needed to understand how thermal radiation (mainly infrared) interacts with bodies in order to achieve the most accurate and fit to the purpose thermograms, just like photographers play with light in order to achieve the aimed photos.
When radiation reaches a body, three processes can occur: absorption, transmission and reflection [29]. Despite thermal cameras being designed to “transform” the readings of emitted radiation in temperature graphics, this is not the only portion of radiation that comes to the camera. Therefore, in order to achieve accurate thermograms, the equipment must be able to “separate” emitted radiation from the resting portions of radiation reaching it - such as the reflected radiation, the radiation emitted by the atmosphere between the camera and the surface and the result of atmospheric attenuation -function of the atmosphere’s transmissivity - towards all the portions of radiation [30]. Thus, in order to minimize the errors in the thermogram some aspects must be taken into account such as the
shadowing elements in the surroundings and the introduction of the parameters asked by the equipment as accurately as possible (such as the emissivity of the object, air temperature, relative humidity, reflected temperature and distance to the target) described in [31].
The principle behind anomalies’ detection in building facades (including tiles’ detachment detection) is that anomalous areas will have a different behaviour towards heat transfer, creating superficial thermal differentials. So, in order to identify an anomaly, it is almost always needed the imposition of thermal variations to the target in study using the adequate technique, as factors such as the anomaly deepness or dimension will certainly influence the inspection. Thus, the right thermographic method must be adopted in order to properly identify the anomaly that is being looked for. Thermographic techniques are usually divided in analysis techniques and imaging techniques.
There are two imaging or data acquisition methods: the passive method (PIRT) and the active method (AIRT). The active method (AIRT) consists in applying a thermal variation on the specimen for example through the incidence of radiation from a lightbulb. The imposed thermal variation can either be from the side of the reading (reflexion method, used to find more superficial anomalies) or the opposite side (transmission method, used on more deep anomalies). PIRT, on the other hand, consists in the interpretation of superficial temperatures without the appliance of any artificial mean of thermal variation [29]. Thereby, the thermal variations that can lead to a diagnosis are due especially to a heat flow through the inspected element imposed for example by solar radiation. This last method is obviously the most practical and fit to building facades’ inspections.
In order to analyse the data obtained during a survey there are two analysis techniques: the qualitative - more practical and intuitive, does not need much accuracy as it is based on comparing the thermal patterns in search of anomalies; the quantitative - a more rigorous method, used overall in laboratory, which needs as most accuracy as possible as it is based on the real temperatures’ numerical analysis.
The main objective of the presented work is to prove the capacity of IRT in identifying anomalies, mainly detachments but also humidity detection, in tiling systems. Therefore, the methods in use shall be the simplest and practical so that they can easily be applied in actual building inspections. Hence,
after a previous active and quantitative analysis in laboratory [31], the results of surveys done in outdoors conditions using passive thermographic methods on two experimental cells with wall tiling systems will be presented and analysed. The identification of anomalous areas will be performed in a visual and qualitative way. As it is considered that in this phase of the method’s acceptance it is needed to prove the results numerically, a quantitative analysis will also be performed.
3. Study Methodology
In order to analyse the possibility of early detecting detached tiles using IRT, before the anomaly turns visible and too late to be repaired easily and without compromising safety, several measurement campaigns were performed during summer of 2016 on small buildings (experimental cells) exposed to natural conditions.
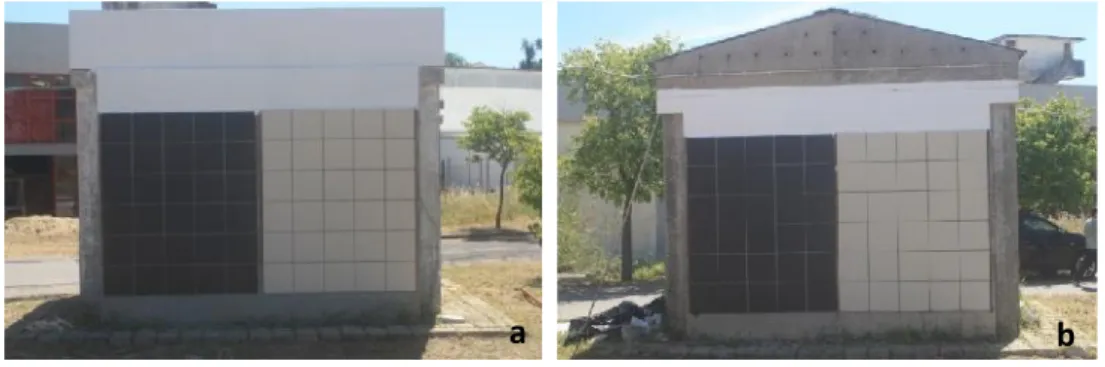
Four tiled panels were applied on two West facing facades (figure 1) of two experimental cells situated in National Laboratory for Civil Engineering (LNEC) Campus, Lisbon, Portugal. Panels have differences in terms of the tiles’ colour and kind of support. Cell 1 tiled panels were applied as finishing coating of ETICS (External Thermal Insulating Composite System). Therefore, a thermal insulation is beneath the tiling system. Cell 2 tiled panels were applied on a traditional solution of a brick masonry cementitious regularization render. Each cell had then two panels, one with black tiles (on the left) and one with white tiles (on the right).
Figure 1 – Experimental cell 1 (a) and experimental cell 2 (b)
After cleaning both the facades and applying an ETICS system (with 4 cm of EPS with a thermal
a
b
conductibility of 0.037 W/m·°C) in cell 1 the panels were realized using the following materials: – Adhesive grout - Cementitious flexible tile adhesive applied in a single layer with a 9 mm
notched trowel.
– Tiles – Black and white porcelain tiles (30 x 30 x 8.2 mm3) with rectified edges and natural finishing with 8.1- 8.3 mm of thickness and water absorption lower than 0.5%.
– Joints – 5 mm joints using a cementitious grout with organic and inorganic admixtures and
mineral pigments, waterproof and reinforced with fibres.
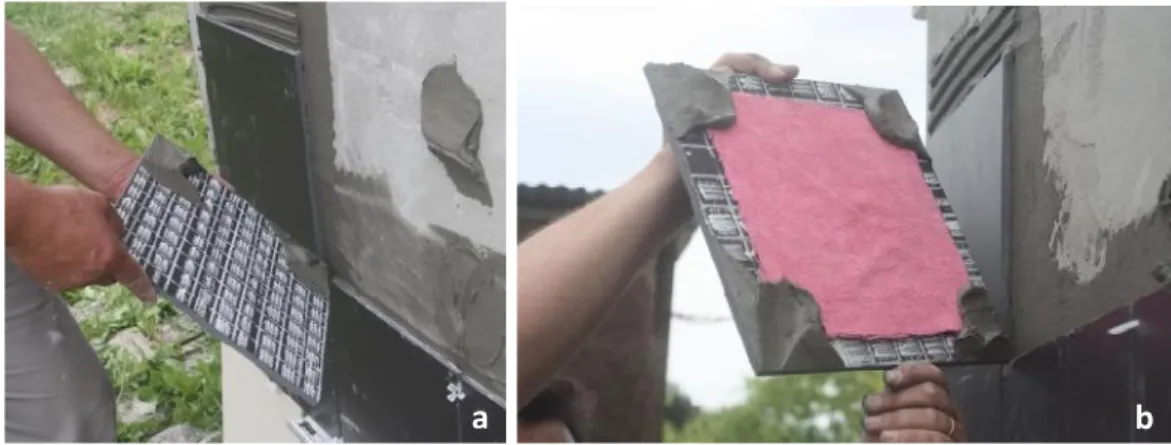
Purposely within each panel there are tiles with provoked detachments. The detachments were simulated by leaving an empty space approximately between 2 and 3 mm beneath the tile where the adhesive grout was not applied (figure 2a). Each panel had also one tile on its top (figure 2b) where a piece of cloth was placed in the detached area aiming to help in further moisture testing by trapping the injected water and preventing runoffs. In order to prevent infiltrations before the moisture testing, a polyurethane sealant was used to seal the panel’s edges.
The tiles were applied by specialized workers following the requirements to ensure the adhesion of the “control” tiles. The type of adhesive grout, tiles and joints were the same in both cells. Furthermore, the tapping control test was successfully used to ensure the tiles’ adhesion.
For moisture detection the water was introduced beneath the two top detached tiles of each panel by a syringe inserted through the panels’ edges sealant. The volume of water injected was decided by estimating the volume of the empty space beneath the detached tiles and early evaporation or
absorption by the support could not be controlled.
Figure 2 shows the anomalies’ simulation (detached tiles and detached tiles with a cloth beneath).
Figure 2 – Simulation of the anomalies of detachment (a) and placement of the water absorptive cloth beneath a tile (b)
The positioning of the detached tiles within each panel is the same for all the four panels according to the scheme on figure 3. On the same figure, it is possible to see the positioning of thermocouples type T - Copper/Constantan - that were placed beneath the tiles, in the adhesive layer, in order to allow continuously reading of temperatures and, therefore, reinforce the thermographic data. Those
a
b
results were presented elsewhere [31].
Figure 3 – Schematic representation of the panels with the detached anomalies and instrumentation To analyse both the possibility of early detecting detached tiles, before visible signs could be observed, using IRT and which is the best period of the day for the inspection using the passive method, a measurement campaign was done during one day in which thermograms were taken periodically.
Besides the thermocouples, the equipment used in this survey was the ThermaCAM P640 from FLIR Systems [32], characterized by a spectral range between 7.5 μm and 13 μm and a FPA system with uncooled microbolometric detectors.
As mentioned, in order to achieve accurate thermograms some parameters must be defined to minimize the errors. So, before/during the survey the following parameters were gathered:
– Emissivity – This parameter is certainly the most important to define in a thermographic inspection,
especially for low emissivity materials where a small variation in the emissivity value might cause a considerable variation in the temperatures. The method used to determine this value was the “black tape method” which consists in using a pre-calibrated tape whose emissivity is already known to determine the material’s (in this case the tiles) emissivity value. So, after attaching a
piece of tape to the tiles, they were heated at the temperature they are expected to reach in the survey, and a thermogram with the emissivity value of the tape is taken to determine its temperature. The emissivity value is then iterated until the temperature of the tile equals the temperature measured on the tape which corresponds to the tile’s emissivity. In this study, the emissivity value of 0.88 was previously measured in laboratorial conditions using specimens built of the same tiles.
– Reflected temperature – In order to reduce the error caused by reflected radiation, this parameter
was obtained using the reflection method described in the camera’s manual [32]. This method consists in measuring the temperature of a folded and re-flattened piece of aluminium sheet (surface characterized by a highly diffuse reflectivity) using the thermal camera with the emissivity value set to 1. This temperature will then be set in the equipment that uses it as the temperature (thermal radiation) that hits the inspected element being reflected depending on the specimen’s reflectivity. This parameter was determined before each thermogram.
– Ambient temperature – This parameter is used so that the camera can make adjustments to the
measurements by calculating the emission of radiation by the atmosphere between the target and the camera. The temperature was measured using the thermo-hygrometer Rotronic Higrolog.
– Relative humidity – Using the same equipment this parameter was obtained to minimize errors
due to the atmosphere’s attenuation as it is necessary so that the camera can calculate the atmosphere’s transmissivity.
– Distance – Besides its influence in the resolution of the image, together with relative humidity this
value (measured using a measuring tape) is used to estimate atmosphere’s attenuation [30].
With all the parameters obtained the thermograms were taken hourly (with the exception of the “critical periods” of: beginning of solar irradiation or beginning of the facade’s shadowing; where a higher
speed.
Basically, each survey consisted in 5 thermograms taken periodically and perpendicularly to each experimental cell: two thermograms (2.1 m from the panel) in which firstly the top three rows of tiles were captured and then the bottom three; two similar thermograms to the other panel in the same cell; and finally a general thermogram containing both the two panels (3.6 m from the panel). This survey will also be briefly compared with a previous similar survey made before the joints between tiles being closed [33].
After the thermographic analysis of the detachments, water was injected beneath the tiles in order to verify moisture detectability using the NDT. For that purpose, water was introduced beneath the two top detached tiles of each panel using a syringe. The deformability of the waterproof polyurethane sealant used to seal the panel’s edges allowed the use of syringes to introduce water without damaging the system.
As stated, the two detached tiles application was different, as each panel’s left detached tile (named as CT) had a piece of cloth beneath. This material was used because of its absorptivity that would trap the water and “distribute” it evenly beneath tile. The tile on the right (DT) is a “simply” detached tile, prepared just like the other already mentioned detached tiles.
Previously to humidity testing survey, thermographic inspections were made both after rainy days and right before the survey in order to verify the watertightness of the tiled panels. Without any thermal differentials indicative of water presence, the humidity testing consisted in injecting a maximum amount of water beneath each panel (see section 4.2). The water was introduced in the morning and thermograms were taken during the rest of the day. It is also important to refer that the surveys were done in sunny days and the water used was left in a bucket outside to equal the water temperature
with the air / tiles’ temperatures.
4. Results’ analysis
4.1 Detachments’ detection
As a first result of this survey, figures 4 and 5 show two sequences of thermograms where the thermal variations during the same day are presented for each experimental studied cell. Therefore, on figure 4 there are three general thermograms: the first in the morning - before solar incidence (air temperature: 24ºC); the second after one hour of solar incidence (air temperature: 30ºC) and the third at night - cooldown period (air temperature: 21ºC) of the experimental cell 1. In each case the black panel (C1_B) is on the left and the white panel (C1_W) is on the right. Similarly, figure 5 contains three thermograms, each with a black panel (C2_B) on the left and a white panel on the right (C2_W). In the thermograms, black panels appear in reddish colours due to the higher emitted temperature when compared with the white panels (represented in bluish colours). The temperature scale had to be adopted to each thermogram containing both black and white panels (with major thermal differences between them), which compromises the visibility of smaller thermal differences such as the ones that suggest anomalies. As mentioned, for analysis purposes two thermograms per panel were taken from closer distances allowing a narrower scale adoption and, therefore, facilitating the anomalous spots visualization. It is of note that thermograms from figure 4 and 5 are not in the same
thermal scale.
Figure 4 - C1 (ETICS) at 9:30 am (a); 3:30 pm (b) and 10:15 pm (c)
Figure 5 - C2 (rendering system) at 9:30 am (a); 3:30 pm (b) and 10:15 pm (c)
Analysing qualitatively the thermograms it is possible to take the following conclusions, which are consistent with the results obtained in a previous survey with open joints [33]:
– Comparing thermograms with the schematic representation of the anomalies (figure 3) it is
observable that, in general, detached tiles are easy to detect on thermograms, a finding consistent with other studies that confirm the possibility of detachment’s detection [12-16].
– In the morning – without solar incidence – the detached tiles are difficult to distinguish, especially
in the ETICS panels.
– Anomalies are easier to detect on the beginning of solar radiation’s incidence and in the beginning
of the cooldown on both experimental cells and tiles colour.
– As expected, temperatures are higher on darker (black) panels as the absorption of radiation is
higher. This happens because of differences between the two colours in terms of radiation absorptance. In a previous study the ratio between reflected and incident radiation was obtained for each panel through an empiric method using pyranometers [31,33]. The results were 0.55 and 0.23 for the white and black panels respectively, meaning that white panels reflect much more
thermal radiation and analogously absorb less than the darker ones.
– In the morning period, without solar incidence, the thermal differential between panels with
different colours is attributed to diffuse radiation as both tiles are made out of the same material and the roughness is similar. Furthermore, the tiles’ emittance value, carefully measured in laboratory for both the two colours, was the same (0.88) [31].
– Temperatures obtained for cell 1 (with thermal insulation of the ETICS) are higher than the ones
registered on cell 2 (without thermal insulation).
– Anomalies detection is easier on cell 2.
– In the heating phase (two first thermograms) the detached tiles are hotter than the adherent ones;
contrariwise, on the cooldown phase, detachments are presented as colder spots.
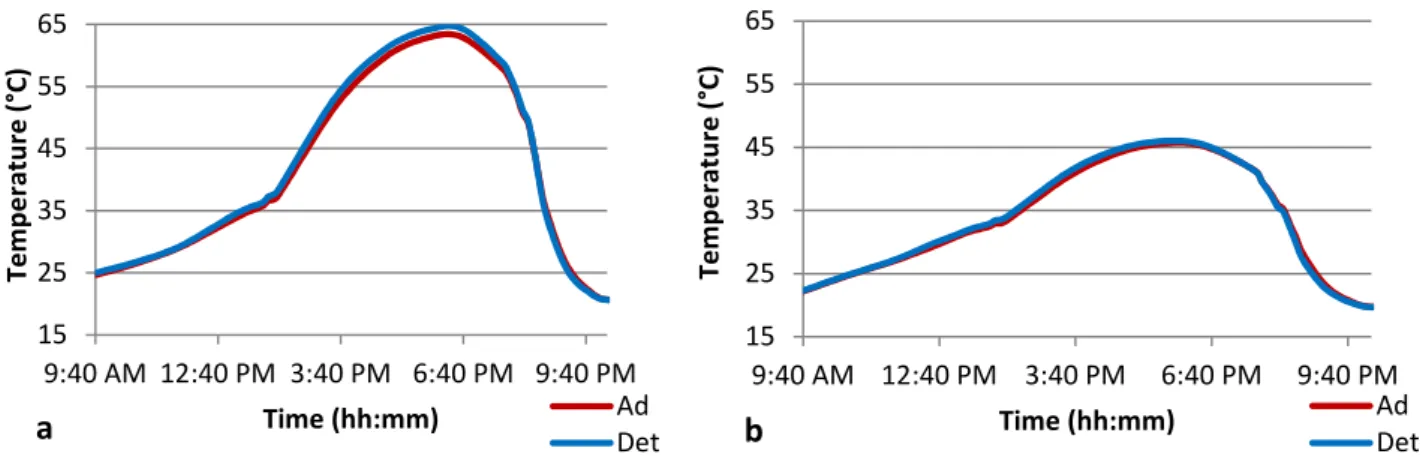
In order to study numerically the thermal variations in both the detached and adherent tiles of each
panel, the graphics of figures 6 and 7 were created for the 20thJuly 2016. The temperatures presented
in the graphics were obtained by measuring each tile’s average temperature (area of tile) and afterwards calculating average temperatures for both the adherent and detached tiles of each panel, resulting in two curves per panel.
Figure 6 - Evolution of adherent (Ad) and detached (Det) tile’s average temperatures in cell 1’s 15 25 35 45 55 65 9:40 AM 12:40 PM 3:40 PM 6:40 PM 9:40 PM Te m pe rat ur e (° C) Time (hh:mm) Ad Det 15 25 35 45 55 65 9:40 AM 12:40 PM 3:40 PM 6:40 PM 9:40 PM Te m pe rat ur e (° C) Time (hh:mm) Ad Det
a
b
a
black panel (a) and white panel (b)
Figure 7 - Evolution of adherent (Ad) and detached (Det) tile’s average temperatures in cell 2’s black panel (a) and white panel (b)
Analysing both the thermograms and the graphics that describe the evolutions of the temperatures obtained for the detached (Det) and adherent (Ad) tiles it is possible to take some similar conclusions regarding the cladding’s behaviour.
Comparing the results, it is notable that the curves are similar for all the tiles on the same panel. During the morning temperatures rise because of the incidence of diffuse radiation and the increasing ambient temperature; proximately at 2pm, the curves’ slope rises as thermal radiation from the sun starts reaching the wall. Furthermore, the difference between detached and adherent tiles’ temperatures also starts being clearer at this period. Temperatures reach their maximum value between 5 pm and 6 pm and then start decreasing on the account of the decrease in the ambient temperature and also a decrease in the incident radiation. When sun sets, despite the irradiated energy remaining the same and the sun being more perpendicular to the wall, the distance that radiation has to overcome through atmosphere is much higher; and so, as atmosphere also absorbs
a part of radiation, its intensity will be much lower at the end of the afternoon. Thus, when
temperatures start dropping, especially after 7:45 pm (when the walls start getting shaded), the detached tiles drop below the adherent tiles’ temperature. The thermal differential between detached and adherent tiles starts to fade at arround 9 pm (after arround 1h15 without solar incidence).
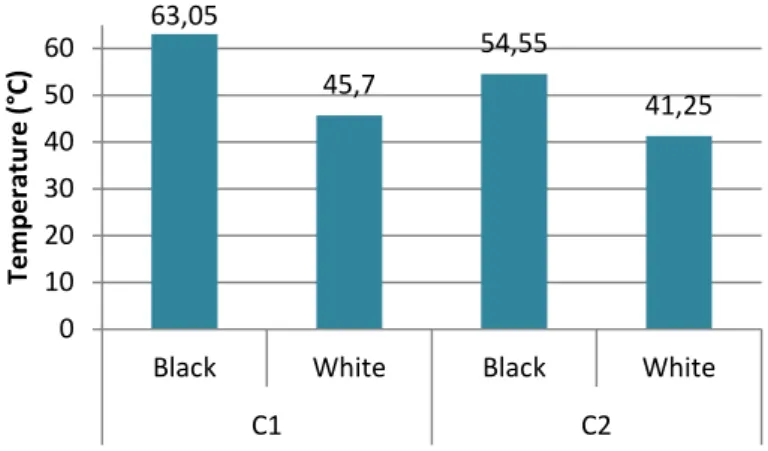
Observing figure 8 it is possible to compare adherent tiles’ maximum temperatures verified during 15 25 35 45 55 65 9:40 AM 12:40 PM 3:40 PM 6:40 PM 9:40 PM Te m pe rat ur e (° C) Time (hh:mm) Ad Det 15 25 35 45 55 65 9:40 AM 12:40 PM 3:40 PM 6:40 PM 9:40 PM Te m pe rat ur e (° C) Time (hh:mm) Ad Det
a
b
a
the survey.
Figure 8 - Maximum average temperatures obtained in all panels’ adherent tiles
When the differences between adherent tiles of both colours are analysed, as expected and seen in the thermograms, black panels reach higher temperatures than white panels (about 17°C above on cell 1 and 13°C above on cell 2).
Regarding the differences between the two cells, i.e. between the two supports, the ETICS solution reaches higher temperatures. In the case of black panels, ETICS based panels’ temperatures are 9°C higher, while in the case of white panels the difference is 4°C.
Figure 9 shows the variation of the thermal differential between detachent and adherent tiles with time.
Figure 9 - Thermal differentials between detached and adherent tiles Analysing Figure 9 it is is possible to distinguish the existence of different phases:
– In the morning there is no great difference between anomalous and normal tiles.
63,05 45,7 54,55 41,25 0 10 20 30 40 50 60
Black White Black White
C1 C2 Te m pe rat ur e (° C) -4 -2 0 2 4 9:40 AM 11:40 AM 1:40 PM 3:40 PM 5:40 PM 7:40 PM 9:40 PM ΔT em pe rat ur e (° C) Time (hh:mm) C1_B C1_W C2_B C2_W
solar incidence).
– The differential drops slowly until 7:30 pm
– With the panels’ cooldown, the differential changes from a positive value (detachments’
temperatures higher) to a negative value (detachments’ temperatures lower).
– While temperature drops and the sun sets the differential also drops reaching its minimum at
arround 8:30 pm.
– After reaching the minimum the differential fades, making it more difficult to visualize the
anomalies.
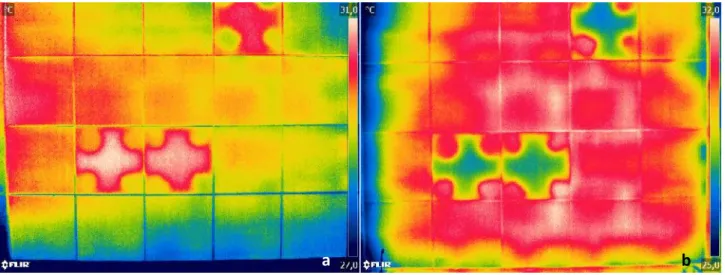
Figure 10 presents two thermograms taken to the bottom half of the black panel from cell 2 (C2_B) taken during the day (maximum differential – 3:30 pm) and at night (minimum differential – 10:15 pm).
Figure 10 – Thermograms from the bottom half of cell 2’s black panel taken during the day (a) and at night (b)
In these thermograms, taken from a closer distance to the panels, it is possible to verify that, as shown before on the quantitative analysis, the thermal differential is positive during the heating phase (day) and negative after some time of cooldown (night) ; ie in the first thermogram it is possible to see higher temperatures in the detached tiles (reddish / whitish coloured in the thermogram) and in the second the oposite, as detached tiles are colder (blueish).
An interesting feature that is visible, especially in the second thermogram, is that, besides the differences in terms of detachments, it is possible to notice the contours of the brick massonry behind
a
b
the tiles. This phenomenon happens because of the different heat capacity by the masonry’s elements (bricks and mortar). After the insulation’s period, the mortar that has a higher heat capacity is hotter than bricks; so it emits more radiation and the difference is visible with IRT.
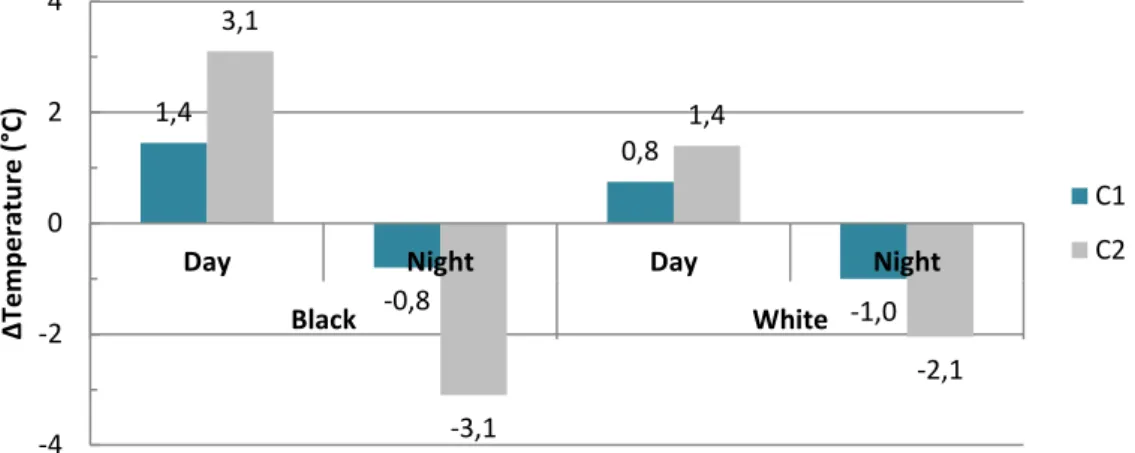
Figure 11 shows the day and night differentials (corresponding to the maximum and minimum differentials respectively), manifested during this survey.
Figure 11 - Maximum and minimum thermal differentials between adherent and detached tiles on cells 1 and 2
From figure 11 it is possible to identify certain particularities about the thermal differential between detached and adherent tiles:
– The thermal differential is always superior in cell 2 (C2) which once again indicates that
cementitious supports favour the detachments’ detection. The increment of 1,1 (m2.ºC)/W in the
overal thermal resistance created by addition of 4 cm of EPS within the ETICS’ panels “traped” the heat in the outter layer (tiling system), rising the overall panels’ temperatures and turning difficult the detachments’ detection.
– In cell 2, differentials are higher on the black pannel (C2_B).
– In cell 1, maximum differentials are higher on the black panel; however, minimum differentials are
slightly higher on the white panel.
– In cell 1, the differentials are very low (close to 1°C) which leads to some doubts regarding the
detachments detectability on real cases where the inspector does not know where the 1,4 -0,8 0,8 -1,0 3,1 -3,1 1,4 -2,1 -4 -2 0 2 4
Day Night Day Night
Black White ΔT em pe rat ur e (° C) C1 C2
detachments are.
– The best case scenario to identify a detachment is on a black tiles cladding applied on a
cementitious rendered wall after 1h30 of solar incidence.
4.2 Moisture detection
After determining the amount of water that the cloth used beneath the tile was able to absorb (approximately 80 ml), as well the approximate calculation of the space available to hold water
beneath the detached tiles (considering an empty area of 20 x 20 mm2with a thickness of 3 mm) the
amount of water considered to inject under each tile on the second survey was 120 ml.
Injecting higher water contents, it was expected to achieve the point where the water would spread beneath the tiles, even through the normal (adherent) zones. Despite this, considering the pressured water injection as well as the fact that some very small cracks were visible in the joints, especially in the black panels (attributed to the high thermal variations presented in the previous survey) it was also expected some leakage through the joints, especially in the more damaged joints from the black panels. However, the leakage happened for every tile’s water injection after a few minutes, indicating that the joints were not watertight enough to prevent pressured leaks/infiltrations.
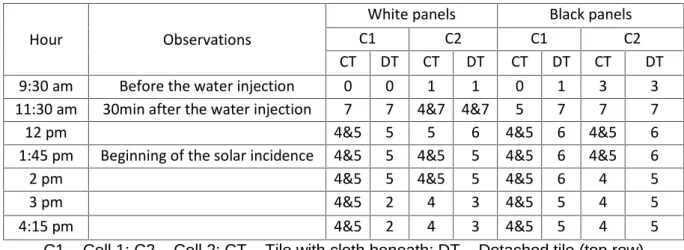
In order to simplify the description of the panels’ behaviour facing the injection of a higher amount of water, table 1 describes what was visible in the thermograms, using the following classification
system:
0. No difference between the anomalous and the normal tiles 1. It is very hard to notice a detachment
2. It is hard to notice a detachment 3. Clear detachment
4. Presence of water (not visible by naked eye) hindering the detachment’s detection 5. Presence of water (not visible by naked eye) in the joint and surroundings
6. Clearly (not visible by naked eye) humid area
7. Humid zone with superficial (visible by naked eye) runoffs
Table 1 - Classification of the phenomena visible in the thermograms taken during the humidity experimental survey
Hour Observations
White panels Black panels
C1 C2 C1 C2
CT DT CT DT CT DT CT DT
9:30 am Before the water injection 0 0 1 1 0 1 3 3
11:30 am 30min after the water injection 7 7 4&7 4&7 5 7 7 7
12 pm 4&5 5 5 6 4&5 6 4&5 6
1:45 pm Beginning of the solar incidence 4&5 5 4&5 5 4&5 6 4&5 6
2 pm 4&5 5 4&5 5 4&5 6 4 5
3 pm 4&5 2 4 3 4&5 5 4 5
4:15 pm 4&5 2 4 3 4&5 5 4 5
C1 – Cell 1; C2 – Cell 2; CT – Tile with cloth beneath; DT – Detached tile (top row)
From the analysis of table 1 it is possible to conclude that:
– Despite, as mentioned, every tile having verified some water leakage from the joints, being
classified as so in the thermograms taken 30 min after the injection, the leakage from C1_B’s CT did not appear visible on the thermogram.
– Tiles with a cloth beneath (CT) verified in general both presence of water making it difficult to
detect the detachments and presence of water in the joint and surroundings (figures 12 and 13).
– Simply detached tiles in general presented a wide humid area after the injection, sometimes
bottom half of the tile: figure 12).
– With the heating of the panels during the day it was possible to verify a diminution of the wide
humid area, with the humidity being presented only in the joints and its surroundings. The reason for the fading of this humid area with the passage of time was attributed to the evaporation of water that got out through the only water vapour permeable component, the grouted joins. The limited presence of this component might have hampered the reduction of water content within the cladding by evaporation, creating a time lag between the heat gain and loss of moisture in these areas.
Figure 12 - Thermogram taken from C2_W at 12 pm - The classification of the anomalous tiles is presented in table 1, where CT (second from the left) is classified with a 4 and DT (fourth from the
left) with a 6
Figure 13 - Thermogram taken from C2_W at 3 pm - The classification of the anomalous tiles is presented in table 1, where CT (second from the left) is classified with a 4&5 and DT (fourth from
the left) with a 3
In a first analysis, it is easy to identify the effect of moisture beneath tiles in these two thermograms. Comparing the results obtained with the “dry results” (figures 4 and 5) the main conclusion is that
water lowers the cladding’s temperature resulting, for example, in a cooler area (bluish area in the thermogram), such as the one identified as “clearly humid area” in figure 4. In some cases, especially when there is a cloth beneath the detached tile, the water lowers the tile’s temperature hindering the differential expected.
In sum, after the results analysis from both the surveys it is considered that:
– Moisture is definitively possible to identify in porcelain tiling systems. As this type of tiling system
is one of the least absorbent, it is considered that other kinds of ceramic claddings should also allow humidity identification using IRT.
– The “cloth method” proved to be an efficient way to experimentally “trap” water, simulating a more
even distribution.
– Joints were able to prevent just a determined amount of water from leaking; but when the pressure
was too high, after 120 ml of water injected, the runoffs started.
– As moisture increases heat storage capacity, or decreases thermal resistance [27] together with
the water’s cooling evaporation phenomenon, surface temperature variations are caused (manifested as lower temperatures during the day), allowing its detection.
It is important to state that the behaviour of the bottom tiles of each panel was studied qualitatively, showing no difference in terms of behaviour in relation to the previous – dry – survey leading to the conclusion that water did not get into the bottom of the panels either because of the small amount introduced or because of the cladding’s effectiveness in trapping it.
5. Conclusions
This work had as main objective the verification of infrared thermography’s capacity in detection of anomalies in tile cladded walls. After all the research and laboratorial work [31], the main conclusion is that anomalies such as detachments and presence of moisture in tiling systems are definitively possible to identify using the mentioned non-destructive method.
to identify the detachment areas, so, at the moment this method shall be considered as a preliminary analysis method [22] that might need complementary testing to measure the anomaly’s depth [8] but that is rapidly growing as new approaches are being studied using complementary analysis methods that allow for example the quantitative estimation of debond sizes [23].
However, besides the main objective, it was also intended to analyse the different thermal behaviours that these tiling systems can have according to specific characteristics such as their colour, support of application and period of the day. Hence four panels of porcelain tiling with intentionally simulated anomalies and differences in terms of support and colour were analysed under exterior conditions, providing the following conclusions:
– Regarding the colour’s implications on the detectability of anomalous zones, it came clear that the
higher the absorptance they have, the higher the thermal differential achieved. i.e. black panels not only reached higher temperatures (as expected) but also higher thermal differentials.
– The kind of support has also a great impact in detachments’ detectability. When the support is
made out of plaster, the thin air layer provoked by a detachment raises the thermal resistance to the heat flow, causing a thermal differential in the detached zone (higher temperatures in the heating phase). On the other hand, when the support is an insulating system (ETICS), the thermal resistance increase is hardly enough to enable to distinguish detached zones from adherent zones.
– The period of the day and weather conditions are also of extreme importance to define when
leading an infrared survey. Despite temperature readings might be more accurate at night, when there is no solar irradiation [16], what highlights the detachment spots is the fast thermal variations caused by solar incidence. Thus, when looking for a superficial anomaly such as the detachment of wall tiles, it would be desirable either a survey during the beginning of solar incidence on the facade (first 1h30 after the beginning of incidence) or during the beginning of the cooldown period (at night, after around 1h of the beginning of the wall’s shadowing).
– Regarding the weather conditions, during the study period there has not been any fully clouded
that fact it is considered that a cloudy day can be compared to the morning period on West facing facades (as the ones studied), where only reflected and diffused radiations reach the facade. As in the morning period there were some small differences between attached and detached areas (when the support is not “insulator”), it is possible to claim that in a cloudy day detachments might be distinguishable. However, it is not advisable to make a thermographic survey with a cloud covered sky.
– Partially clouded days are also not recommendable, as fast shifts in irradiation conditions might
difficult the detection of anomalies.
– Moisture in walls can be identified during the day as areas with lower temperatures because of
the evaporative cooldown.
– It is also important to say that when two anomalies with “opposite” thermal behaviours, such as
moisture presence and detachment, happen at the same time it is possible that the thermal differential can be null, hindering any of the anomalies’ identification. This aspect reinforces the need of making inspections under different conditions, namely after rainy days (with a humid wall) and under dry conditions, as the opposite behaviours will reinforce the results, ensuring or not the existence of detachment.
– Distance to the target is an important aspect to take under consideration not only for its influence
in the thermograms’ resolution but also because of framing issues. As explained, the biggest the thermal range captured by the camera, the most difficult it is to highlight small thermal differences. So, ideally, a thermogram shall be taken as close to the target as possible, in order to capture only the information of its surface - not from the surroundings - and with the best accuracy.
– The excessive temperatures verified especially in black claddings makes their adoption in
exposed to direct Sun light walls inadvisable, as with time it will certainly result in problems related with thermal variations such as cracking or detachment.
– Thermocouple data has proven to be valuable as the continuous thermal readings proved the
days/weather conditions [31].
Given all the inconvenient attached with anomalies in this kind of cladding system, together with the proven capacities of the thermographic inspection method, it is considered that the continuation of this study, as well as the creation of standards dedicated to tiling systems’ should be considered in order to help this diagnosis technique gaining a proper recognition and promoting the monitoring of tiled cladding facades in order to prevent severe anomalies.
References
1 Committée European de Normalisation (CEN) (2012) - Adhesives for tiles; Requirements, evaluation of conformity, classification and designation (EN 12004:2007 + A1:2012). Brussels.
2 CEN (2016) - Ceramic tiles; Definition, classification, characteristics, assessment and verification of constancy of performance and marking (EN 14411:2016). Brussels.
3 CEN (2009) - Grout for tiles; Requirements, evaluation of conformity, classification and designation (EN 13888:2009). Brussels.
4 Lucas, J. A. C. (2001) - Anomalies on adherent ceramic claddings (in Portuguese). ITCM 28. LNEC, Lisbon (ISBN: 972-49-1886-6).
5 Dufour, J., Della Giustina, G. (1948) – Pathology of tiles (in French). Paris, ITBP. Annales
de I’ITBP No 426, Julliet-Août 1948, Série Questiones Générales 162.
6 Bauer, E., Castro, E. K., Leal, F. E., Antunes, G. R. (2011) - Identification and quantification of failure modes of new buildings facades in Brasília, Proceedings of XII International Conference on Durability of Building Materials and Components, FEUP Edições, 3, pp. 1089-1096.
7 Winnefeld, F., Kaufmann, J., Hack, E., Harzer, S., Wetzel, A., Zurbriggen, R. (2012) – Moisture induced length changes of tile adhesive mortars and their impact on adhesion
(doi:10.1016/j.conbuildmat.2011.12.023).
8 Flores-Colen, I., De Brito, J. and Branco, F. (2009) - In situ adherence evaluation of coating materials. Experimental Techniques, 33, pp. 51-60 (doi: 10.1111/j.1747-1567.2008.00372.x).
9 Silvestre, J. Brito, J. (2008) – Inspection and diagnosis of adherent ceramic claddings (in Portuguese). Revista Eng. Civil - U. Minho, 30 (2008), pp. 67-82.
10 Matias, L. (2012) - Testing techniques for structures inspection. DURATINET Course.
Lisbon, LNEC , 29th-30th May 2012.
11 Maldague, X. (2001) - Theory and practice of infrared technology for nondestructive testing. Editors: K. Chang. Wiley-Interscience (ISBN 0-471-18190-0).
12 Bauer, E., Pavón, E., Barreira, E., Kraus de Castro, E. (2016) – Analysis of building facade defects using infrared thermography: Laboratory studies. Journal of Building Engineering, 6, pp. 93-104 (http://dx.doi.org/10.1016/j.jobe.2016.02.012).
13 Lourenço, T.C., Matias, L., Faria, P. (2016) - Anomaly diagnosis in ceramic claddings by thermography - A review. ICOSADOS 2016 - 7th International Conference on Safety and Durability of Structures, UTAD, Portugal (ISBN:978-989-20-6683-7).
14 Edis, E., Flores-Colen, I., Brito, J. (2014) - Passive thermographic detection of moisture problems in facades with adhered ceramic cladding. Construction and Building Materials, 51, pp. 187-197 (http://dx.doi.org/10.1016/j.conbuildmat.2013.10.085) .
15 Bauer, E., Castro, E. K., Oliveira Filho, A. H., Pavón, E. (2014) – Criteria for application of passive infrared thermography as an auxiliary technique in the diagnosis of pathologies on the facades of buildings. Iº Encontro Luso-Brasileiro de Degradação de Estruturas em Betão Armado, Salvador, Bahia, Brasil, pp. 266-277.
assessing moisture related phenomena in building components. Construction and Build -ing Materials, 110, pp. 251-269 (http://dx.doi.org/10.1016/j.conbuildmat.2016. 02.026) . 17 Bauer, E., Freitas, V.P., Mustelier, N., Barreira, E., Freitas, S. (2015) - Infrared thermography – evaluation of the results reproducibility. Structural Survey, 33 (1), pp. 20-35 (doi: 10.1108/SS-05-2014-0021).
18 Freitas, S.S. Freitas, V.P., Barreira, E. (2014) - Detection of facade plaster detachments using infrared thermography - A nondestructive technique. Construction and Building Materials, 70, pp. 80-87 (doi: 10.1016/j.conbuildmat.2014.07.094).
19 Theodorakeas, P., Avedelidis, N.P., Cheilakou, E., Koui, M. (2014) - Quantitative analysis of plastered mosaics by means of active infrared thermography. Construction and Building Materials, 73, pp. 417-425 (doi: 10.1016/j.conbuildmat.2014.09.089). 20 Melrinho, A., Matias, L., Faria, P. (2015) – Detection of anomalies on waterproofing flat
roof systems by IR thermography (in Portuguese). TECH ITT, 13 (37), pp. 29-38.
21 Freitas, J., Carasek, H., Cascudo, O. (2013) – IR thermografy to assess rendered and painted facade cracks (in Portuguese). Ambiente Construído, 14 (1), pp. 57-73.
22 Menezes, A., Gomes, M.G., Flores-Colen, I. (2015) - In-situ assessment of physical performance and degradation analysis of rendering walls. Construction and Building Materials, 75, pp. 283-292 (http://dx.doi.org/10.1016/j.conbuildmat.2014.11.039).
23 Wai-Lok Lai, W., Lee, K., Poon, C. (2015) – Validation of size estimation of debonds in external wall’s composite finishes via passive Infrared thermography and a gradient
algorithm. Construction and Building Materials, 87, pp. 113-124
(http://dx.doi.org/10.1016/j.conbuildmat.2015.03.032).
24 Barreira, E., Freitas, V.P. (2007) – Evaluation of building materials using infrared
(doi:10.1016/j.conbuildmat.2005.06.049).
25 Barreira, E., Freitas, V.P., Delgado, J.M., Ramos, N. (2008) - Thermography applications in the sudy of buildings hygrothermal behaviour. LFC − Building Physics Laboratory, Civil Engineering Department, FEUP, Portugal.
26 Edis, E., Flores-Colen, I., Brito, J. (2015) - Quasi-quantitative infrared thermographic detection of moisture variation in facades with adhered ceramic cladding using principal
component analysis. Building and Environment, 94 (1), pp. 97 -108
(http://dx.doi.org/10.1016/j.buildenv.2015.07.027).
27 Matias, L., Vilhena, A., Santos, C., Veiga, R., Magalhães, A. (2008) – Infrared thermography applied to the evaluation of moisture in ancient buildings. HMC 2008 – Historical Mortars Conference. LNEC, Lisbon.
28 Magalhães, A., Veiga, R., Santos, C., Matias, L., Vilhena, A. (2008) – Methodology for diagnosis of rendering anomalies due to moisture in walls. Conservar Património, 7, pp. 45-54.
29 Hart, J. M. (1991) - A practical guide to infra-red thermography for building surveys. Building Research Establishment Report (ISBN: 0851254489).
30 Usamentiaga, R., (2014) - Infrared thermography for temperature measurement and non-destructive testing. Sensors, 14, pp. 12305-12348 (doi:10.3390/s140712305).
31 Lourenço, T.C. (2016) - Anomalies detection in adhesive wall tiling systems by infrared thermography. Msc thesis, Universidade NOVA de Lisboa.
32 FLIR Systems (2006) – User’s manual. Publ. Nº. 1558561 - Ref. A147
33 Lourenço, T.C., Matias, L., Faria, P. (2016) – Detection of anomalies on tile coatings by IR thermography (in Portuguese). QIC - 2° Encontro Nacional Sobre Qualidade e Inovação na Construção, Lisboa, LNEC.