Thi i asn open-ascce asrticle di tributed under the term of the Creastiie Common Attribution Licen e nonte욇 http욇//wwwwww cielo br/ cielo phpc cript= ci_asrttextppid=1982꾞-꾞970꾞0970003005꾞0plng=enpnrm=i o Ace o em욇 99 jasn 꾞092
REnERÊNCIA
MAROTTA, eiuliasno 1asnt’Annas; VIDOTTI, Robertas Masry Deielopment of as locasl geoid model ast the federasl Di trict, Braszil, pastch by the remoie-compute-re tore technique, followwing Helmert' conden astion method Boletim de Ciênciias Gieodésicias, Curitibas, i 꾞3, n 3, p 5꾞0-532, jul / et 꾞097 Di poníiel em욇 <http욇//wwwwww cielo br/ cielo phpc cript=
ci_asrttextppid=1982꾞-꾞970꾞0970003005꾞0plng=enpnrm=i o> Ace o em욇 99 jasn 꾞092 doi욇 http욇//dx doi org/90 9580/ 982꾞-꾞970꾞097000300035
Article
DEVELOPMENT OF A LOCAL GEOID MODEL AT THE FEDERAL
DISTRICT, BRAZIL, PATCH BY THE REMOVE-COMPUTE-RESTORE
TECHNIQUE, FOLLOWING HELMERT'S CONDENSATION METHOD
Desenvolvimento de um Modelo Geoidal Local no Distrito Federal, Brasil,
Utilizando Técnica Remove-Computa-Restaura, seguindo o Método de
Condensação de Helmert
Giuliano Sant’Anna Marotta1
Roberta Mary Vidotti1
1Instituto de Geociências, Universidade de Brasília - UnB. Brasilia, Distrito Federal, Brasil. Email:
marotta@unb.br, roberta@unb.br.
Abstract:
There are several techniques for determining geoid heights using ground gravity data, the geopotential models, the astro-geodetic components or a combination of them. Among the techniques used, the Remove-Compute-Restore (RCR) technique has been widely applied for the accurate determination of the geoid heights. This technique takes into account short, medium and long wavelength components derived from the elevation data obtained from Digital Terrain Models (DTM), ground gravity data and global geopotential models, respectively. This technique can be applied after adopting the procedures to compute gravity anomalies and, then, the geoid model, considering the integration of different wavelengths mentioned, and their compatibility with the vertical datum adopted. Thus, this paper presents the procedures, involving the RCR technique, following Helmert's condensation method, and its application to compute one local geoid model for the Federal District, Brazil. As a result, the local geoid model computed for the studied area was consistent with the available values of geoid heights derived from geometrical levelling technique supported by GNSS positioning.
Keywords: Local geoid model; Helmert's condensation method; Remove-Compute-Restore
technique.
Resumo:
Existem diversas técnicas de determinação das alturas geoidais, seja utilizando os dados gravimétricos terrestres, os modelos do geopotencial, as componentes astro-geodésicas ou pela combinação deles. Dentre as técnicas utilizadas, uma que vêm sendo amplamente aplicada para a determinação precisa da altura geoidal é a Remoção-Cálculo-Restauração (RCR), que considera as componentes de curto, médio e longo comprimentos de onda, derivados de dados de altitude através de um Modelo Digital do Terreno (MDT), de dados gravimétricos terrestres e de modelos
do geopotencial global, respectivamente. Para a aplicação desta técnica, torna-se necessário, primeiramente, adotar procedimentos para o cálculo de anomalias de gravidade, para em seguida calcular o modelo geoidal, considerando a integração dos diferentes comprimentos de onda citados e a compatibilização do modelo ao datum vertical adotado. Este trabalho apresenta uma revisão dos procedimentos adotados para cálculo de modelos geoidais, com base na técnica RCR e no método de condensação de Helmert, e suas aplicações para o cálculo de um modelo geoidal local no Distrito Federal, Brasil. Como resultado, o modelo geoidal local calculado para a área de estudo apresentou-se consistente com os valores disponíveis de alturas geoidais obtidas da associação do nivelamento geométrico com posicionamento GNSS (Global Navigation Satellite System).
Palavras-chave: Modelo geoidal local; Método de condensação de Helmert; Técnica
Remove-Computa-Restaura.
1. Introduction
Height determination and vertical control with a precise geoid model constitutes one of the most challenging research subjects of geodesy, and it attracts more attention since 1980s, related with the wide spread and intensive use of GNSS techniques in surveying (Erol and Erol 2013). According to Sjoberg (2005) and Hirt (2011), many strategies used in gravity field modeling were developed at a time when the precision goal to determine the geoid height was 10 cm or less. Currently, according to Hirt (2011), to determine the geoid and quasi-geoid heights with an precision of centimeters or better, it is necessary to evaluate carefully, and, if necessary, correct the approaches that are inherent to the methods and the techniques used.
There are several methods for determining geoid heights using groung gravity data, the geopotential models, the astro-geodetic components or a combination of them. Among the techniques used to determine the geoid models using the gravity data at regional level, the best-known approach in the literature is the RCR, according to Schwarz et al. (1990) and Abbak et al. (2012). This approach has been used in many parts of the world, and among them Canada, Turkey, Austria, United States, Australia and Brazil (Schwarz et al. 1990; Ayhan 1993; Zhang et al. 1998; Fotopoulos et al. 1999; Smith and Small 1999; Featherstone et al. 2004; Abbak et al. 2012; Blitzkow et al. 2012).
The RCR technique, according Sansò and Sideris (2013), takes into account the short, medium and long wavelength components that are derived from the elevation data obtained from Digital Terrain Models (DTM), ground gravity data and global geopotential models, respectively. This technique requires adopting procedures to compute gravity anomalies and then of the geoid model, considering the integration of the different wavelengths mentioned, and their compatibility to the vertical datum adopted.
Given the above, this work presents the procedures, involving the RCR technique, following Helmert's condensation method, and its application to compute one local geoid model for the Federal District, Brazil. The motivation for this work is due to cities development within the Federal District occur in flat areas with several infrastructure problems, such as water supply and drainage of rainwater and sewage, which demand accurate knowledge of orthometric height to solve them.
2. RCR Approach
The RCR technique for calculating the geoid model can be divided in three distinct stages. The first is the removal of the long wavelength component of the gravity anomaly generated by Helmert’s second condensation method (
g
HEL). The said component is estimated by the gravity anomaly (
g
GM) using the global geopotential models. This process yields the Helmert residual anomaly (
g
RES). The second stage calculates the residual co-geoid model (N
RES) using the Helmert residual anomaly; the co-geoid model for the long wavelength components (N
GM ) using the global geopotential models; and the primary indirect effect of topography (N
IE), which is the vertical distance between the geoid and co-geoid. The third and final stage is the estimation of the geoid model (N ) using the calculated values ofN
GM ,N
RES andN
IE.
g
RES
g
HEL
g
GM (1)
GM
RES
IEN
N
N
N
(2) To develop the technique,
g
GM andN
GM can be estimated according to Smith (1998), using the geopotential coefficients adopted to a pre-set degree, to comprise only the long wavelength components.
, , , 2 0 1 cos sin
n
Nmax n g g GM n m n m n m n m GM a n g C m S m P sin r r r (3)
, , , 0 2 0 cos sin
n
Nmax n g g GM n m n m n m n m GM a N C m S m P sin r r (4) where
2 2 2 2 2 1 1 1 e e sin r a e sin (5)
2 1 b tg tg a (6) 2 0 2 2 1 1
a ksin e sin (7)
b a a b a k a (8) gGM
anda
g are the geocentric gravitational constant and the equatorial scale factor of the geopotential model adopted, respectively, according to Smith (1998) and Smith and Small (1999);r is the geocentric radius; a, b and e are the semimajor and semiminor axis, and the first eccentricity of the reference ellipsoid; and
are the longitude and latitude of geodetic points of interest; is the geocentric latitude (Torge 1991);
0,
a and
b are the normal gravity in the latitude of the point of interest, at the equator and the poles, respectively (Moritz 1984).
Cn m, and,
Sn m are the fully normalized spherical harmonic coefficients of the disturbing potential; and
,
n m
P sin are the fully normalized Legendre functions (Schwarz et al. 1990) of degree n and order m.
According to Holmes and Featherstone (2002), the most commonly used recursive algorithm for calculating P sinn m,
can be obtained by full normalization, which produces a recursive non-sectorial calculation (i.e., nm). Thus, considering tsin
and ucos
, the following recursive equation appears:
, , 1, , 1, , n m n m n m n m n m P t a tP t b P t n m (9) where
, 2 1 2 1 n m n n a n m n m (10)
, 2 1 1 1 2 3 n m n n m n m b n m n m n (11)In the sectorial calculation, (nm), Pn m,
t work as the intial values for the recursion, and are calculated using the following initial values P0,0
t 1 and P1,1
t 3u . The n and m highervalues of Pn m,
t are calculated by:
, 1, 1 , 2 2 1 2 1 , 1| 3 , 1 2 2 m
m n m n m n m i m i P t u P t m P t u m m i (12)To calculate
g
GM andN
GM , it is also necessary to subtract the fully normalized spherical harmonic coefficients of the gravitational potential of the coefficients implicit in the referenceellipsoid. This is done by the zonal spherical harmonic coefficients of the gravitational potential (C2 ,0n ), according to Moritz (1984) and Smith (1998). Thus:
2 2 ,0 2 ,0 4 1 n n n n g g J GM a C C GM a n (13) where
2 1 2 2 2 3 1 1 5 2 1 2 3 n n n J e J n n n n e (14)and
J
2 is calculated as demonstrated by Cook (1959):2 2 2 2 11 1 1 3 2 2 7 49 f m f f J f (15) 2 2
a b m GM (16)GM , and f are the geocentric gravitational constant, angular velocity and the flattening of the reference ellipsoid, respectively.
For all other coefficients, it is assumed:
, , 2 ,0
Cn m Cn m C C n (17) , , ,
Sn m Sn mSn m (18) , n mC and Sn m, are the fully normalized spherical harmonic coefficients of the gravitational potential.
According to Blitzkow (1986), the equations 13, 17 and 18 represent, generically, the relationship between the coefficients linked to disturbing and gravitational potentials. In practice, the aforementioned equations show that the gravitational potential of the normal earth use only m0 and n pair, and that does not contain terms which depend of sin
m
.Equations 3 and 4 do not consider the zero degree term in gravity anomaly (
g
0) and co-geoid ( 0N
). Therefore, to compute
g
GM andN
GM considering a reference ellipsoid adopted, this term must be added on the equations 3 and 4, respectively. According to Kirby and Featherstone (1997), the degree zero term may be computed by:0 0 2 2 g GM GM W U g r r (19) 0 0 0 0 g GM GM W U N r (20) 0
W
is the gravity potential on the surface of the geoid. U is the normal gravity potential on thesurface of the normal ellipsoid and may be computed by:
2 2 1 2 2 ' 3
GM a U tg e a b (21) 'e is the second eccentricity of the reference ellipsoid.
The
N
RES is calculated based on the principle of Stokes (Stokes 1849), which allows to estimate the values of the geoid height (N ) using the gravity anomaly values (g ) obtained on the physical surface of the Earth, considered as spherical. In the discrete form of the surface elements,N becomes (Sideris and She 1995):
1 1 0 , ' 4 R
n m M N g S cos (22)
', '
g represents the average gravity anomaly of an area in a grid with n parallels and m
meridians; and are the variations in geodetic coordinates, latitude and longitude, which comprises each area; ' and ' are the geodetic coordinates at the center of the area;
0 is the average normal gravity of each area;
is the spherical distance between two points; and SM
is the modified Stokes function, used to remove the low-degree terms of the Legendre polynomials from the S
(original Stokes function).According Vaníček and Kleusberg (1987), SM
can be computed by:
0
2 2 1 2
L VK WG M M k k k k S S t cos P cos (23) where according Wong and Gore (1969):
2 2 1 1
L WG M n n n S S P cos n (24)L is the maximum degree,
P
n is the Legendre polynomial of order n,t
k is the coefficient of Vaníček and Kleusberg.
1 1 6sin 5 3 1 2 2 2 2 S cos cos ln sin sin
sin
(25)
' ' '
cos sin sin cos cos cos (26) The discrete calculation of N presents a singularity when 0. To work around this problem, Sideris and She (1995) proposed:
0 0
s N g (27)Where
s
0 is the radius of the next considered area.Then, the calculation of the geoid model using the Stokes discrete formula is given by
Stokes
N
N N
(28) In the RCR technique, g
', '
gRES
', '
. To calculate
g
RES, it is necessary to find the gravity anomaly. The second condensation method of Helmert (
g
HEL) is the most often used because it produces the small indirect effect of topography (Heiskanen and Moritz 1985).
g
HEL
g
FA
C
ATM
C
T
g (29)
g
FA is the free-air anomaly,C
ATM the atmospheric correction,C
T is the terrain correction and
g is the indirect effect of topography (Heiskanen and Moritz, 1967), also known as the indirect secondary effect. 2 0 2 0 0 2 3 2 1 2 p FA obs p H g g H f m fsin a a (30)
5
9 2
0.8658 9.727 10 3.482 10 ATM p p C H H (31)
2
2
2 3 , ,
p H p T z H E p p p x y z z H C G dxdydz x x y y z z∬
(32)0.3086
g
N
IE (33) obsg
is the gravity observed on the physical surface of the Earth.
g
FA is calculated according to Featherstone and Dentith (1997),C
ATM is calculated according to Kuroishi (1995), in mGal. x, y and z represent the planar coordinates and orthometric heights of the integration points and of thecomputation points ( p).
2 3 3 3 2 2 0 6 0 p p IE E p p G H G H H N dxdy x x y y∬
(34)To calculate
C
T,N
IE,
g and estimate
g
HEL, the height data are extracted from a previously defined DTM. This is necessary to eliminate the differences in the height values determined by different source data.To estimate N , the
g
HEL values were interpolated to generate a regular grid and enable the operations using the RCR technique. The inverse distance squared was used as the interpolation method. In general, first, the Bouguer correction (C
B) is added to each point ( p) for which
g
HEL has been calculated, followed by the interpolation of values for the points of the regular grid. Finally,C
B is eliminated from the generated grid, thus yielding the Helmert anomaly estimated for the regular grid (gHELGrid). The values ofC
B are used to smooth the values of
g
HEL in the interpolation process and generate gHELGrid.
2
B p
C G H (35)
3. Adjustment of the Gravimetric Geoid Model
The geoid height computed using gravity data can be evaluated by comparing
N
Grav with the geoid height (N
GNSS LEV/ ) estimated by geometric altitudes (h ), determined by GNSS positioningtechniques and (H) orthometric heights, determined by geometric levelling taking as origin the local vertical reference datum.
/
GNSS Lev GNSS Levelling
N
h
H
(36) /
N
N
Grav
N
GNSS Lev (37) To perform the evaluation, it is necessary to make the geoid height computed using gravity data compatible with the vertical reference datum location. As described by Sansò and Sideris (2013), the RCR technique refers to the geocentric reference system implicit in the geopotential model used. Also, the local levelling datum to which the orthometric heights refer will not likely correspond to the reference potential value of the geopotential model or the GPS reference system. To solve this problem, it is necessary to combine the heterogeneous height data.The compatibility of the geoid height can, therefore, be performed by the Least Square Method (LSM), whose functional linear model follows this consideration:
2 0 0 1 | 0 a b a
n i i N L V F X A X X F X V (38)where, A is the design matrix;
X
0, vector of initial parameters;X
a , vector of adjusted parameters; X , vector of corrections;L
b, vector of observed values (N ); and V , residue vector.Among the functional models adopted, we have the classical four-parameter linear model presented by Sanso and Sideris (2013):
N
aa bcos cos
i i
ccos sin
i i
dsin
i (39) where b , cand d are the translation parameters; a is the change of the reference value of the potential; and
i and
i are Latitude and longitude of the GNSS/Levelling points.After compute the parameters by LSM, the obtained geoid height is compatible with the local vertical datum adopted.
Final Grav a
N
N
N
(40) Besides making the vertical data compatible, it is correct to affirm that the LSM using the parametric model also takes into account: the random errors derived from N , h and H ; systematic effects and distortions of height data; theoretical assumptions and approximations made when processing the observed data; and the instability of the monument of the reference station over time, for example.4. Evaluation of the local geoid model
The local geoid models computed can be evaluated on two ways, as presented by Tocho et al. (2013).
The first involves descriptive statistics of the absolute differences between the geoid heights ( N
) extracted from the computed geoid models (N ) and from GNSS/levelling ( GNSS Lev/
N ) points.
Those differences can be expressed by:
/
GNSS Lev
i i i
N N N (41)
i is the point used in the evaluation.
The second involves descriptive statistics of the relative geoid heights differences ( rel
N ) formed
for the baselines computed from pairs of points, using the computed geoid model and the GNSS / levelling points. It can be shown by:
/ /
, GNSS Lev GNSS Lev j i j i rel i j ij N N N N N S (42)i and j are the points used to form the baseline in the evaluation.
S
ij is the baseline distance. If the value of N is in mm and the value of S is in km, relN has the value in ppm.
5. Procedures adopted to compute the local geoid model
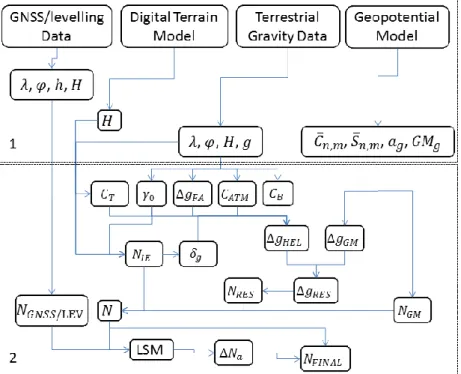
Figure 1 shows the flowchart of computations used to estimate the local geoid model according to equations presented to implement the RCR technique and to adapt the geoid height. The flowchart includes a whole set of routines developed for reading the input data, for computation procedures and results generation. All routines, here called GRAVTool, were implemented based on the MATLAB® software.
As shown in Figure 1, the input data used for the calculation procedures include: global geopotential model (*.gfc), provided by the International Centre for Global Earth Models - ICGEM; DTM image (*.tiff and *.tfw); ground gravity data in ASCII (*.txt), containing the geodetic coordinates, orthometric height and observed gravity of used points; constants related to the reference ellipsoid and average density; and terrestrial data that originated from the GNSS positioning and geometric levelling, in ASCII (*.txt) containing geodetic coordinates, and the geometric and orthometric altitude of each point. All gravity anomaly and geoid height results, calculated using the equations shown in previous sections, are available as ASCII (*.txt).
Figure 1: Flowchart of the sequence of calculations to estimate the gravimetric geoid model. 1)
6. A local geoid model at the Federal District, Brazil
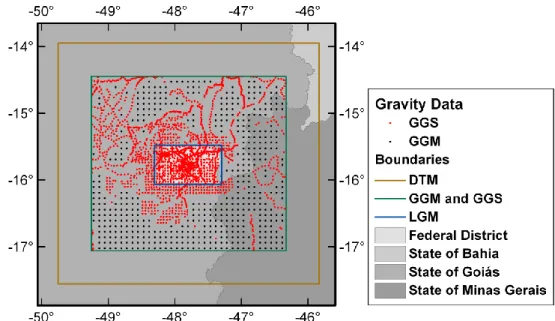
The region of the Federal District of Brazil was chosen to compute the local geoid model (LGM). This region is located between 48.25ºW and 47.33ºW and 16.06ºS and 15.45ºS (Figure 2), with a slightly wavy relief, ranging from 600 to 1340 meters above sea level.
To compute a local geoid model at the study region, the following material was used:
- GECO (Goce and Egm2008 COmbination) geopotential model (GGM), developed by Gilardoni et al. (2015) and made available by the ICGEM. GECO was chosen because it is the newest highest resolution geopotencial model based on the integration of the EGM2008 (Earth Gravitational Model 2008) and of the GOCE (Gravity field and steady-state Ocean Circulation Explorer) satellite tracking data (fifth release of the time-wise GOCE solution).
- DTM from the Shuttle Radar Topography Mission (SRTM), with spatial resolution of 90 m. The DTM are located between 49.75ºW and 45.83ºW and 17.56ºS and 13.95ºS (Figure 2).
- 2312 ground gravity stations (GGS) provided by the Brazilian Institute of Geography and Statistics - IBGE, the National Petroleum Agency - ANP, including 323 new stations acquired by the authors. In addition, to complete the ground gravity data in regions without ground gravity stations, GECO up to degree and order 2190 was used. In this case, the ground gravity data were computed using the gravity anomaly and the height data extracted by ETOPO1 model, provided by National Oceanic and Atmospheric Administration - NOAA. All of the gravity data are located between 49.25ºW and 46.33ºW and 17.06ºS and 14.45ºS (Figure 2).
To analyze the results and to adjust the local geoid model to the local vertical datum (Imbituba vertical Datum), 24 points whose geoid heights were obtained by GNSS positioning and geometric levelling, provided by IBGE, were used.
Figure 2: Spatial distribution of the ground gravity stations (GGS) and ground gravity data
computed from GECO geopotential model (GGM), tide free, up to degree and order 2190. Boundaries of the DTM, GGM, GGS, LGM and states are presented, too.
The RCR technique used the GECO geopotential model (tide free) up to degree and order 360 considering only the long wavelengths for the calculation of
g
GM andN
GM in the study area (Figures 3 and 4, respectively).
g
HEL and gHELGrid of the study area were computed using the ground gravity data and the DTM, following gravity anomaly and reductions involving
g
FA,ATM
C
,C
T,
g andC
B (Equations 29 to 33 and 35; Figure 5). Finally, the
g
RES was computed (Equation 1).Figure 3:
g
GM calculated for the study area, using
Cn m, and
Sn m, up to degree and order 360, based on the GECO geopotential model. The black polygon shows the geographical boundariesof the Federal District.
Figure 4:
N
GM calculated for the study area, using
Cn m, and
Sn m, up to degree and order 360, based on the GECO geopotential model. The black polygon shows the geographical boundariesGECO has contribution of GOCE data up to the 250 degree. However, the choice of the degree up to 360 to compute
g
GM andN
GM on this study was made because it presented less dispersion of the differences betweenN
GM andN
GNSS Lev/ .Figure 5: gHELGrid calculated using the ground gravity data and DTM of the study area. The black polygon shows the geographical boundaries of the Federal District.
The constants used in this work are shown in Table 1. These constants are presented by Moritz (1984) and IERS (International Earth Rotation and Reference Systems Service) Technical Note (Petit and Luzum, 2010).
Table 1: Constants values used to compute the geoid model.
Reference ellipsoid GRS80
a 6378137 m Semimajor axis
b 6356752.3141m Semiminor axis
GM 14
3.986005 10 m /s3 2 Geocentric gravitational constant
ω 7.292115 10 5rad/s Nominal mean Earth's angular velocity
a
γ
9.7803267715m/s2 Normal gravity at equatorb
γ
9 8321863685 m/s. 2 Normal gravity at poleG 6.67428 10 11m / kg.s3
2
Constant of gravitation0
W
62636856.0m /s2 2 Potential of the geoidDensity
ρ
2670
3kg/m
Average crustal densityThe local geoid model (Equation 2 and Figure 6) with a spatial resolution of 2.5’ was obtained following the calculation of
N
GM (Equation 4),N
RES (Equations 22 and 28), the zero degree term(Equations 19 and 20) and
N
IE (Equation 34). The zero degree term computed and added in
g
GM andN
GM was -0.152 mGal and -0.442 m, respectively.The LSM (Equations 38 and 39) was used to adjust the local geoid model to the local vertical datum, using as reference 24 points whose geoid heights were obtained by GNSS positioning and geometrical levelling (Figure 6). The altimetric precision of the points used as reference is approximately 0.073 m. As there are only a few points to apply the SLM, and that the lack of one of them can affect considerably the results of the adjustment, this study did not include part of these points as checkpoints.
Figure 6: Calculation of the local geoid model (
N
Grav). The red points are geometrical levelling technique associated with GNSS positioning used to evaluate and to adjustN
Grav to the local vertical datum in the study area. The black polygon shows the geographical boundaries of theFederal District.
After adjusting the parameters (Equation 39), the local geoid model was estimated (Equation 40 and Figure 8) free of systematic components -
N
a. The systematic components are presented on Figure 7.Figure 7:
N
a (systematic component) adjusted by the LSM, using as reference points whose geoid heights were obtained by GNSS positioning and geometric levelling for the study area.Figure 8:
N
Final after applying
N
a in the study area. The black polygon shows the geographical boundaries of the Federal District.To evaluate the results, it was analyzed the absolute and relative differences between the geoid heights extracted from
N
Grav andN
GNSS Lev/ . In both analyzes, the official geoid model adopted in Brazil (MAPGEO2015) was included to verify the performance of this work computed models. Although this study did not include checkpoints to analyze theN
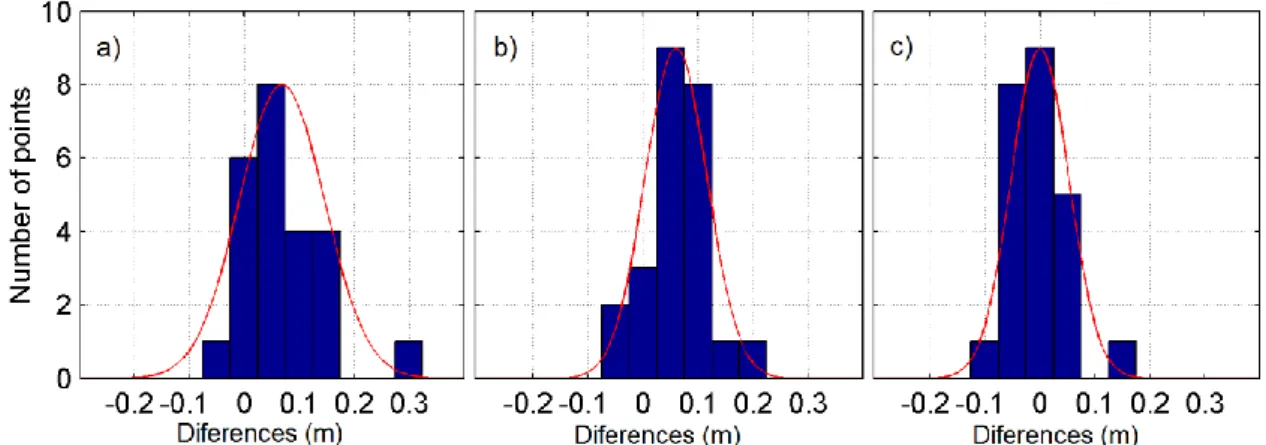
Final, the residual value for the reference points extracted from the LSM was used too.Table 2 and Figure 9 shown the descriptive statistics of the absolute differences between the geoid heights of the local geoid models and the geoid heights computed from the 24 GNSS/levelling points (Equation 41). It can be seen that the Quartile Coefficient of kurtosis is similar for all the models, but the
N
Grav (Figure 6) andN
Final (Figure 8) values have less discrepancy and greater accuracy than theN
MAPGEO2015 values. Furthermore, theN
Grav presented more symmetric than the other models and the discrepancies of the differences (maximum minimumdifferences ) of theGrav
N
(0.254 m) andN
Final (0.251 m) are similar.Table 2: Descriptive statistics of the differences between geoid heights from different models (
MAPGEO2015
N
,N
Grav andN
Final) and from 24 GNSS/levelling points (N
GNSS / Lev).Statistics
N
MAPGEO2015
N
GNSS / LevN
Grav
N
GNSS / LevN
Final
N
GNSS / LevMaximum (m) 0.320 0.205 0.162 Minimum (m) -0.065 -0.049 -0.089
Average (m) 0.069 0.060 0.000 Root-mean-square deviation (m) 0.102 0.081 0.051 Asymmetry 1.261 0.267 1.001 Quartile Coefficient of kurtosis 0.260 0.277 0.295
Figure 9: Differences between geoid heights from different models and from 24 GNSS/levelling
points. a)
N
MAPGEO2015
N
GNSS Lev/ . b)N
Grav–
N
GNSS Lev/ . c)N
Final–
N
GNSS Lev/ .Table 3 and Figure 10 have shown the descriptive statistics of the relative differences of the geoid heights with pairs of points (Equation 42). In this case, 265 baselines formed with minimum distances of 1 km were used, considering the 24 GNSS/levelling points.
Table 3: Descriptive statistics of relative differences of geoid heights with 265 pairs of points, formed with minimum distances of 1 km, considering
N
GNSS / Lev as reference andN
MAPGEO2015,Grav
N
andN
Final.Statistics
N
MAPGEO2015N
GravN
FinalMaximum (ppm) 26.231 22.561 23.451 Minimum(ppm) 0.016 0.000 0.003
Average (ppm) 2.896 1.985 2.348 Root-mean-square deviation (ppm) 4.853 3.428 4.156
Figure 10: Relative differences of geoid heights with 265 pairs of points, formed with minimum
distances of 1 km, considering
N
GNSS Lev/ as reference and: a)N
MAPGEO2015; b)N
Grav; and c) FinalThe Table 3 and Figure 10 shown that
N
Grav has better results than the otter models, with maximum, average and root-mean-square deviation values of relative differences of 22.561 ppm, 1.985 ppm and 3.428 ppm, respectively. The maximum relative difference values are presents until 13 km of baselines forN
Grav andN
FINAL (Figure 10). After this, the relative difference values are less than 10 ppm.Analyzing the results, although
N
FINAL presents less average and root-mean-square deviation values of the absolute differences,N
Grav presents more symmetric than the other models analyzed. Also,N
Grav shown maximum, average and root-mean-square deviation values of relative differences less than the otter models analyzed. Beside this,N
Grav are not adjusted with the points used as reference and may not be dependent of the spatial distribution of them. So, this study suggests thatN
Grav is the best model to be used for Federal District.7. Conclusion
This paper presents a review of the procedures adopted to compute local geoid models and their application at Federal District, Brazil, using procedures, called GRAVTool, developed and based on MATLAB® software.
The numerical results for the study area show that the geoid height values (
N
Grav andN
FINAL) extracted from the local geoid model computed had lower difference values compared to those extracted from the regional geoid model (N
MAPGEO2015) available for the area. This shows better compatibility of the geoid model calculated with the geoid heights derived from the geometrical levelling technique supported by GNSS positioning.In addition to the compatibility, the calculated root-mean-square-deviation of the geoid height is near to the uncertainty of the geoid heights used as a reference, which suggests that the local geoid model calculated is consistent.
Although
N
FINAL presents less average and root-mean-square deviation values of the absolute differences,N
Grav presents more symmetry than theN
FINAL andN
MAPGEO2015 . Also,N
Grav shown lower maximum, average and root-mean-square deviation values of relative differences less than the otter models analyzed. Beside this,N
Grav are not adjusted with the points used as reference and, because this, may not be dependent of the spatial distribution of them. So, this study suggests thatN
Grav is the best model to be used of Federal District.It is important to mention that the large amount of ground gravity data provided by the IBGE, ANP and collected in the field together with a suitable geopotential model improved the results for the geoid models.
ACKNOWLEDGEMENT
The authors are thankful BDEP/ANP, IBGE for supplying the ground gravity data, ICGEM and Gilardoni et al. (2015) for providing the GECO global geopotential model and FAPDF for the financial support.
REFERENCES
Abbak, R.A. Erol, B. Ustun, A. 2012. Comparison of the KTH and remove-compute-restore techniques to geoid modelling in a mountainous area. Computers and Geosciences, 48, pp.31-40. Ayhan, M.E. 1993. Geoid determination in Turkey. Bulletin Geodesique, 67, pp.10–22.
Blitzkow, D. 1986. A combinação de diferentes tipos de dados na determinação das alturas geodais. PhD. Instituto Astronômico e Geofísico. Universidade de São Paulo.
Blitzkow, D. Matos, A.C.O.C. Fairhead, J.D. Pacino, M.C. Lobianco, M.C.B. Campos, I.O. 2012. The progress of the geoid model computation for South America under GRACE and EGM2008 models. International Association of Geodesy Symposia, 136, pp.893-899.
Cook, A.H. 1959. The External Gravity Field of a Rotating Spheroid to the order of e3.
Geophysical Journal International. 2(3), pp.199-214.
Erol, B.; Erol, S. 2013. Learning-based computing techniques in geoid modeling for precise height transformation. Computers and Geosciences, 52, pp.95-107.
Featherstone, W.E. Holmes, S.A. Kirby, J.F. Kuhn, M. 2004. Comparison of Remove-Compute-Restore and University of New Brunswick Techniques to Geoid Determination over Australia, and Inclusion of Wiener-Type Filters in Reference Field Contribution. Journal of Surveying
Engineering, 130, pp.40-47.
Featherstone, W.E. Dentith, M.C. 1997. A Geodetic Approach to Gravity Reduction for Geophysics. Computers and Geosciences, 23(10), pp.1063-1070.
Fotopoulos, G. Kotsakis, C. Sideris, M.G. 1999. A new Canadian geoid model in support of levelling by GPS. Geomatica, 53, pp. 53-62.
Gilardoni, M. Reguzzoni, M. Sampietro, D. 2015. GECO: a global gravity model by locally combining GOCE data and EGM2008. Studia Geophysica et Geodaetica, 60(2), pp.228-247. Heiskanen, W.A. Moritz, H. 1967. Physical Geodesy. W.H. Freeman and Co., San Francisco. Heiskanen, W.A. Moritz H. 1985. Physical Geodesy. 4rd ed. Editorial IGN.
Hirt, C. 2011. Mean kernels to improve gravimetric geoid determination based on modified Stokes’s integration. Computers and Geosciences, 37, pp.1836-1842.
Hofmann-Wellenhof, B. Moritz, H. 2005. Physical Geodesy. 2rd. ed. Springer, Springer-Verlag Wien.
Holmes, S.A. Featherstone, W.E. 2002. A unified approach to the Clenshaw summation and the recur-sive computation of very high degree and order normalized associated Legendre functions.
Journal of Geodesy, 76(5), pp.279-299.
Kirby, J.F. Featherstone, W.E. 1997. A study of zero- and first-degree terms in geopotential models. Geomatics Research Australasia, 66, pp.93-108.
Kuroishi, Y. 1995. Precise determination of geoid in the vicinity of Japan. Bulletin of the
Geographical Survey Institute, 41, pp.1-94.
Moritz, H. 1984. Geodetic Reference System 1980. Buletin géodésique, 58(3), pp. 388-398. Petit, G. Luzum, B. 2010. IERS Conventions (2010). IERS Technical Note No. 36. Verlag des Bundesamts für Kartographie und Geodäsie.
Sansò, F. Sideris, M.G. 2013. Geoid determination – theory and methods. 1st ed. Springer-Verlag Berlin Heidelberg.
Schwarz, K.P. Sideris, M.G. Forsberg, R. 1990. The use of FFT techniques in physical geodesy.
Geophysical Journal International, 100, pp.485-514.
Sideris, M.G. She, B.B. 1995. A new, high resolution geoid for Canadá and part of the U. S. By 1D-FFT method. Bulletin Géodésique, 69, pp.92-108.
Smith, D.A. 1998. There is no such thing as The EGM96 geoid: Subtle points on the use of a global
geopotential model. IGeS Bulletin No. 8, International Geoid Service.
Smith, D.A. Small, H.J. 1999. The CARIB97 high resolution geoid height model for the Caribbean Sea. Journal of Geodesy, 73(1), pp.1-9.
Sjoberg, L.E. 2005. A discussion on the approximations made in the practical implementation of the remove-compute-restore technique in regional geoid modeling. Journal of Geodesy, 78, pp. 645-653.
Stokes, G.G. 1849. On the variation of gravity on the surface of the earth. Transactions of the
Cambridge Philosophical Society, 8, pp.672-695.
Tocho, C. Vergos, G.S. Pacino, M.C. 2014. Evaluation of GOCE/GRACE Derived Global Geopotential Models over Argentina with Collocated GPS/Levelling Observations. International
Association of Geodesy Symposia, 141, pp.75-83.
Torge, W. 1991. Geodesy. 2rd, de Gruyter, Berlin.
Vaníček, P. Kleusberg, A. 1987. The Canadian geoid - Stokesian approach. Manuscripta
Geodaetica, 12, pp.86-98.
Wichiencharoen, C. 1982. The indirect effects on the computation of geoid undulations. Report No. 336 Dept. of Geodetic Science and Surveying, The Ohio State University, Columbus.
Wong, L. Gore, R. 1969. Accuracy of Geoid Heights from Modified Stokes Kernels. Geophysical
Journal of the Royal Astronomical Society, 18, pp.81-91.
Zhang, K. Featherstone, W. Stewart, M. Dodson, A. 1998. A new gravimetric geoid for Austria. In: Second Continental Workshop on the Geoid, Reports of the Finnish Geodetic Institute.
Recebido em 13 de dezembro de 2016. Aceito em 4 de maio de 2017.