Universidade de Lisboa
Faculdade de Medicina de Lisboa
Genetic Profiling of Pediatric
Brain Gliomas
Laura Passos Morgado Franco Frazão
Orientadores:
Doutora Maria Lúcia Primo Nobre de Oliveira Roque
Professor Doutor José Guilherme de Brito Cortez Pimentel
Dissertação especialmente elaborada para obtenção do grau de
Mestre em Neurociências
A impressão desta dissertação foi aprovada pelo Conselho Cientifico da
Faculdade de Medicina de Lisboa em reunião de 22 de Março de 2016
I
Agradecimentos
À Doutora Lúcia Roque, pela oportunidade, pelo conhecimento transmitido, pela disponibilidade e pela paciência.
Ao Professor Doutor José Pimentel pela disponibilidade e interesse no trabalho. Também pela classificação histológica dos tumores e pela cedência dos mesmos, sem os quais este trabalho não seria possível.
À Doutora Carmo Martins, pela disponibilidade constante, pelo apoio e pelo que me ensinou. Ao Dr. Vasco e à Joaquina pelo acompanhamento e ajuda no laboratório.
À Doutora Ana Rita Silvestre pela ajuda na obtenção dos tumores e pelo interesse que sempre demonstrou sobre o trabalho.
À Doutora Manuela Mafra pela classificação histológica de alguns tumores. Ao Dr. Duarte Salgado e à Dra. Sofia Nunes por terem cedido os dados clínicos dos pacientes, pela disponibilidade e interesse no trabalho. Ao Dr. José Miguens, Dra. Cláudia Faria, Dr. Amets Sagarribay e Dr. Mário Matos por de forma indirecta terem participado neste trabalho, cedendo amostras de tumores e dados clínicos dos pacientes.
Aos meus pais, irmãos, família, amigos e ao Sebastião pelo apoio, ajuda e compreensão.
Muito Obrigada.
II
Abstract
The genetic alterations in pediatric gliomas can be used as diagnostic and prognostic markers and are the basis for the development of new target therapies that, ideally, would be associated with less mortality and morbidity.
The aim of this study was to determine the genetic profile of pediatric gliomas and to do the translation of the genetic data for the clinical and laboratorial practice. Thus, the frequency of alterations in BRAF, CDKN2A, MYB, MYBL1, FGFR1, H3F3A, H3F3B and HIST1H3I genes were analyzed in 109 pediatric gliomas using Fluorescent In Situ Hybridization (FISH) and Sequencing using Sanger methodology.
In the present project we found that the BRAF/KIAA1549 rearrangement was associated with cerebelar pilocytic astrocytomas and was exclusive of low-grade gliomas, being useful as a diagnostic marker. The BRAFV600E mutation was associated with a better patients’ overall survival and the deletion of the CDKN2A gene was associated with tumor recurrences. So, these two genetic alterations may be used as prognostic markers in pediatric gliomas. A cell line was established from a high-grade glioma that harbor the BRAFV600E mutation. The identification of MYB, MYBL1 and FGFR1 rearrangements by FISH did not seem to be useful as diagnostic or prognostic markers. K27M and G34R/V mutations were identified in the H3F3A gene and were shown to be exclusive of high-grade gliomas and to vary with the tumor location and patients´ age.
In sum, it was determined, for the first time, the genetic profile of pediatric gliomas in the Portuguese population and it was demonstrated that it is useful to the tumor characterization, with prognostic and diagnostic information. In this context, the establishment of cell lines from tumors with specific genetic alterations, such as the BRAFV600E mutation, may be the basis for susceptibility trials to new drugs and for a better understanding of the disease.
Key-words: pediatric gliomas; BRAF gene; MYB, MYBL1 and FGFR1 genes; CDKN2A gene; histone
III
Resumo
As alterações genéticas presentes em gliomas pediátricos constituem importantes marcadores de diagnóstico e prognóstico e são base para o desenvolvimento de novas formas terapêuticas, que se espera, impliquem menor mortalidade e morbilidade.
Neste trabalho avaliámos a frequência de alterações nos genes BRAF, CDKN2A, MYB,
MYBL1, FGFR1, H3F3A, H3F3B e HIST1H3I com o objetivo de determinar o perfil genético dos
gliomas pediátricos que foram referidos ao IPOLFG, e fazer a translação dos dados genéticos para a prática clínica e laboratorial. Assim, 109 tumores foram analisados por “Fluorescent In
Situ Hybridization (FISH)” e por sequenciação pelo método de Sanger.
Foi observado que o rearranjo BRAF/KIAA1549 estava associado a astrocitomas pilocíticos com localização cerebelar e era exclusivo dos gliomas de baixo grau, sendo útil como marcador de diagnóstico nestes tumores. A mutação BRAFV600E estava associada a uma maior sobrevivência dos pacientes e a deleção do gene CDKN2A com a ocorrência de recidivas. Assim, parece que estas duas alterações genéticas podem ser usadas como marcadores de prognóstico em gliomas pediátricos. Foi estabelecida uma linha de cultura a partir de um glioma de alto grau com a mutação BRAFV600E. A identificação, por FISH, de rearranjos nos genes MYB, MYBL1 e
FGFR1, não pareceu ser útil a nível de diagnóstico ou prognóstico. Nos genes das histonas, as
mutações K27M e G34R/V eram exclusivas dos gliomas de alto grau e só foram observadas no gene H3F3A. Estas mutações estavam associadas à localização do tumor e idade do paciente.
Em suma, foi caracterizado, pela primeira vez, o perfil genético de gliomas pediátricos na população portuguesa e foi demonstrada a sua utilidade para a caracterização tumoral, com informação diagnóstica e prognóstica. Neste contexto, o estabelecimento de linhas tumorais com alterações genéticas, como a mutação BRAFV600E, pode servir de base para ensaios de susceptibilidade a novos fármacos e para um melhor conhecimento da doença.
IV
Resumo Alargado
Os tumores primários do Sistema Nervoso Central (SNC) são a seguir às leucemias, os tumores pediátricos mais frequentes e constituem a principal causa de morte, por cancro, em crianças e adolescentes com menos de 20 anos de idade. Estes tumores estão também associados a uma elevada taxa de morbilidade provocada pelos tratamentos (cirurgia, radioterapia e quimioterapia) a que estas crianças são habitualmente sujeitas 1.
Os gliomas são o tipo histológico mais comum dos tumores pediátricos do SNC e têm a sua origem no tecido neuroepitelial e nas células da glia. De acordo com a última classificação da Organização Mundial de Saúde, de 2007, estes tumores são subdivididos em quatro subgrupos histológicos principais: (I) Tumores astrocíticos; (II) Tumores oligodendrogliais; (III) Tumores neuronais e neurogliais; (IV) Ependimomas. Este último subgrupo é geralmente excluído desta classificação, sendo considerado uma doença distinta. Posteriormente, os gliomas são classificados de acordo com a sua malignidade em 4 graus (I-IV), sendo o grau I o menos e o grau IV o mais agressivo 2. No entanto, devido à sua grande heterogeneidade, a
classificação histológica e biológica dos gliomas pediátricos, não é na maior parte das vezes fácil, pelo que o risco de sobre-tratamento, com todos os efeitos secundários daí decorrentes, é grande. Esta situação começou a alterar-se em 2012 com o surgimento de trabalhos de sequenciação massiva dos vários tipos de gliomas, que permitiram classificar tumores histologicamente idênticos em sub-grupos genéticos e epigenéticos distintos 1.
Assim, um conjunto de alterações genéticas começou a ser identificado como característico dos gliomas pediátricos. Por exemplo, no contexto dos gliomas de baixo grau, foi verificado que o rearranjo do gene BRAF, que resulta na formação do gene de fusão
BRAF/KIAA1549 era exclusivo deste tipo de gliomas e característico de astrocitomas pilociticos;
que a mutação BRAFV600E embora comum, não era exclusiva destes gliomas; e que a existência de rearranjos nos genes MYB, MYBL1 e FGFR1 poderia estar relacionada com os gliomas pediátricos difusos (gliomas de baixo grau com comportamento infiltrativo)3–6.
Todas estas alterações genéticas identificadas em gliomas de baixo grau levam a uma activação da via de sinalização MAPK/ERK. Assim, levantou-se a hipótese de os gliomas pediátricos de baixo grau serem uma “doença de uma única via de sinalização” 7. Visto que a
activação da via MAPK/ERK pode resultar tanto em proliferação, sobrevivência e tumorigénese, como em diferenciação e senescência celular, foi possível perceber o porquê dos gliomas de baixo grau raramente se tornarem tumores de alto grau. Neste contexto, foi demonstrado que a deleção do gene CDKN2A em gliomas pediátricos com alterações no gene BRAF estava
V associada a tumores mais agressivos, provavelmente por refletir uma falha ou em escape da senescência celular induzida 5,8,9.
Por outro lado, as mutações K27M e G34R/V nas histonas H3.3 e H3.1 são exclusivas dos gliomas pediátricos de alto grau. Enquanto a mutação K27M na histona H3.1 parece ser exclusiva de “diffuse intrinsic pontine gliomas” (tumor agressivo com localização no tronco cerebral) e glioblastomas não localizados no tronco cerebral; a mutação K27M na histona H3.3 é específica de tumores com localização na linha média e de pacientes mais jovens, e as mutações G34R/V da mesma histona só foram observadas em tumores de pacientes mais velhos e localizados no córtex cerebral. A mutação K27M na histona H3.3 está também associada a um pior prognóstico, relativamente à mutação G34R/V 10–13.
O objectivo deste trabalho é determinar, retrospectivamente, o perfil genético dos gliomas pediátricos referidos ao IPOLFG e fazer a translação dos dados genéticos para a prática laboratorial. Para isso, foi investigada, numa série de 109 gliomas pediátricos, a frequência de alterações nos genes BRAF, MYB, MYBL1, FGFR1, CDKN2A, H3F3A, H3F3B e HIST1H3I. Para além de terem sido relacionadas com a classificação histológica e a localização do tumor, a idade e género do paciente, estas alterações genéticas foram, também, identificadas em linhas celulares estabelecidas a partir de tumores. Assim, a parte experimental deste trabalho foi dividida em três fases principais: a primeira consistiu numa análise por “Fluorescent In Situ Hybridization (FISH)”, a segunda na sequenciação pelo método de Sanger, e a terceira em cultura celular. Enquanto a técnica FISH foi utilizada para identificar o rearranjo BRAF/KIAA1549, os rearranjos dos genes MYB, MYBL1 e FGFR1, e a deleção do gene CDKN2A; a sequenciação pelo método de Sanger foi utilizada para identificar mutações nos genes BRAF, H3F3A, H3F3B e HIST1H3I. As amostras dos gliomas foram recebidas em material fresco ou embebidas em parafina.
Dos 109 gliomas estudados, 67 eram de grau I, 13 de grau II, 14 de grau III, 8 de grau IV e 7 com classificação histológica não especificada. Na série de gliomas pediátricos analisados, como descrito na literatura, a presença do rearranjo BRAF/KIAA1549 era exclusiva dos gliomas baixo grau e estava relacionada com a histologia de astrocitoma pilocítco (p-value <0.0001) e com tumores localizados no cerebelo (p-value <0.0001). Estes resultados sugerem que a identificação deste rearranjo genético na prática laboratorial tem utilidade como marcador de diagnóstico em gliomas pediátricos de baixo grau. A ocorrência da mutação BRAFV600E era independente do tipo histológico e localização do tumor bem como da idade ou género do paciente. No entanto, estava associada a uma maior sobrevivência dos pacientes
VI pediátricos, os nossos resultados sugerem que utilização desta mutação como marcador de prognóstico pode ser útil. Além disto, durante este trabalho foi estabelecida uma linha de cultura a partir de um glioma de alto grau com a mutação BRAFV600E que poderá servir de base para ensaios de susceptibilidade a novos fármacos e para um melhor entendimento da doença a nível molecular.
Quanto à deleção do gene CDKN2A foi verificado que a sua incidência aumentava com o grau dos tumores: 10% nos gliomas de grau I, 30% nos de grau II e III, e 42.9% nos de grau IV. Além disso, todos os gliomas de baixo grau apresentavam uma deleção heterozigótica deste gene e só em três gliomas de alto grau foram identificadas deleções homozigóticas do gene
CDKN2A. Esta alteração genética mostrou estar relacionada com a ocorrência de recidivas (p-value=0.0149), sugerindo a sua utilização como marcador de prognóstico em gliomas
pediátricos.
A identificação, por FISH, de rearranjos nos genes MYB, MYBL1 e FGFR1, não pareceu ser útil a nível de diagnóstico ou prognóstico visto que na série de gliomas estudados só foi identificado um rearranjo do gene MYB num glioma com classificação histológica não especificada, um rearranjo do gene MYBL1, não descrito anteriormente, num astrocitoma pilocítico e nenhum rearranjo do gene FGFR1.
As mutações K27M e G34R/V só foram identificadas no gene H3F3A e, como descrito na literatura, estavam relacionadas com a localização do tumor e idade dos pacientes. Foi também possível verificar que estas mutações não são exclusivas dos astrocitomas pediátricos de alto grau, estando presentes noutros gliomas de alto grau como tumores oligoastrocíticos e oligodendrogliais. Isto levanta a hipótese de a classificação usada hoje em dia para a estratificação dos glioblastomas poder ser estendida para outros subtipos histológicos de gliomas de alto grau.
Assim, com este trabalho, foi possível verificar que o perfil genético de gliomas pediátricos pode ser útil para melhorar a classificação tumoral, tanto com informação diagnóstica como prognóstica, e para melhorar o conhecimento da doença, o que idealmente, contribuirá para o desenvolvimento de terapias mais eficazes.
VII
Table of Contents
Agradecimentos ... I Abstract ... II Resumo ... III Resumo Alargado ... IV Table of Contents ... VII List of Figures ... IX List of Tables and Supplementary Tables ... X List of Abbreviations, symbols and conventions ... XII - Introduction: ... 1
1 - Pediatric Tumors of the Central Nervous System (CNS): ... 1
2 - Tumorigenesis ... 2
3 - Pediatric Low-grade Gliomas (PLGGs) ... 4
3.1 – BRAF-driven gliomas ... 4
3.2 – Grade II Gliomas ... 8
3.2.1 – MYB and MYBL1 genes ... 8
3.2.2 – FGFR1 gene ... 9
4 – Pediatric High-grade Gliomas (PHGG) ... 10
II - Objectives ... 13
III - Materials and Methods ... 14
1 – Biological Material – Patients Samples ... 15
2 – Fluorescent In Situ Hybridization (FISH) ... 16
2.1 – DNA Probes Preparation ... 17
2.2 - The FISH Methodology ... 19
2.2.1 - Nuclei Extraction from paraffin embedded material: ... 19
2.2.2 – Imprint preparation from fresh material ... 20
2.2.3 – Glass slide de-paraffinization ... 20
2.2.4 – Pre-treatments of glass slides ... 20
2.2.5 – Conjunction heat denaturation of target DNA and probe ... 20
2.2.6 – Post-Hybridization Washes ... 21
2.2.7 – Probe detection ... 21
2.2.8 – FISH analysis ... 21
3 – Sequencing using Sanger Methodology ... 21
VIII
3.2 – DNA extraction from fresh material ... 22
3.3 – DNA extraction from cell culture ... 22
3.4 – DNA quantification ... 22
3.5 – Polymerase Chain Reaction (PCR) ... 23
3.6 – Sequencing ... 24
4 – Establishment of cell lines from tumors ... 25
5 – Statistical Analyses ... 25
IV – Results ... 26
1 – BRAF/KIAA1549 rearrangement ... 27
2 – BRAF V600E mutation ... 29
3 – MYB, MYBL1 and FGFR1 rearrangement ... 30
4 – CDKN2A deletion ... 31
5 – Histone genes mutations ... 33
6 – Tumor recurrences ... 35
7 – Cell Line ... 36
8 – Survival Curves ... 37
V – Discussion ... 38
1 – Study Population ... 38
2 – BRAF gene alterations ... 38
3 – MYB, MYBL1 and FGFR1 rearrangements ... 39
4 - CDKN2A gene deletion ... 41
5- Histone genes mutations ... 41
6 – Recurrences ... 42
VI - Conclusion ... 44
VII – Future Perspectives ... 45
VIII – Bibliography ... 46
IX
List of Figures
Figure I.1 – Classification of gliomas ………. 2
Figure I.2 – Overview of the major known mutations in PLGG……….4
Figure I.3 – Schematic representation of BRAF/KIAA1549 rearrangement………..5
Figure I.4 – The role of CDKN2A gene in BRAF-driven gliomas……….……….7
Figure I.5 - FGFR1 rearrangement: TKD duplication……….9
Figure I.6 - Distribution and Characteristics of H3.3-Mutated Gliomas………12
Figure III.1 – Schematic representation of the experimental work……….14
Figure III.2 – Representation of the study population………..15
Figure III.3 – The Principles of FISH………16
Figure III.4 – Schematic representation of the FISH methodology………..19
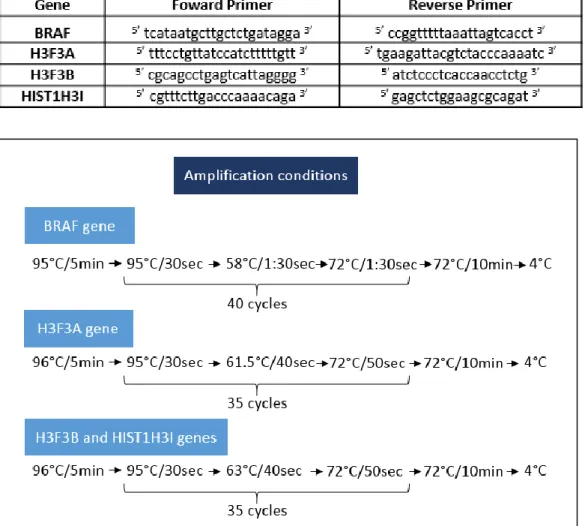
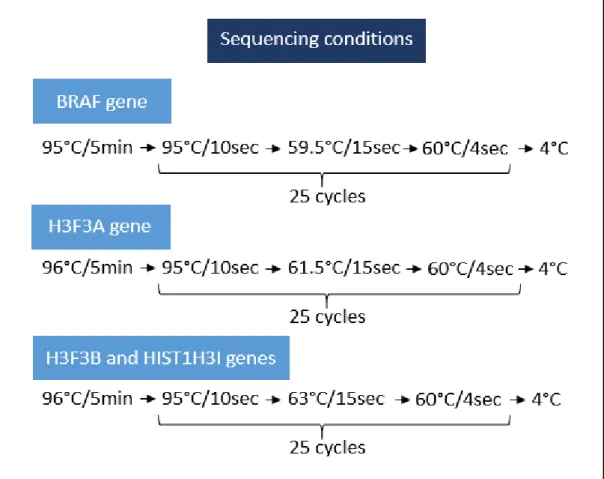
Figure III.5 - Programs used for PCR amplification of BRAF, H3F3A, H3F3B and HIST1H3I genes……….. 23
Figure III.6 – Programs used for sequencing reactions of BRAF, H3F3A, H3F3B and HIST1H3I genes………24
Figure IV.1 – Summary of the obtained results……….…….26
Figure IV.2 – Summary of the BRAF/KIAA1549 results……….28
Figure IV.3 – Summary of the BRAFV600E results………30
Figure IV.4 – Summary of the MYB, MYBL1 and FGFR1 results……….31
Figure IV.5 – Summary of the CDKN2A results………..………..….33
Figure IV.6 – Summary of the histone genes results……….34
Figure IV.7 – Summary of the H3F3A results in PHGG………..35
Figure IV.8 – Summary of the tumor recurrences……….…..35
Figure IV.9 – Summary of the tumor recurrences results………..36
Figure IV.10 – BRAFV600E: Survival proportions……….37
X
List of Tables and Supplementary Tables
Table III.1 – Probes used for FISH and their characteristics………..18
Table III.2 – Primers used for each gene PCR reaction………23
Table IV.1 – Cases studied for BRAF/KIAA1549 rearrangement………...27
Table IV.2 – Cases studied for BRAFV600E mutation……….29
Table IV.3 – Cases studied for CDKN2A gene deletion……….………..32
Supplementary Table 1 – Clinical features and genetic abnormalities of all 109 gliomas studied………53
XI
List of Abbreviations, symbols and conventions
BRAF – B-Raf proto-oncogene, serine/threonine kinase CDK – cyclin-dependent kinase
CDKN2A – Cyclin-Dependent Kinase Inhibitor 2A CLCN6 – Choride channel, voltage-sensitive 6 CNS – Central Nervous System
C-terminal/terminus – Carboxyl-terminal Cy3 – Cyanine 3
DAPI – 4’ 6-diamidino-2-phenylindole DNA – Deoxyribonucleic acid
dNTPs – Deoxynucleotides
ddNTPs – modified deoxynucleotides that lack a 3’-OH group EDTA – Ethylene Diamine Tetra Acetic acid
EGFR – Epidermal Growth Factor Receptor ERK – Extracellular signal regulated kinase ESR1 – Estrogen receptor 1
EZH2 – Enhancer of Zeste 2 Polycomb Repressive Complex 2 Subunit E2F – E2 transcription factor
FAM131B – Family with sequence similarity 131 member B FBS – Fetal Bovine Serum
FGFR1 – fibroblast growth factor receptor 1 FISH – Fluorescent In Situ Hybridization g - gram
GNAI1 – Guanine nucleotide binding protein (G protein), alpha inhibiting activity polypeptide 1 G1 phase – Gap 1 phase of the cell cycle
HIST1H3B – Histone cluster 1, H3b HIST1H3I – Histone cluster 1, H3i H3F3A – H3 histone, family 3A H3F3B – H3 histone, family 3B IDH1 – Isocitrate Dehydrogenase 1 IDH2 – Isocitrate Dehydrogenase 2
XII
IPOLFG – Instituto Português de Oncologia de Lisboa Francisco Gentil IQ – Intelligence Quotient
KIAA1549 – KIAA1549 gene KV – kilovolts
l – liter
MACF1 – Microtubule-Actin Crosslinking Factor 1 MAML2 – Mastermind like transcriptional coactivator 2 MAPK – Mitogen-activated protein kinases
MEK – Mitogen-activated protein kinase min – minutes
MRKN1 – an E3 ubiquitin ligase
MYB – v-myb avian myeloblastosis viral oncogene homolog
MYBL1 – v-myb avian myeloblastosis viral oncogene homolog-like 1 MYBL2 – v-myb avian myeloblastosis viral oncogene homolog-like 2 NF1 – Neurofibromin 1
ng - nanogram
NOS – Not Otherwise Specified gliomas N-terminal – Amino-terminal
PBS – Phosphate-buffered saline
PCDHGA1 – Protocadherin Gamma subfamily A, 1 PCR – Polymerase Chain Reaction
PDGFRA – Platelet Derived Growth Factor Receptor Alpha PHGG – Pediatric High Grade Gliomas
PI3K – Phosphoinositide 3-Kinase PLGG – Pediatric Low Grade Gliomas
PXA-like - pleomorphic xanthoastrocytomas-like QKI – QKI, KH domain containing, RNA binding Ras - Rat sarcoma viral oncogene homolog Rb1 – Retinoblastoma 1
RNF130 – Ring finger protein 130 rpm – rotations per minute RTK – Receptor Tyrosine Kinase SDS – Sodium dodecyl sulfate
XIII
SETD2 – SET Domain Containing 2 S phase – Synthesis phase of cell cycle
SRGAP3 – SLIT-ROBO Rho GTPase activating protein 3 SSC – Saline Sodium Citrate Buffer
TACC1 – Transforming, Acidic Coiled-Coil containing protein 1 TACC2 – Transforming, Acidic Coiled-Coil containing protein 2 TE – Tris-EDTA buffer
TKD – Tyrosine Kinase Domain TNB – Tris-NaCl-Blocking Buffer TP53 – Tumor Protein p53
WHO – World Health Organization WT – Wild-type
°C – Celsius degrees μ – micro-
1
I - Introduction:
1 - Pediatric Tumors of the Central Nervous System (CNS):
Tumors of the CNS account for 20-25% of all pediatric cancer diagnoses in the developed world 14,15, being the most prevalent group of cancers in children, after leukemia 15. Although
uncommon, pediatric brain tumors represent the leading cause of cancer-related mortality in children and adolescents aged 20 years and under 1,15–17; and the third leading cause of
cancer-related death in young adults aged 20 to 39 years 1. In addition to their relatively high mortality,
CNS tumors are associated with extensive morbidities such as pituitary dysfunction, growth hormone deficiency, epilepsy, vision loss, impaired motor skills, memory dysfunction, attention and behavioral disorders and reduced IQ. So, about 90% of survivors are left with long term cognitive and psycho-social deficits 15.
Diagnosis of pediatric CNS tumors is traditionally based on histological grading. CNS tumors are classified according to World Health Organization (WHO) criteria based on cell morphology and location of the tumor. According to the last classification, from 2007, the main tumor classes are the following: neuroepithelial, cranial and paraspinal nerve, meningeal, lymphoma and hematopoietic, germ cell, sellar region and metastatic. Tumors are further segregated into distinct histological grades, from WHO grade I to WHO grade IV, on the basis of defined cytological and histological features, including cellularity, mitotic activity, nuclear atypia, microvascular proliferation and necrosis. The WHO grading scheme functions as a malignancy scale (grade I being the least and grade IV the most aggressive), as represented in Figure I.1 2.
Gliomas are the most common histological type of primary CNS tumors in children 1;
they are a heterogeneous group of tumors that have neuroepithelial tissue origin and originate from glial cells (astrocytes, oligodendrocytes and ependymal cells) 18. So, there are four major
histologic classes of gliomas: (I) Astrocytic tumors; (II) Oligodendroglial tumors; (III) Neuronal and Mixed Neuroglial tumors, (IV) Ependymomas 1,19,20, often excluded from the glioma
classification and regarded as a distinct disease 14 (see Figure I.1).
Pediatric Low-grade Gliomas (PLGGs) account for nearly half of all pediatric CNS tumors
7,21, comprising a diverse group of WHO Grade I and II tumors 7 that are generally categorized as
nondiffuse or diffuse based on their extent of brain infiltration. Nondiffuse tumors, such as pilocytic astrocytomas, exhibit minimal infiltration, are predominantly benign and are often cured by surgery alone. In contrast, diffuse tumors such as diffuse astrocytomas, oligoastrocytomas and oligodendrogliomas, are associated with less favorable clinical outcomes,
2 including recurrence after initial resection, by virtue of their extensive infiltration and invasion into the brain 16 (Figure I.1).
Pediatric High-grade Gliomas (PHGG) comprise WHO Grade III and WHO Grade IV gliomas and remain one of very few incurable pediatric cancers, with a long-term survival rate of less than 10% 19. The most common histological subtypes are glioblastoma anaplastic
astrocytoma and anaplastic oligodendroglioma 19 and they account for 15-20% of pediatric brain
tumors 7.
Due to the great heterogeneity and histologic overlap, some tumors cannot be categorized and are often referred to as Not Otherwise Specified gliomas (NOS). In low-grade gliomas, this entity represents nearly one-third of all PLGGs 16.
2 - Tumorigenesis
Cancer is a genetic disease that involves dynamic changes in the genome. So, despite the existence of distinct types of human cancer, the development of genomic instability and epigenetic modifications are essential for normal cells to acquire a variety of characteristics (such as self-sufficiency in growth signals, insensitivity to growth-inhibitory signals, evasion of programed cell death and immune destruction, limitless replicative potential, sustained
Figure I.1 – Classification of gliomas. (A) WHO Grading of Gliomas, adapted from Louis, et al (2007)2. (B)
3 angiogenesis, tissue invasion and metastasis, and changes in cellular metabolism) that will rule their transformation into malignant cells 22,23.
For example, in the context of the development of genomic instability, the activating mutations or genetic rearrangements, affecting the structure of the B-Raf protein and resulting in a constitutive activation of mitogen-activated protein kinase (MAPK) pathway, are tightly related with the growth factor independence in tumor cells, contributing to uncontrolled cell proliferation. Another example is related with the insensitivity to growth-inhibitory signals in cancer cells that are tightly related with somatic, loss of function mutations or genetic rearrangements involving tumor suppressor genes (such as RB1 and TP53 genes). The loss of function of TP53 gene is also associated with evasion to apoptosis 23.
In the context of epigenetic modifications, the repression of some genes through promoter methylation and the de-repression of others through demethylation, may also contribute importantly to tumor progression, not only in the cancer cells but also in the altered cells of the tumor-associated stroma 22,23. Moreover, hypomethylation (demethylation of
normally methylated sequences) has been associated with an extensive chromosomal instability which may favors tumor progression 22.
Like cancer, in general, gliomas develop as a result of genetic alterations that accumulate with tumor progression. Given the existent data that show that genetic alterations in gliomas vary according to the age of the patient, location, histology and tumor grade 1, it is
becoming clear that information derived from cytogenetics and molecular genetics will play an increasingly more important role in tumor classification, particularly with respect to providing more precise diagnostic and prognostic information about particular tumors. So, incorporating these findings as companion diagnostics to routine pathology seems to be essential for better stratifying tumors and for the development of targeted treatments 3. However, molecular
diagnostics have only recently begun to be incorporated into the initial evaluation of CNS tumors
4
3 - Pediatric Low-grade Gliomas (PLGGs)
PLGGs have been defined by MAPK/ERK pathway activation through a number of well-defined genetic aberrations 3,7, supporting the concept that PLGG is a “single pathway disease”
(see Figure I.2)1,5.
3.1 – BRAF-driven gliomas
About 95% of Grade I gliomas are characterized by defects in BRAF proto-oncogene, in the 7q34 region 3, that encodes the B-Raf protein, an intracellular serine-threonine kinase
member of the Raf kinase family that regulates the MAPK pathway signaling 1,5. This pathway
normally begins with the activation of a transmembrane receptor tyrosine kinase, which binds, phosphorylates and activates Ras, which in turn activates a Raf kinase, in turn activating
MEK1/2, leading to activation of the ERK1/2 transcription complex (see Figure I.2) 5.
Under normal circumstances, B-Raf N-terminal regulatory domain inhibits its C-terminal kinase domain. When Ras activates B-Raf, it binds to the N-terminal domain of B-Raf, the inhibition is released,and MEK is phosphorylated by the Raf kinases 5. Thus, activating mutations
or genetic rearrangements, affecting the N-terminal regulatory domain of B-Raf may result in a constitutive activation of MAPK pathway, involved in tumorigenesis 5.
Figure I.2 – Overview of the major known mutations in PLGG. In this figure the strikes indicate the genes known to be altered in PLGGs:
BRAF, MYB (c-MYB), MYBL1, FGFR1 and NF1. The
majority of the known genetic alterations in PLGGs lead to MAPK/ERK pathway activation. In some cases, the PI3K pathway is also activated. Adapted from Raabe, et al (2013). © 2013 American Association for Cancer
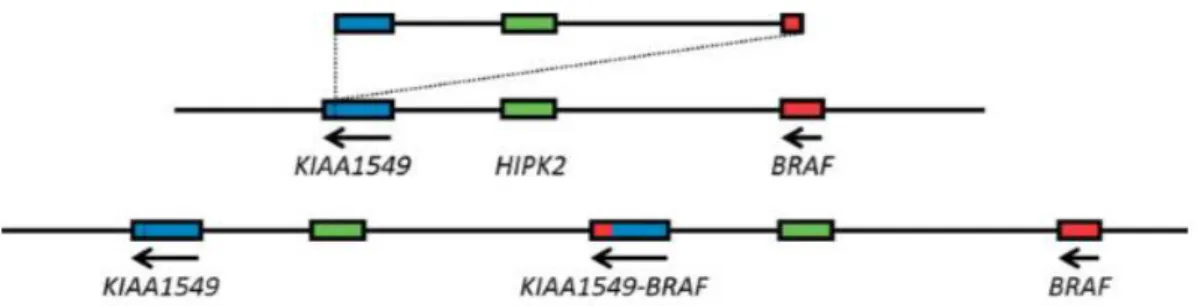
5 In PLGGs, the most common genetic alteration involving the BRAF gene is a tandem duplication and rearrangement between BRAF and a gene centromeric to BRAF, KIAA1549 5,19,
as demonstrated in Figure I.3. There are five known variants of this genetic rearrangement. The most frequent is the one that occurs between exon 16 of KIAA1549 and exon 9 of BRAF 24. The
mechanism leading to BRAF/KIAA1549 rearrangement is unclear. However, recent studies suggest that the process of microhomology-mediated break-induced replication may be involved in the generation of these structural rearrangements 1. The end result of this genetic
rearrangement is a fusion protein in which the N-terminus of the protein encoded by KIAA1549 gene is fused with the C-terminus of the protein encoded by BRAF gene, preserving the BRAF kinase domain 25. Consequently, it leads to the expression of the B-Raf protein that lacks its
N-terminal auto-inhibitory domain and is constitutively active, resulting in the activation of the MAPK/ERK pathway 1,3,21.
The normal function of the KIAA1549 gene is not known. However its participation in the fusion is apparently not critical because there are other alternative BRAF fusion partners such as FAM131B, SRGAP3, MACF1, RNF130, CLCN6, MRKN1 and GNAI1 genes that also result in an equally potent BRAF activation through loss of the N-terminal auto-regulatory domain 5,7,26.
The BRAF/KIAA1549 rearrangement has been tightly correlated with pilocytic astrocytoma morphology 5,6. However, Horbinski et al (2013)5 and Gierke, et al (2015)21 have
observed that the frequency of this genetic rearrangement lessens with age, from approximately 80% in the first decade of life to 50% in the second decade, and less than 10% of pilocytic astrocytomas in patients over 40 years. In children (first two decades of life), the BRAF/KIAA1549 rearrangement is nearly ubiquitous in posterior fossa pilocytic astrocytomas7.
Cerebellar astrocytomas are the most frequent posterior fossa tumors in children andnearly
Figure I.3 – Schematic representation of BRAF/KIAA1549 rearrangement. The
BRAF/KIAA1549 rearrangement is a result of a tandem duplication and fusion between BRAF and KIAA1549 genes. Adapted from Forshew, et al (2009)24.
6 80% of cerebellar pilocytic astrocytomas have this BRAF/KIAA1549 rearrangement, compared to 50%–55% of non-cerebellar pilocytic astrocytomas 5. However, the BRAF/KIAA1549 fusion is
also described in diffuse low-grade gliomas 7, though with lower incidences (15%). In PHGG the
rearrangement is rarely seen 5, suggesting that this genetic alteration is exclusive of PLGG. The
BRAF/KIAA1549 rearrangement also appears to be a relatively favorable prognostic marker 9.
Besides the BRAF/KIAA1549 rearrangement, several other different genetic alterations that transform the B-Raf kinase into a constitutively activated form have been reported to occur in PLGGs 19,21. One of these alterations is the BRAFV600E mutation, a somatic mutation causing
substitution of the amino acid valine by glutamic acid, at codon 600 5,7. Such somatic activating
BRAF mutations are observed in up to 7% of human cancers and occur most frequently in
malignant melanomas (60%) and papillary thyroid carcinomas (40-50%) 4,5,21.
Under normal circumstances, when B-Raf is activated by Ras (see Figure I.2), T599 and S602 amino acids, within the B-Raf activation segment, require phosphorylation to achieve maximal kinase activity. It was shown that, in human diseases, amino acids can be mutated to acidic residues to mimic phosphorylation and consequently activate kinases. Thus, it is thought that BRAFV600E mutation mimics the phosphorylation of the activating amino acids T599 and
S602, thereby leading to constitutive activation of the protein B-Raf which activates the MAPK
pathway in a Ras-independent manner 4,27.
This activating point mutation is highly prevalent in WHO Grade II pleomorphic xanthoastrocytomas 3,4 and in anaplastic pleomorphic xanthoastrocytomas 4. The BRAFV600E
mutation was also described to occur in 33% of the gagliogliomas, in 23% of the diffuse astrocytomas 3 and, in 10% of the glioblastomas 28. As BRAF mutation rarely occur in conjunction
with a BRAF/KIAA1549 rearrangement in the same tumor 5, its incidence in pilocytic
astrocytomas is low, around 6-9% 3,4.
The majority of BRAF-driven gliomas are low-grade and tend to stay that way 5. This may
be explained because the activation of the MAPK/ERK pathway can result in proliferation, survival and tumorigenesis but it can also trigger cell differentiation and senescence 5 (see Figure
I.4). Raabe, et al (2011)8 demonstrated this MAPK/ERK pathway duality in a pilocytic
astrocytoma model with constitutive BRAF activation: initially the expression of the BRAFV600E mutation strongly promoted colony formation, without leading to significantly increased proliferation, but subsequently, oncogene-induced senescence limited proliferation.
Moreover, it was shown by Horbinski, et al (2012)9 that the CDKN2A gene deletion in
(cyclin-7 dependent kinase inhibitor 2A) located in the 9p21 region, coded a tumor suppressor protein – p16. The p16 protein acts as a negative regulator of the proliferation of normal cells, controlling the progression through G1 into the S phase of the cell cycle. It interacts with the cyclin-dependent kinases CDK4 and CDK6, inhibiting theirs ability to interact with cyclins D and, consequently, to phosphorylate the retinoblastoma protein (encoded by the RB1 gene). This results in the non-release of E2F transcription factor that activates genes involved in the G1-S transition 22 (see Figure I.4). Thus, the worst outcomes associated with CDKN2A gene deletion
can be explained because it was shown that CDKN2A deletionin BRAF-driven tumors could
reflect a failure to induce senescence or an escape from the induced tumor senescence 8.
This CDKN2A gene deletion was also reported in several PHGGs with MAPK/ERK pathway activation 11,29. However, in PHGGs this pathway activation is usually accompanied by
impairment of the p53/Rb cell cycle pathway, which could explain why these tumors undergo progression rather than senescence 9.
Mistry, et al (2015)30 demonstrated that BRAFV600E mutations and CDKN2A deletions
constituted a clinically distinct subtype of pediatric secondary high-grade gliomas that arise from a primary PLGG, suggesting that these two genetic alteration may play a role in the malignant transformation of PLGGs.
Another mechanism that activates the MAPK/ERK pathway in PLGGs are alterations, such as mutations or deletion, of the NF1 gene (at 17q11.2), as represented in Figure I.2. The
NF1 gene is a tumor suppressor gene that encodes the Neurofibromin 1 protein. In normal
Figure I.4 – The role of CDKN2A gene in BRAF-driven gliomas: The activation of the MAPK/ERK pathway leads to the expression of the tumor suppressor gene CDKN2A. The p16 protein (coded by
CDKN2A gene) blocks the hyperphosphorylation of Rb (retinoblastomaprotein) byinhibitory binding to
the kinase CDK4/6. This keeps E2F transcription to bind to Rb, resulting in a permanent cell cycle stop in G1 phase (senescence). Adapted from Braig, 200748 (available in:
8 circumstances, this protein acts as a negative regulator of Ras in the MAPK/ERK pathway, preventing cell overgrowth. Alterations in NF1 gene are related with Neurofibromatosis type 1, which is a hereditary tumor syndrome associated with the appearance of neurofibromas, gliomas and malignant peripheral nerve sheath tumors. In PLGGs, the NF1-related tumors account for less than 15% of the cases 3,31.
3.2 – Grade II Gliomas
Zhang, et al (2013)3 reported, in their series of pediatric gliomas, that 56% of grade II
gliomas were characterized by mutually exclusive gene rearrangements inducing gain of function of the MYB, MYBL1 and FGFR1 genes.
3.2.1 – MYB and MYBL1 genes
The myb gene family consists of three members, named A-myb (8q22), B-myb (20q13) and c-myb (6q22), which encode nuclear proteins that function as transcriptional transactivators (MYBL1, MYBL2 and MYB, respectively). Although these three genes share an extensive homology, their expression and biological functions are different 14,32. While MYB and MYBL1
genes expression is restricted to specific cell types and stages of development, MYBL2 gene is expressed in all proliferating cells 32. So, the MYB gene is highly expressed in proliferation
epithelial, endothelial and hematopoietic cells and the MYBL1 gene expression is restricted to the developing mammary gland, spermatogenic tissue, central nervous system, T and B cells
33,34.
The overexpression of MYB gene had been reported to be associated with leukemias, lymphomas, pancreatic, colon and breast tumors and the disruption of MYBL1 expression leads to defects in the tissues where it is expressed that may be involved in tumorigenesis 33,34.
In their series of pediatric gliomas, Tatevossian, et al (2010)14 and Zhang, et al (2013)3
verified that MYB abnormalities at a genomic level, such as, MYB amplification or MYB rearrangements involving fusion with several different genes (ESR1, MAML2, PCDHGA1 and
QKI), were exclusive of diffuse gliomas, being present in 13%-22% of the cases. Moreover,
Ramkissoon, et al (2013) 16 demonstrated in their series of diffuse PLGGs that 28% of the diffuse
astrocytomas presented a partial duplication (of the first 9 exons) of MYBL1 gene that resulted in the expression of a truncated MYBL1 protein, without its C-terminal negative regulatory domain. However, Zhang et al (2013)3 only described MYBL1 rearrangements in 4.3% of the
9
3.2.2 – FGFR1 gene
The FGFR (Fibroblast Growth Factor Receptors) family consists of four genes encoding closely related transmembrane tyrosine kinase receptors, named FGFR1 to FGFR4. The FGFR1 gene (8p11) encodes the Fibroblast Growth Factor Receptor 1. The FGFR proteins contain in their full-length form a hydrophobic leader sequence, three immunoglobulin-like (Ig I, II, and III) domains, an acidic box, a transmembrane domain and, a divided tyrosine kinase domain (TKD) (Haugsten, Wiedlocha, Olsnes, & Wesche, 2010; Turner & Grose, 2010).
FGFR1 overexpression has been identified in breast and prostate cancer, being
associated with tumor progression and poorer prognostic due to cell division, motility, and formation of new blood vessels.
FGFR1 rearrangements and mutations were identified in pediatric gliomas 3,35. According
with Zhang, et al (2013) 3, the most frequent FGFR1 rearrangement in PLGGs consists in an
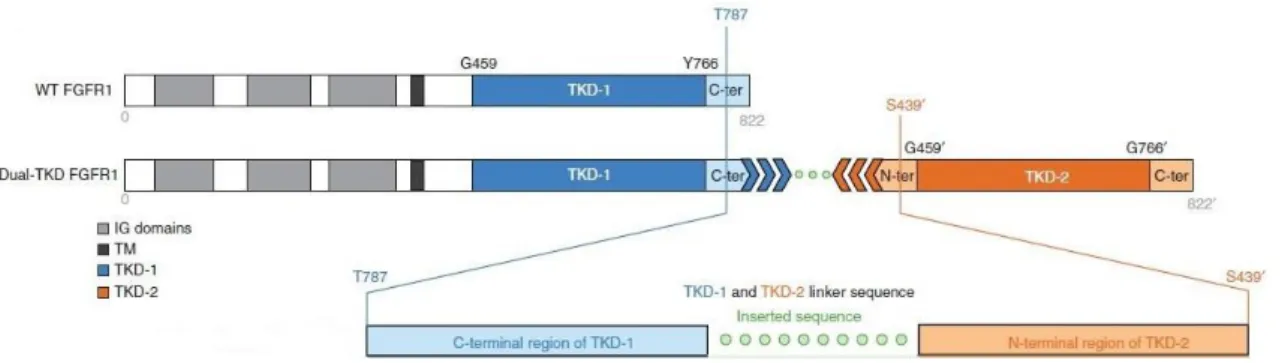
intragenic duplication of the entire FGFR1 region encoding the TKD, resulting in two full-length TKDs that lead to FGFR1 autophosporylation (Figure I.5). This rearrangement seemed to be exclusive of cerebral diffuse gliomas, being present in 24% of the cases. Zhang, et al (2013) 3 also
described other FGFR1 rearrangement in PLGGs, that involved fusion with TACC1 and TACC2 genes, in 2% and 0.7% of the cases, respectively. In their series of pediatric gliomas, Jones et al (2013) 35 and Zhang, et al (2013) 3 also reported three FGFR1 missense mutations (N554K,
V559M, N546K and K656E) occurring in 5% of pilocytic astrocytomas, in 6% of glioblastomas
harboring the K27M mutations and in one oligoastrocytoma.
In pediatric gliomas, all of the reported alterations in the FGFR1 gene lead to a substantial activation of both MAPK/ERK and PI3K pathways 3,35.
Figure I.5 - FGFR1 rearrangement: TKD duplication. In this figure the wild-type FGFR1 proteins (WT FGFR1) are compared with the most frequent FGFR1 rearrangement in PLGG. This rearrangement consists in a TKD duplication that results in two full-length TKDs (TKD1 and TKD2) that are separated by a linker sequence. This rearrangement leads to FGFR1 autophosphorylation, resulting in the activation of MAPK/ERK and PI3K pathways. Adapted from Zhang, et al (2013)3.
10
4 – Pediatric High-grade Gliomas (PHGG)
Gerges, et al (2013)1 and Yuen and Knoepfler (2013)36 showed that the most common
and exclusive alterations of PHGGs, occurring in 60-80% of cases, were K27M and G34R/V mutations in H3.1 and H3.3 histones.
The histones H3.1 and H3.3 belong to the histone H3 family. Histone H3 is one of the five main histones involved in the chromatin structure of the eukaryotic cells 36,37. However, the
two variants have distinct functions: while the H3.3 variant is enriched for posttranslational modifications associated with active transcription, in the H3.1 variant, marks associated with gene silencing are the most common 37. Moreover, while the histone H3.3 is encoded by two
different genes: H3F3A (1q41) and H3F3B (17q15) and is expressed in a replication-independent way 37,38, the histone H3.1 is encoded by several genes (being HIST1H3B gene one of them) and
is only expressed during the S phase of the cell cycle 37.
In human gliomas, the K27M mutation (a lysine substitution for a methionine at codon 27) was reported to occur in H3F3A and HIST1H3B genes, but G34R/V mutations (a glycine substitution for an arginine or a valine, at codon 34)were only found in the H3F3A gene. These mutations lead to alterations of the N-terminal tail of the histone proteins, a region enriched in posttranslational modifications 12,36. The roles of K27M and G34R/V mutations in tumorigenesis
are independent of each other and occur through different mechanisms (Figure I.6) 36.
The K27M mutation (in H3.3 and H3.1) is a gain-of-function mutation that leads to a global downregulation of the repressive histone mark H3K27me3 and, consequently, to an increased acetylation of K27 (K27ac is a histone mark mutually exclusive to K27me3 and associated with active transcription) 18,36,38. It is thought that the H3K27M mutant histone binds
aberrantly to EZH2 (the catalytic subunit of polycomb repressive complex 2 that spreads the
H3K27me3 mark throughout the genome) and inhibits it enzymatic activity 18,36. In this way,
reduced H3K27me3 levels and consequent loss of polycomb repressive complex 2 activity could be altering specific transcriptional processes within the cell (as gene activation and abnormal gene expression) and thus become a driver of gliomagenesis in K27M-mutant PHGG 1,18,36 (see
Figure I.6).
The G34R and the G34V mutations (in H3.3) interfere with the activating histone mark
H3K36me3, leading to an alteration on K36 methylation that is associated with abnormal gene
expression 1,18. As SETD2 is the only known methyltransferase that catalyzes H3K36me3 in
humans, it is thought that the H3.3G34R/V mutant histone inhibits its function, leading to a consequent decrease in H3K36me3 levels 12.
11 Schwartzentruber, et al (2012)10 and Sturm, et al (2012)11 observed in their series of
pediatric glioblastomas that the K27M and the G34R/V mutations were heterozygously expressed and mutually exclusive in tumors. Moreover, Sturm et al (2012)11 also demonstrated,
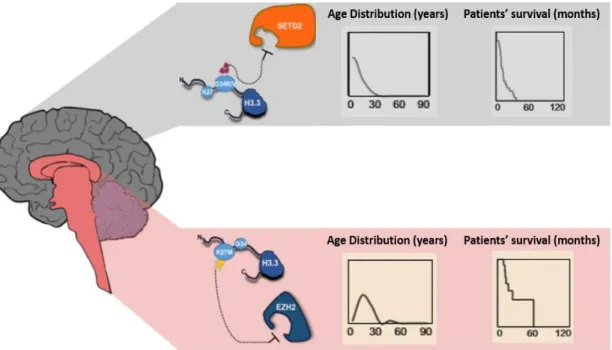
in the same series of pediatric glioblastomas, that the gene expression patterns of the K27M mutant tumors closely match with the mid- to late-fetal stages of striatum and thalamus development and that the G34R/V mutant signature appears to be most strongly expressed in early embryonic regions and early- to mid-fetal stages of neocortex and striatum development, possibly indicating different cellular origins and/or time of tumor initiation for these two subgroups. In fact, these histone mutations were shown to have different distributions according to the brain region and patients’ age: while H3.1 K27M mutation appears to be restricted to diffuse infantile pontine gliomas and non-brainstem pediatric glioblastomas in a younger range of patients (median age of 4.75 years) 12,13; H3.3 K27M mutations are specific of
tumors with midline locations (thalamus, pons and spinal cord) of patients with a median age of 10.5 years and; H3.3 G34R/V mutations were only observed in the cerebral cortex of older children and adolescents (median age of 18 years) 10,11 (Figure I.6). The comparison of the
patients’ overall survival also showed that the patients with gliomas harboring the K27M mutation had a shorter survival time and consequently a worse prognostic, relatively to the patients with G34R/V-mutant gliomas 11 (Figure I.6).
12 Other genetic alterations have been identified in pediatric and adult glioblastomas, such as alterations in PDGFRA, EGFR, IDH1 and IDH2 genes. Thus, seven biologic subgroups of pediatric and adult glioblastomas were identified based on specific molecular-genetic alterations and key clinical parameters, which are the following: K27 (characterized by the K27M mutation), G34 (characterized by the G34R/V mutations), PXA-like (characterized by the
BRAFV600E mutation and CDKN2A homozygous deletion), RTK-I (enriched for PDGFRA
amplification and CDKN2A gene deletion), RTK-II (associated with EGFR gene amplification and
CDKN2A gene deletion) Mesenchymal (characterized by low incidence of copy-number changes
and no characteristic point mutation) and IDH (associated with mutations in IDH1 and IDH2 genes). While the K27, the G34 and the PXA-like subgroups are exclusive of the pediatric population, the RTK-II subgroup was only identified in adult patients and the RTK-I, the Mesenchymal and the IDH subgroups were identified in both adult and pediatric populations. Moreover, the patients’ overall survival seems to be longer in PXA-like, IDH1 and G34 subgroups when compared with K27, RTK-I, RTK-II and Mesenchymal subgroups. All glioblastomas subgroups, except the K27, are associated with hemispheric locations 11,18,28,29.
Figure I.6 - Distribution and Characteristics of H3.3-Mutated Gliomas. G34R/V mutations
(gray, top) in H3F3A gene are located, primarily, in the cerebral hemispheres of older children and adolescents (median age 18 years) and appear to affect K36me3 levels, possibly through inhibition of the methyltransferase SETD2. K27M mutations (pink, down) in the H3F3A gene are found, primarily in midline locations (spinal cord, thalamus, pons and brainstem) of child patients (median age 10.5 years) and seem to attenuate the EZH2 methyltransferase function, decreasing global K27me3 levels. Moreover, the K27M mutation is associated with a shorter overall survival time when compared to the G34R/V mutations. Adapted from Yuen & Knoepfler (2013)36 and Schwartzentruber, et al (2012)10.
13
II - Objectives:
The aims of the current study were fundamentally two:
1) To establish the genetic profiling by investigating the frequency of alterations in the BRAF,
MYB, MYBL1, FGFR1, CDKN2A, H3F3A, H3F3B and HIST1H3I genes in pediatric gliomas; to
correlate them with clinical features, such as: patients’ gender, age at time of surgery, outcome and tumors’ location and histological classification and to discuss our findings in order to better stratify tumors and treatments
2) To analyze the aforementioned genetic alterations in cell lines established from pediatric brain tumors at the laboratory, aiming that these cell lines offer findings that may pave the way into the development of more efficient therapies for pediatric gliomas.
14
III - Materials and Methods:
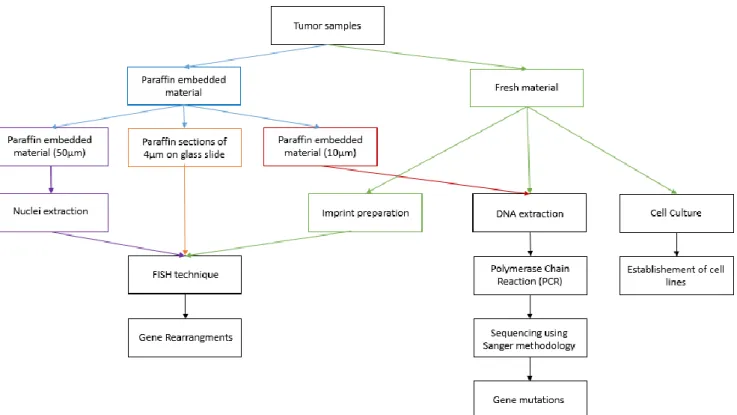
The present work can be divided into three major experimental stages: the first is a fluorescent in situ hybridization (FISH) analysis (in fresh and paraffin embedded material), the second is sequencing using Sanger methodology (in fresh and paraffin embedded material), and the third, cell culture (from fresh material).
While FISH analysis was used to identify the BRAF/KIAA1549 rearrangement and fusion,
MYB, MYBL1 and FGFR1 rearrangements and CDKN2A deletion; sequencing (using Sanger
methodology) was used to identify single point mutations in BRAF, H3F3A, H3F3B and HIST1H3I genes. Cell culture was used to establish cell lines from tumors (see Figure III.1).
Figure III.1 – Schematic representation of the experimental work. Tumor samples were received as fresh material or
embedded in paraffin, normally 10 cuts of 10µm and 3 cuts of 50µm or as 4µm cut on a glass slide. The experimental work was divided into three stages: (1) FISH (in fresh and paraffin embedded material) to analyze gene rearrangements; (2) Sequencing using Sanger methodology to analyze gene mutations; and (3) Cell culture (from fresh material) to establish cell lines from tumors.
15
1 – Biological Material – Patients Samples
In the context of this thesis, samples were studied from pediatric gliomas referred to the IPOFG from 1992 to 2015. Tumor samples were received as fresh material or embedded in paraffin, normally 10 cuts of 10µm and 3 cuts of 50µm or as 4µm cut on a glass slide.
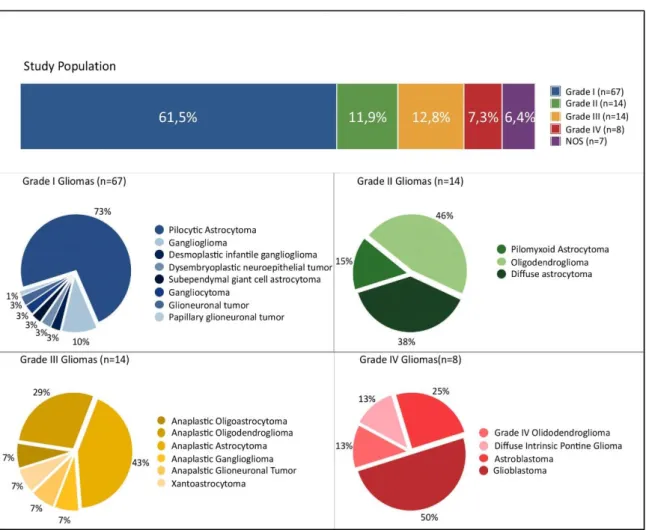
In total, 109 pediatric gliomas were studied for genetic alterations: 67 (61.5%) grade I gliomas, 13 (11.5%) grade II gliomas, 14 (12.8%) grade III gliomas, 8 (7.3%) grade IV gliomas and 7 (6.4%) not otherwise specified (NOS) gliomas (Figure III.2). The following variables were collected: patient’s gender, patient’s age at the time of tumor surgery or biopsy, tumor location and histological classification.
Figure III.2 – Representation of the study population. The graphic “Study Population” (on top) represents all the studied gliomas (in the context of this work) by WHO Grades. In this graphic, NOS (in purple) represents the group of the Not-Otherwise Specified Gliomas. Each one of the remaining four graphics (Grade I Gliomas, Grade II Gliomas, Grade III Gliomas and Grade IV Gliomas) represents the histological subgroups within each WHO grade. The number of gliomas studied is represented between brackets in each graphic.
16 Due to the lack of biological material or quality of the results, not all genes were analyzed in all samples.
Although posterior fossa gliomas normally include brainstem and cerebellum gliomas, for research purposes a subdivision in three groups was done based on the location of the glioma: cerebellum, brainstem and, when no further information was obtained, posterior fossa.
2 – Fluorescent In Situ Hybridization (FISH)
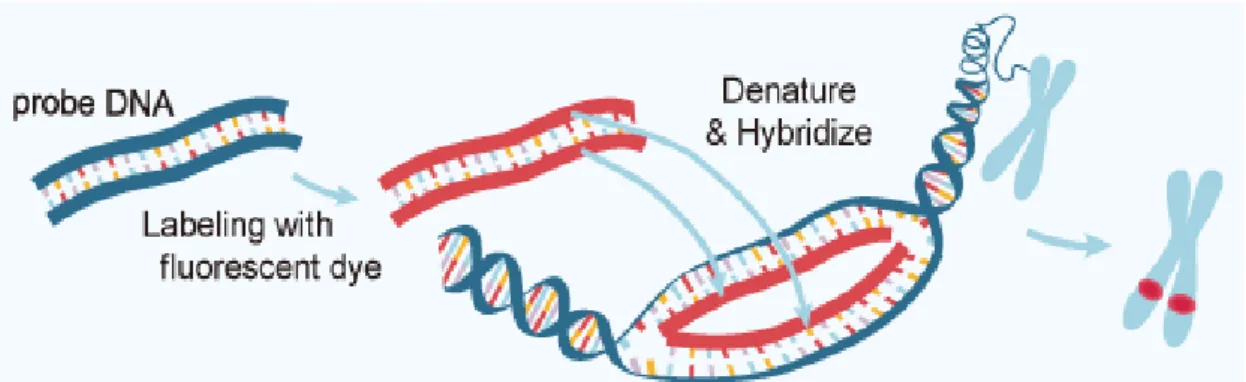
FISH is a cytogenetic technique in which a specific short strand of DNA labeled with a fluorescent dye (DNA probe) is used to detect genetic abnormalities in a target DNA sequence. Thus, FISH is based on the inherent organization of DNA into two antiparallel complementary strands: after denaturation of target DNA, single-stranded DNA probes are allowed to form hybrid double-stranded complexes with their complementary genomic sequence. FISH probes can be directly labelled with the incorporation of a fluorophore or indirectly labelled with the incorporation of a non-fluorescent hapten or molecule that uses an enzymatic or immunological detection system 39. The principles of FISH are represented in Figure III.3.
One of the most important considerations in FISH analysis is the choice of probe. There are three main types of probes, each with a different range of applications: whole-chromosome painting probes (mainly used in the identification of both numerical and structural chromosome aberrations in metaphase spreads), repetitive sequence or enumeration probes (mainly used as centromeric-specific probes to detect aneuploidies), and locus-specific probes (which are usually genomic clones used to detect structural rearrangements) 40,41.
Figure III.3 – The Principles of FISH. In FISH technique, a DNA probe (blue) is directly or indirectly labelled with a fluorescent dye (red). The labelled probe and the target DNA are then denatured and hybridized which allows the detection of the probe signal by a fluorescent microscope. Available in:
http://www.abnova.com
17 FISH enables a multicolor detection of simultaneously hybridized probes. So, beyond single signal probes, dual-color probes are broadly used as dual fusion (translocation) probes, break apart (“split-apart” rearrangement) probes, and deletion detection probes. In a dual fusion probe, each gene involved in a translocation is labelled in a different color (normally, red and green) and a juxtaposition of the genes (due to the translocation) results in a fusion signal (yellow). A break apart probe consists of sequences flanking the target gene causing the 5’ and 3’ portions of the gene, to be labeled in different colors (normally, red and green). Thus, a separation of the different colored signals, is observed when a translocation or a rearrangement occurs. In a deletion detection probe a locus-specific probe is used in conjunction with an enumeration probe 40,41.
In the present work, the FISH technique was performed in interphase nuclei with DNA probes indirectly labelled. These probes are labelled with biotine or digoxigenin that are then detected with specific antibodies: streptavidin combined with cyanine 3 (Cy3) fluorophore (Jackson ImmunoResearch Laboratories) and anti-digoxigenin-fluorescein (Roche), respectively. Cy3 is detected in the red spectrum, while fluorescein is observed in the green spectrum, thereby being detectable under a fluorescence microscope through a red and a green filter, respectively(Table III.1).
The BRAF/KIAA1549 rearrangement was studied by FISH with a dual fusion probe in which the BRAF gene was labeled in red and the KIAA1549 gene was labelled in green (see table III.1), as well as with an enumeration probe directed against the centromeric region of chromosome 7. Break apart probes were used to study MYB, MYBL1, and FGFR1 genes and to study the
CDKN2A gene; furthermore, a locus-specific probe for the gene and an enumeration probe for
chromosome 9 were used (see table III.1).
2.1 – DNA Probes Preparation
To label the DNA probes a commercial kit was used: the BioPrime® DNA Labeling System. The principle of this technique is to incorporate the biotin (or digoxigenin) into nucleic acid probes, which will be detected by anti-biotin or anti-digoxigenin antibodies, respectively. So, random primers (octamers) are annealed to the denatured DNA template and extended by Klenow fragment (large fragment of DNA polymerase I) in the presence of biotin or digoxigenin, to produce sensitive biotinylated or digoxigenin labeled-DNA probes for use. With this kit, a DNA synthesis occurs, resulting in a 10-40 fold amplification of the probe. To separate unincorporated nucleotides from the labelled probes, an ethanol precipitation was used. The probes were then dissolved in TE (DNA Hydration Solution, Citogene) and stored at -20°C. Labelled DNA was
18 precipitated in the presence of Human Cot-1 DNA® or UltraPure™ Salmon Sperm DNA Solution (for centromeric probes), as both block non-specific hybridization. A FISH protocol was used for metaphases from a normal human donor peripheral blood to confirm labelled probes specificity.
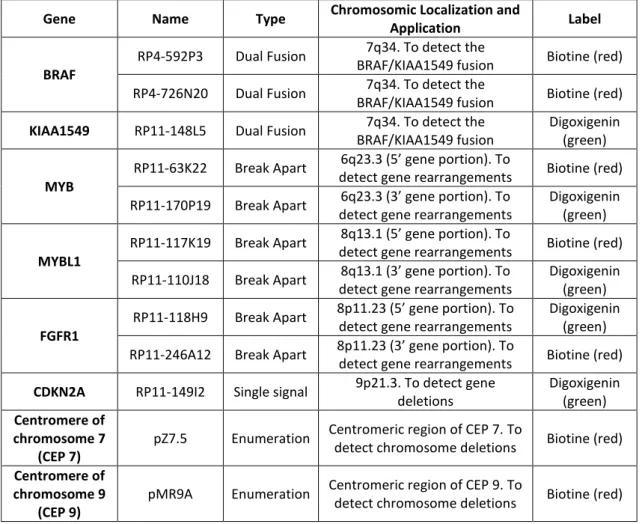
Table III.1 – Probes used for FISH and their characteristics. Descriptive table of the probes used in
FISH analysis. Each column represents a probe characteristic: name, type, localization and application, and the label used.
Gene Name Type Chromosomic Localization and
Application Label
BRAF
RP4-592P3 Dual Fusion 7q34. To detect the
BRAF/KIAA1549 fusion Biotine (red) RP4-726N20 Dual Fusion 7q34. To detect the
BRAF/KIAA1549 fusion Biotine (red)
KIAA1549 RP11-148L5 Dual Fusion 7q34. To detect the BRAF/KIAA1549 fusion
Digoxigenin (green)
MYB
RP11-63K22 Break Apart 6q23.3 (5’ gene portion). To
detect gene rearrangements Biotine (red) RP11-170P19 Break Apart 6q23.3 (3’ gene portion). To
detect gene rearrangements
Digoxigenin (green)
MYBL1
RP11-117K19 Break Apart 8q13.1 (5’ gene portion). To
detect gene rearrangements Biotine (red) RP11-110J18 Break Apart 8q13.1 (3’ gene portion). To
detect gene rearrangements
Digoxigenin (green)
FGFR1
RP11-118H9 Break Apart 8p11.23 (5’ gene portion). To detect gene rearrangements
Digoxigenin (green) RP11-246A12 Break Apart 8p11.23 (3’ gene portion). To
detect gene rearrangements Biotine (red)
CDKN2A RP11-149I2 Single signal 9p21.3. To detect gene deletions Digoxigenin (green) Centromere of chromosome 7 (CEP 7)
pZ7.5 Enumeration Centromeric region of CEP 7. To
detect chromosome deletions Biotine (red)
Centromere of chromosome 9
(CEP 9)
pMR9A Enumeration Centromeric region of CEP 9. To
19
2.2 - The FISH Methodology:
FISH techniques were performed in our series of cases as represented in Figure III.4.
2.2.1 - Nuclei Extraction from paraffin embedded material:
Nuclei extraction was done in paraffin embedded material (cuts of 50µm). This procedure consisted in a tissue de-paraffination, in which paraffin was dissolved at room temperature with three 10 min changes of xylene. Then, to digest the cytoplasm and set the nuclei free, paraffin sections were treated with protease (P8038-100MG, Sigma-Aldrich; 100µl protease/1ml Carlsberg solution) for 1 hour at 37°C. This enzymatic digestion was accompanied by a mechanical digestion and was stopped with ice cold (4°C) PBS. Free nuclei were then
Figure III.4 – Schematic representation of the FISH methodology. The FISH technique wasperformed in fresh tumor material, paraffin embedded tumor material (cuts of 50µm and sections of 4µm on glass slide). First it was necessary to obtain nuclei from paraffin embedded material (nuclei extraction) and from fresh material (imprint). Paraffin sections of 4µm on glass slide were ready to use. A glass slide de-paraffinization was done in the paraffin embedded material. Five steps were then performed: Pre-treatment of glass slides, heat denaturation of target DNA and probe, Post-hybridization washes, Probe detection, and FISH analysis.
20 submitted to a fixation process which consisted in the destruction of non-nuclear material by nuclei resuspension in a freshly prepared fixative (three parts methanol and one part glacial acetic acid). The resulting fixed nuclei suspension was spread on a glass slide (Appendix 1).
2.2.2 – Imprint preparation from fresh material
An imprint consists in touching the tumor fragment gently on a glass slide. After a 30min drying period at room temperature, glass slides were submitted to a hypotonic solution (NaCl 0.2%), which caused cellular membrane rupture and cellular lysis. Then, nuclei were submitted to a fixation process, to destroy non-nuclear material, by using a freshly prepared fixative (three parts methanol and one part glacial acetic acid).
2.2.3 – Glass slide de-paraffinization
This procedure was only done to glass slides from paraffin embedded material (10µm) and paraffin sections (4µm) in glass slide. It is an incubation in xylene and 100% ethanol for 30min each.
2.2.4 – Pre-treatments of glass slides
Pre-treatments of glass slides consisted in cell permeabilization with the purpose of making the target DNA (from the tumor) accessible for probe binding. This was accomplished with 2xSSC washes at different temperatures (5min at 37˚C, 30min at 75˚C, 3min at 37˚C) for imprints and nuclei from embedded paraffin material; with Juice (citrate buffer, 1x at 90°C for 17 min) for 4µm paraffin sections; and with enzymatic reactions, which digest the proteins that surround the nucleus: Proteinase K (P6556-100MG, Sigma-Aldrich) for nuclei from embedded paraffin material (10min) and Pepsin (P7000-100G, Sigma-Aldrich) for imprints and sections in glass slide (5-10min and 45min, respectively). Enzymatic reactions were stopped with ice cold (4˚C) PBS. At room temperature, glass slides were washed in PBS for 5 min and incubated in a Buffer Solution (5ml MgCl2 with 95ml PBS). Subsequently they were submitted to a Fixation
Solution (5ml MgCl2, 3,7ml of Formaldehyde and 91.3ml of PBS). Finally, glass slides were
dehydrated and air dried. (Appendix 1).
2.2.5 – Conjunction heat denaturation of target DNA and probe
The specific probe, diluted in hybridization solution, was added to the nuclei area in the glass slides and co-denatured with sample DNA: 5min at 90°C for nuclei from paraffin embedded material, 5min at 75°C for imprints, and 15min at 85°C for 4µm sections in glass slide. After denaturation, glass slides were stored for 16h at 37°C in a moist chamber for hybridization.
21
2.2.6 – Post-Hybridization Washes
Post-hybridization washes remove residual probe and unspecific bindings that interfere with the hybridization signal and are performed by first immerging glass slides for 15min, in a 50% of formamide solution at 42-43˚C and, then, in a 2xSSC solution with Tween 20 at 42-43˚C.
2.2.7 – Probe detection
The probes used in the present work were indirectly labelled. So, after post-hybridization washes, two incubation steps were performed: in the first incubation, TNB (Blocking Reagent, Roche) was used (10min at room temperature) to bind to nonspecific sequences and decrease background; the second incubation (30min at 37°C) was done with specific antibodies: Streptavidin conjugated with Cy3 fluorophore (Jackson ImmunoResearch
Laboratories) and anti-digoxigenin-fluorecein (Roche), for biotine and digoxigenin labeled
probes (respectively). To avoid unspecific bindings, antibodies were diluted in TNB in a proportion of 1:300 for streptavidin conjugated with Cy3 fluorophore and 1:100 for anti-digoxigenin-fluorecein. To remove residual antibodies, glass slides were washed twice in TNB buffer, with agitation. After being dehydrated, glass slides were air dried and mounted in VECTASHIELD® Mounting Medium with DAPI (4’,6-diamidino-2-phenylindole). DAPI is a nuclear counterstain, it is observed in the blue spectrum, thereby being detectable under a fluorescence microscope through a blue/cyan filter. Glass slides were stored in the dark at 4°C.
2.2.8 – FISH analysis
FISH analysis was performed under a fluorescence microscope linked to a CytoVision® software (Applied Imaging, UK). FISH analysis was performed by counting at least 100 cells per slide with intact, non-overlapping nuclei taken from different randomly chosen fields of view. The counted scores were expressed as percentage value, using a minimum cutoff level of 10% to define significant cell clone.
3 – Sequencing using Sanger Methodology:
DNA sequencing allows nucleotide sequence determination. This technique is based on Sanger’s methodology, where there is a selective incorporation of chain-terminating dideoxynucleotides (ddNTPs: modified dNTPs that lack a 3’-OH group, required for the formation of a phosphodiester bond between two nucleotides, causing DNA polymerase to cease extension of DNA when a modified ddNTP is incorporated) by DNA polymerase during in vitro DNA replication. Each ddNTP is labelled with a different color fluorophore to differentiate the four nitrogenous bases (adenine, guanine, cytosine and thymine) 41.