A Work Project, presented as part of the requirements for the Award of a Masters Degree in Economics from the Faculdade de Economia da Universidade Nova de Lisboa.
Does Fair Trade certification improve farmworkers’
welfare and empowerment?
Evidence from Nicaragua and Brazil
Stefania Sellitti
Student number: 820
A project carried out under the supervision of: Prof. Pedro Vicente
1
Does Fair Trade certification improve farmworkers’
welfare and empowerment?
Evidence from Nicaragua and Brazil
AbstractFairtrade (FT) is one of the most well-known Alternative Trade Organizations (ATOs). FT originally aimed to create empowerment among small producers and improve their livelihoods. In 2011, FT USA started certifying coffee estates, in order to include also farmworkers into a new certification scheme, known as Fair Trade for All (FT4ALL). Through the data collected by the Centre for tropical agriculture (CIAT) in Brazil and Nicaragua, we conducted an analysis to answer the following questions: (1) what is the causal effect of FT4ALL on workers’ welfare? and (2) is FT4ALL effective at empowering farm workers? We measured the average treatment effect of the certification through the implementation of the OLS model, propensity score matching (PSM) and difference-in-differences. Our results suggest that the certification has an overall positive impact on both welfare and empowerment.
.
Keywords: Fair Trade, Coffee certification, Farm workers, Welfare, Empowerment. 1. Introduction
The first attempts to find new trade and marketing channels to commercialize fair trade goods date back in the ‘40s. Since then, alternative trade organizations based on philosophies of social justice and environmental well-being have started expanding and are currently spreading all around the globe (Arnould, 2009). A contemporary example of this approach is Fair Trade (FT)1, which is an alternative approach to conventional trade that facilitates ethical trade between Southern producers and Northern consumers in order to facilitate poverty alleviation by developing new ways to coordinate production and commercialization (Raynolds, 2002; Fairtrade international, s.d.). The FT movement was originally created to foster small producers’ empowerment2 and well-being and up until 2011, had been organized into a single
1 Fair Trade refers to the movement as a whole, while Fairtrade is used to describe the certification and labelling system
governed by Fairtrade International. Fair Trade USA refers to the Fair Trade movement in the United States. FT4ALL represent the new certification scheme implemented by FT USA to certify estates.
2 Empowerment is the process of increasing the capacity of individuals or groups to make choices and to transform those choices into desired actions and outcomes. Central to this process are actions which both build individual and collective assets, and improve the efficiency and fairness of the organizational and institutional context that govern the use of these assets (The World Bank, s.d.)
2
global system (Raynolds, 2012a). In 2011 FT USA diverged from FT International, due to its desire to integrate also large producers and plantations in the FT system, through an extension of the original certification scheme, known as Fairtrade for All (FT4ALL). Differently to FT International, FT USA also encompasses coffee estates3, seeking to improve the livelihoods and labour conditions of the most vulnerable workers in the value chain. FT4ALL places emphasis on workers’ rights, such as the freedom of association and the collective bargain, prohibition of child labour, freedom from discrimination and women’s empowerment (Fair Trade USA, 2016; Fair Trade USA, 2014). FT4ALL wishes to be a solution to the fact that, that while FT coffee certification contributes to the higher prices and income received by producers, it benefits workers little or not at all (Dragusano et al., 2014a). For example, Valkila and Nygren (2010) found that while FT farmers were receiving higher prices for their coffee, workers did not benefit from the certification, neither through a salary increase nor through the provision of in kind payments. In this study we will analyse two big debates that are currently taking place over the Global North. Fist, some scholars casted doubt on the effectiveness of certification schemes, presenting some evidences that could undermine their worthiness and ability to increase farmers and farm workers’ living conditions. This leads to the question of whether certification is effective enough to warrant consumers paying higher prices and producers bearing certification costs. Second, FT International fears that an expansion of the certification could economically disadvantage small producers, as they might not be able to compete with high volume and low cost estate production. The existing literature on FT coffee has focused on the effect of FT on small coffee producers organized into cooperatives, rather than on farm workers. This paper aims to fill this lacuna in the literature by exploiting the pilot project started by FT USA to certify coffee estates in Nicaragua and Brazil. Indeed, FT4ALL is the first FT
3Coffee cooperatives are groups of small coffee producers who own and jointly control their certification, while also directly
benefiting from it. On the other hand, coffee estates are middle and large farms with one owner and many employed workers. The farm owner is the certificate holder, but the farm workers are the ones meant to benefit from it.
3
coffee certification addressed at estates. We examine two main questions: (1) what is the causal effect of FT4ALL on workers’ welfare? and (2) is FT4ALL effective at empowering farm workers? To answer these questions, this study applies a mixed-methods approach, which allows us to interpret our quantitative results in light of the qualitative data collected through semi-structured interviews and focus groups. In order to tackle all possible estimation bias and to ensure the robustness of our results, we conducted our quantitative analysis through the estimation of several distinct models: Ordinary Least Square (OLS), Propensity Score Matching (PSM) using Nearest-Neighbour with replacement, Kernel matching and radius caliper matching, Difference-in-Differences and Difference-in-Differences combined with PSM. As result variables, we built two multidimensional indices. This allows us to look at FT4ALL impacts from different perspectives: economic, to see if the model boosts incomes, increases assets and improves house quality; social, to assess the improvements in quality of life; empowerment, to determine workers’ inclusion in farm organizational life and relationships within the farm (CIAT, 2014). Both indices are built assuming that all variables and dimensions are equally weighted. The index of welfare is composed of 40 variables grouped into five dimensions: education, health, standard of living, food security and satisfaction with life. The index of empowerment includes 17 variables divided into seven groups: workers’ perception of their involvement in political life, quality of working environment, access to training, access to
financial services, number of working hours, type and duration of the contract and workers’ participation in organizational life.
Results show that the certification has a positive effect on both workers’ empowerment and welfare, both in Nicaragua and Brazil. The improvement in welfare is mainly due to increased access to education and healthcare services, as well as improvement of house quality. However, there is not a statistically significant increase in the level of non-productive assets, food security and per capita income. As for empowerment, most workers had become more involved in
4
organizational life and gained greater access to training, albeit we found a negative effect on working environment, most likely due to lack of communication about work-related problems between workers and the management board of the farm.
The structure of the remainder of the paper is organized as follows. Section 2 reviews the main results found in the literature. Section 3 provides information on the coffee market and on the research sites. Section 4 describes the program and standards implemented by FTUSA. Section 5 explains the identification strategy. Section 6 describes data collection and sampling strategy. Section 7 presents descriptive statistics and results and section 8 concludes.
2. Literature review
Many consumers in rich and emerging economies believe in the positive effects of food standards and certifications schemes and therefore are willing to pay higher prices for agricultural products that come with a certification which guarantees the sustainability of the production process. (Chiputwa, 2015). Indeed, consumers may derive utility not only from the good in in itself, but also from the way it is produced and from their belief to contribute to the improvement of producers and workers’ livelihoods (Dragusano et al., 2014a). On the other hand, some scholars are reluctant to believe that this system could be a feasible solution to world hunger or poverty and others state that the effects may be both positive and negative (Hansen, 2014). This literature review wants to present previous studies regarding the two main debates presented in this work. First, it shows the main findings about the effectiveness of coffee certifications, and specifically of FT, in increasing prices and improving farmers and farm workers’ living conditions and empowerment. Second, this literature review presents the existing evidence about the effects of certifications addressed to estates rather than to small producers. Bacon (2005) conducted a study in Nicaragua, which showed that FT certified farmers obtain higher prices. Dragusano and Nunn (2014b) explored a panel data of coffee producers between 1999 and 2000, finding that FT certification is associated with higher export
5
prices and increases income, but only for skilled coffee growers and farm owners. This is confirmed by a study conducted in Vietnam (Nguyen, 2015). Higher prices are almost obviously a result of FT minimum price and of the price premium4. Hence, it is more interesting to assess the effectiveness of certifications on other outcomes rather than price, bearing in mind that the effect on other outcomes might be strongly influenced by market prices, volume of coffee produced and demanded and costs of production. E. Méndez et al. (2010) provided a review of sustainable coffee certifications where they found that, even if all certifications provided higher prices per pound, the effect on workers’ livelihoods was marginal, since the volume of certified coffee sold was very low and farmers did not manage to sell all of their product at the certified price. Indeed, Valkila and Nygren (2010) demonstrated that FT minimum prices are not a guaranteed poverty alleviation mechanism and rise in income for famers as they manage to sell only between 30 and 60% of their production through the certification. Jena et al. (2015) conducted a study in Nicaragua, showing that even if FT farmers have experienced yield gains, the overall effect on the total household income was not statistically significant. Jena et al. (2012) investigated the problem of productivity and found that participation in coffee certifications has a low impact on producers’ livelihoods because of low productivity, insignificant price premiums and poor access to credit and information from the cooperative. Finally, Reardon et al. (2009) investigated the problem of costs and conducted an analysis of the agrifood industry transformation, highlighting that producers have to bear very high costs to obtain a food certification in order to comply with certain requirements and security standards. As a result, the poorest producers might not be able to satisfy the prerequisites of quality, consistency, volume of coffee, etc. and risk selling in less profitable market, and therefore become further marginalized (Reardon, 2009).
6
Better results were found when analysing the impact of certifications on producers and workers’ empowerment. According to the analysis conducted by E. J. Arnould et al. (2009), participation in FT cooperatives reduces the dropout rate from school and has a positive impact on health, as participants receive more medical treatments (Valkila, 2010; Arnould, 2009). Mendez et al. (2010) proved that Fairtrade has been effective at building capacity and networking possibilities for farmers.
In this part we present the existing literature on certifications addressed to estates and big plantations rather than to cooperatives. This point is essential to understand whether it is worth it to take the risk of enlarging the access to the FT market. Indeed, while an extension of the certification might be a valuable tool to improve directly farm workers’ condition, it might also represent the death knell of FT in the long run (De Janvry et al., 2012). In fact, as more producers become FT certified holding constant the total demand for Fair Trade, the output sold by each FT producer would decline and entry would continue until the expected benefits of FT certification just equals the cost to producers (Dragusanu et al., 2014a). There is not yet evidence of the impact of coffee certifications on living conditions of workers from large coffee plantations. However, Fairtrade edited several impact reports that analyze certifications in large banana, tea and flower plantations. They show that these certifications can have a positive impact on farm workers’ empowerment, as they feel a higher level of self-esteem and are more participative on the farm (Fair Trade USA, 2014b; Fair Trade USA, 2014a; Fair Trade USA, 2014). Raynolds (2012b) highlights the fact that estate certifications can build workers’ collective capacity through the establishment of FT committees, which is noteworthy especially where unions are absent. On the other hand, there is also evidence that these certifications might have some drawbacks, as it is hard to challenge the hierarchy of estates that hinder workers’ empowerment (Makita, 2012; Lyall, 2014) and to support democratically organized workers’ unions (Besky, 2008).
7 3. Context
This study took place in Nicaragua and Brazil, both countries in which coffee represents one of the most important crops in terms of level of exports and number of people employed in the sector. Indeed, coffee is the fourth most exported product in Nicaragua and the seventh in Brazil, which is in turn the largest coffee producer and exporter in the world, accounting for 18.1% of world exports for this product. Nicaragua’s exports represent 1.3% of the total coffee exported in the world (International Trade Center, 2015). As for employment, between 20% and 40% of the rural labour force in Nicaragua is employed in coffee production, while in Brazil the percentage is about 5.8%.
From 2012 until now, global coffee production decreased, while coffee consumption increased, causing a deficit in the market filled by means of coffee stocks. Following this trend, Brazil and Nicaragua both saw a decrease in their production, which increased again during the last crop year, 2015-2016, when the two countries produced respectively 48.423.000 and 2.100.000 bags of coffee5 (ICO, 2016). As for the FT coffee market, the most recent data on FT coffee production refer to the year 2014 and recorded that FT coffee production increased by 16% compared to 2013, reaching 9.150.000 bags, of which 2.513.333 were sold under FT name, 6% more than in the previous year6. Brazil and Nicaragua are two of the ten most important producers of FT coffee, and in 2014 had a capacity of 5.416.667 and 1.411.667 bags of coffee respectively (Fairtrade International, 2015). Even though FT production and selling increased, volatile international prices continued to challenge all coffee producers in the world, also impacting supply and demand of FT coffee and harming FT effectiveness. Indeed, in 2013 prices decreased sharply and after a recover during 2014, they decreased again in 2015, driving upwards the demand for coffee.
5 One bag contains 60 kg of coffee.
8 4. Program
FT4ALL is an extension of FT certification generated and implemented independently by FT USA. The two certifications have similar missions and utilize similar instruments to reach them. In the wake of diverging from Fairtrade International, FTUSA created a new set of standards that were addressed to coffee estates and not coffee cooperatives, in order to include the empowerment and welfare of farm workers into the certification scheme. As FT International does, FTUSA also utilizes a monetary premium7, which can be invested on farm or community projects, based on a need assessment done by FT assembly and committee. The main difference with the original FT is that the committee is composed of farm workers representatives elected democratically by all workers (FTUSA, 2016) and the premium is specifically used to benefit workers. The treatment farm in Nicaragua obtained the premium from the sale of two FT certified coffee containers in 2014, which were used to buy seeds and materials for the farm, improve farmworkers’ housing, offer loans to workers and provide educational programs. In Brazil the premium was used to expand a day care centre, provide computer courses to workers, purchase backpacks for workers, purchase equipment for a hospital and provide some workers with basic grocery packages. FTUSA standards also include the necessity of training farm workers and informing them about their rights in terms of salary and working hours. FTUSA standards also prohibit child labour, guarantee a stronger system of contracting and prohibit corporal, mental or physical punishment to workers. Moreover, FTUSA hopes to contribute to workers’ economic development, including in its standards the obligation to pay a salary that meets legal requirements and is at least equal to the minimum wage paid inside the country for similar occupations.
This study aims at evaluating whether FTUSA reached its goals of farm workers’
empowerment, economic development and social responsibilities.
9 4.1.Research sites
The treatment farm in Nicaragua is a family-owned coffee estate located in the department of Matagalpa. It has a total farm area of 192 hectares, of which 162 are designed for coffee cultivation and the remaining used for biodiversity conservation. The farm does not own any other certifications and coffee collection is conducted fully manually. The farm produces approximately 15.000 coffee bags each year and has sold four FT certified containers between 2014 and 2015, but did not sell any FT certified coffee in the last crop year.
The certified estate in Brazil is located in the department of Minas Gerais. It is much larger than the one in Nicaragua and made up of three farms, for a total area of 5.850 ha, of which 3.444 ha are used for coffee production. Unlike Nicaragua, the Brazilian certified estate was already part of three other certification schemes, namely UTZ, Rainforest and C.A.F.E. Practices8. This
estate has a much higher technological level than the one in Nicaragua and coffee collection is done mainly mechanically. Average annual production is of 63.278 bags and the estate received the premium for the sale of four containers of FT coffee since the beginning of the certification.. Control groups were selected based on their similarities to the treatment group with respect to coffee cultivation area, number of farm workers, distance of the farm from the market and production region in which they operate. In Nicaragua the control group is made up of four farms located in the departments of Jinotega and Matagalpa, three of which own other certifications and received a premium from them. The Brazilian control group consists of one estate, made up of 13 different farms located in the department of Minas Gerais, all selling under the name of other certifications and receiving a premium for them. Table B1 in appendix provides further details about treatment and control farms.
8 In our work we were not able to control for presence of other certifications. However, the mentioned certifications focus
10 5. Identification strategy
5.1.Outcome
Following the methodology adopted by Kling et al. (2007), we created an index of empowerment and one of welfare to draw general conclusion about the effectiveness of FT4ALL. As already explained in the introduction to this paper, both indices are the result of the aggregation of a few summary indices, called dimensions, in turn made up of several components9. Each dimension is defined as the equally weighted average of the z-scores of its variables with the sign of each measure oriented10 (Kling, 2007). The z-score is calculated as the difference between the value of the variable and the mean of the control group and divided by the standard deviations of the control group. As a result, each dimension has a mean of zero and a standard deviation of one for the control group and we measured where the mean of the treatment group is in the distribution of the control group in terms of standard deviation unit. As explained in the introduction the index of welfare is composed of five dimensions. Education is measured through the proportion of kids in the households enrolled in school at the time of the interview and through the accessibility to education, which includes benefits to education provided by the farm and interviewees’ subjective perception of the ability to access education. Health is measured through variables regarding the accessibility to healthcare services, namely the distance from the closest healthcare centre, participants’ perception on their ability to
access healthcare and a question regarding whether participants had or did not have access to healthcare services. The dimension food security includes the results of the ELSCA - Latin American and Caribbean food security scale11. The dimension regarding life standards is
99 Variables were selected both taking into account the possible direct and indirect effects of the certification and through the
analysis of their variance, conducted through the factorial analysis of mixed data. We excluded all those variables with zero variance that were not adding much information to the index. Finally, missing values were handled through the method of
multiple imputation when the percentage of missing values was less than 8%. When missing values were more than 8%, the
variable was excluded from the index.
10All variables take positive value. Mean working hours and distance from the closest healthcare center take negative sign. 11 Pérez-Escamilla, R. et al. (2007).
11
measured as the average of per capita income, assets12 and land ownership. Finally the dimension satisfaction included questions regarding personal satisfaction with life and satisfaction with food provision (in Nicaragua) and with house quality (in Brazil).
In the index of empowerment, we included information regarding farmers’ integration in
political decisions at national, regional and community levels, as FT aims at empowering
farmworkers both inside and outside of the work context. It also contains one dimension for
working hours, measured as the average number of hours worked, and one for contracts,
measured as the percentage of farmworkers in the household owning a written contract. We measured the quality of the working environment through three subjective questions about the possibility of changing job position, the ease of discussing work related issues and the stability of the job position. We also included a training dimension, measured as the average number of hours of training received by farmworkers in the household and by participants’ perception of their ability to access training. Furthermore, we evaluated the level of organization of workers, measuring the percentage of farmworkers in the household who belong to an organization. Finally, we measure the dimension financial services through the percentage of credit obtained and the possibility for a member of the family to access savings in the year preceding the interview.
5.2.Evaluation methods
We evaluated the certification through different methods. First, we implemented the Ordinary
Least Squares (OLS), which implied the regression of a treatment dummy variable on the
outcome of interest. Second, we implemented quasi-experimental methods to account for potential selection bias in participation and calculated the average treatment effect of FT4ALL. In both Nicaragua and Brazil we applied the propensity score matching, a method that involves pairing treatment and comparison units that are similar in terms of their observable
12 In Nicaragua assets include non-productive assets, house quality, animals for production and transports, while in Brazil
12
characteristics13 that are unaffected by the program (Dehejia, 2002), with respect to the conditional independence assumption. The first step is to construct a statistical counterfactual
by modelling the probability of participating in the program, or propensity score, on the basis of observed characteristics (Khandker, 2010), through the implementation of a logit model. To choose the variables14 necessary to the calculation of the propensity score, we implemented a combination of two different approaches: Leave-One-Out Cross validation and statistical
forward (Caliendo, 2008). To match control and treatment units and calculate the average treatment effect on the treated, we used an approach known as Kernel matching, which uses a
weighted average of all non-treated units that are in the region of common support to construct the counterfactual match for each participant. To give robustness to our results, we applied two more methodologies: Nearest-Neighbour and Radius caliper matching. The second step of this method implies the regression of the propensity score on the outcome variables.
(1) 𝐹𝑖𝑟𝑠𝑡 𝑠𝑡𝑎𝑔𝑒: 𝑃𝑟̂(𝑇 = 1) = 𝛼 + 𝛽0+ 𝛽1𝑥1+ ⋯ + 𝑏𝑘𝑥𝑘 (2)𝑆𝑒𝑐𝑜𝑛𝑑 𝑠𝑡𝑎𝑔𝑒: 𝐴TT E ( )| 1[E[Y |P(X),T 1]E[Y |P(X),T 0]] C T T X P PSM
For the case of Nicaragua, we exploited the availability of panel data and implemented also the method of difference in differences, used to compare treatment and control units before and after the certification. This method has the advantage of controlling for unobserved heterogeneity and is based on the parallel trend assumption15 (Khandker, 2010). The estimating equation can be specified as follows:
(3)𝑌𝑖𝑡 = 𝛼 + 𝛽𝑇𝑖1𝑡 + 𝜌𝑇𝑖1+ 𝛾𝑡 + 𝜀𝑖𝑡,
13 Indeed, based on the unconfoundness or conditional independence assumption, the participation into the program in only
based on observed characteristics (Rosenbaum, 1983).
14 We included both household and workers’ characteristics. In both Brazil an Nicaragua we included as households’
characteristics household size, literacy ratio, dependency ratio, proportion of female, proportion of family members employed and a dummy to check whether someone in the family works in other farms. For workers we included average age of workers of the household, mean working years, mean years of education, proportion of permanent workers. In Brazil we also added three dummy variables to assess whether there are family members working in the studied farm involved in field work, in administrative, or in general services and assistance to health and security. In Nicaragua we also included the logarithm of the distance from the farm.
13
where T is a treatment dummy, t is a year dummy, which takes the value of 1 for the end line year and 0 for the baseline, and 𝛽 gives the average difference in differences effect of the program. Finally, this study combines the diff-in-diff method with PSM.
6. Data collection and sampling design
As stated in section 1, CIAT employed a longitudinal mixed-methods evaluation research approach. Data collection included activities at three different analytical levels. At the micro
level, we conducted surveys in both countries among farmworkers belonging to two different
groups, a treatment and a control. At the meso-level, we used semi-structured interviews with farm owners, organized focus groups with farmworkers and owners and conducted interviews with workers, management and community representatives in treatment farms. Finally, we conducted a secondary analysis of coffee production, volume, sales and prices, in order to conduct an analysis at the macro level.
CIAT’s research project started in 2013 with the collection of baseline data starting in 2014, right before the certification program started. End line collection was done between October and December 2015 in Brazil and between February and April 2016 in Nicaragua. No baseline surveys were conducted in Brazil, as the treatment estate had already started the certification in 2012. Workers’ surveys were designed on FT standards and objectives and included both quantitative and qualitative questions about household characteristics, food security, knowledge of FTUSA, participation in social groups, economic situation, type of contract received from the farm, access to training and work environment, among others.
The technique applied to select the number of people to interview was the stratified random
sampling that involved the division of the population into two strata, temporary and permanent workers. Through this method, it was decided that for Brazil 400 workers should be interviewed
in the treatment group and 200 in the control group. After having decided the necessary number of interviews, farmworkers were selected randomly from a list, the farm census of workers. For
14
Nicaragua they conducted 550 surveys in the baseline, which consisted of 199 from the treatment group and 351 from the control, and 508 in the end line,16 323 of the control group and 185 of the treatment.
7. Econometric results 7.1.Descriptive data
In Table B2 in appendix, we reported the descriptive characteristics of the treatment and control groups and their comparisons, to see whether control and treatment groups were similar in characteristics. To compare means of households’ and workers’ characteristics, we conducted
t-tests for parametric variables and the Mann-Whitney-Wilcoxon test for non-parametric
variables (Wilcoxon, 1945; Mann, 1947). To decide which test was the most appropriate, we first applied the Shapiro-Wilk test to check for normality of the distribution, along with Leven’s test to assess the homogeneity of variance of variables. Treatment and control groups were compared in both countries; in the case of Nicaragua a comparison between households’ characteristics in 2014 and in 2016 was also conducted. Results from Nicaragua reveal that there was a statistically significant difference in household size, maximum years of education of family members and in the proportion of family members employed in 2014, while samples were equal in terms of proportion of women in the household, dependency ratio and number of farmworkers. Prior to the beginning of the program, treatments and controls differed in many economic characteristics, except for the income from farm activities and the probability of being under the poverty line. Differences in economic characteristics between 2014 and 2016 were all statistically significant.
In Brazil treatment and control groups differ in the maximum number of years of education in the household and in the number of farmworkers. There are also statistically significant
16 Because of a problem of attrition the sample interviewed in the baseline does not fully correspond the one of the end line.
We estimated a level of 53% of attrition in the treatment group and respectively 65%, 61%, 58% and 75% in the 4 control groups. Table F1 and F2 in appendix provide a description of the problem of attrition and of how the replacement was done.
15
differences in the probability of being under the poverty line, in land ownership and in the percentage of income from non-agricultural resources.
In the following two parts, we will analyse the results of the quantitative analysis, in light of the qualitative information obtained at the meso level, for both Nicaragua and Brazil.
7.2.Nicaragua
Table A1 below reports the results of the regressions on the overall indices of welfare and empowerment in Nicaragua, along with the effects on the different dimensions. We also measured the effect on the different components, as the magnitudes of the separate outcomes would be easier to interpret compared to those of the summary indices (Kling, 2007). We will comment on these results, even if they are not all reported in the table, in order to understand what has the most influence on the overall outcome. Columns (i) and (ii) show the results of the OLS regression of the treatment on the outcome, first without covariates and then with the inclusion of covariates for households’ and farmworkers’ characteristics. Columns (iii) and (iv) report the results of the propensity score matching, measured in turn with Kernel and Radius caliper matching (Caliendo, 2008).17 To check that the balancing property is satisfied, we conducted a t-test to control for differences in means between treatment and control units not being statistically significant after matching. Results of the tests revealed that matched treatment and control units have similar characteristics. The success of the matching was confirmed by the reduction of the standardized bias18. Column (v) reports the gamma of the
Rosenbaum bounds test19, which reveals how sensitive the estimated treatment effect is to unobserved components (Di Prete, 2004). Columns (vi), (vii) and (viii) show the effects calculated through difference in differences method. In the first case, the model was estimated
17 Control and treatment units were matched based on some observable characteristics of households and farm workers, namely
household size, proportion of female workers in the household, proportion of permanent workers in the household, mean level of education of workers, mean numbers of years worked in the farm, literacy and dependency ratios, farm workers’ age, distance from the farm and whether someone in the family worked in another farm.
18 It is defined as the difference of sample means in the treatment and matched control subsamples as a percentage of the square
root of the average of sample variances in both groups. Results are reported in appendix.
16
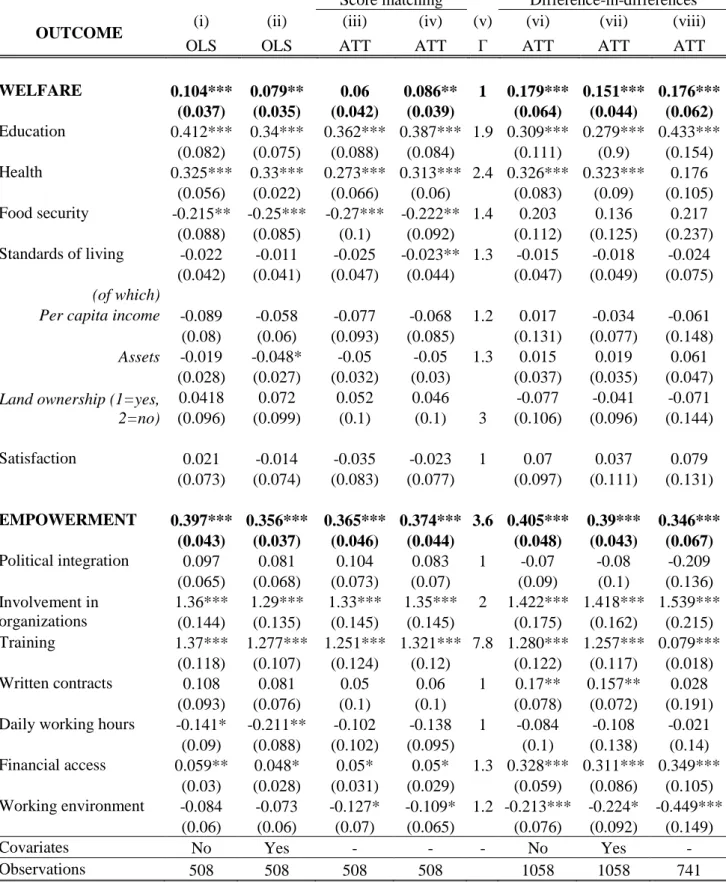
without the inclusion of covariates, while in the second case household and workers’ characteristics were added. The last column shows the results of the diff-in-diff with PSM. As shown in the table, the overall effect of the certification on the welfare of farm workers’ households is positive and statistically significant. Depending on the matching method used, the magnitude of the effect measured with PSM varies between 0.06 and 0.086, which can be interpreted as the distance from the control mean. Moreover, results of the difference in differences method reveal that the welfare of the treatment group compared to the control increased in a statistically significant way from the baseline to the end line year. Of the five dimensions, the two that have the highest positive influence on the result are education and
health. What had the greatest influence on the dimension education is the provision of subsidies
to education, which were more than two times higher in the treatment group as compared to the control group. Effects on health are highly statistically significant with almost all methodologies, as treatment had a positive and statistically significant effect on each component of the dimension. The average treatment effect on food security is negative and statistically significant when measured with PSM. However, results of diff-in-diff reveal that the negative difference between groups decreased with time, even if the difference is not statistically significant. The effect of FT4ALL on life standards is negative and not statistically significant. The different components of the dimension tend to go in different directions. The results of PSM reveal that the effect on per capita income was negative but not statistically significant. Also the effect on assets was negative, due to a negative difference in the number of people owning certain non-productive assets or means of transport, such as bikes, irons and mixers. On the other hand, the effect on quality of the house is positive and statistically significant, due to the increased number of households accessing piped water, electricity and gas fuel. Finally, the effect on the dimension satisfaction was negative but not statistically significant.
17
Table A1: Nicaragua - Results
Score matching Difference-in-differences
OUTCOME (i) (ii) (iii) (iv) (v) (vi) (vii) (viii)
OLS OLS ATT ATT Γ ATT ATT ATT
WELFARE 0.104*** 0.079** 0.06 0.086** 1 0.179*** 0.151*** 0.176*** (0.037) (0.035) (0.042) (0.039) (0.064) (0.044) (0.062) Education 0.412*** 0.34*** 0.362*** 0.387*** 1.9 0.309*** 0.279*** 0.433*** (0.082) (0.075) (0.088) (0.084) (0.111) (0.9) (0.154) Health 0.325*** 0.33*** 0.273*** 0.313*** 2.4 0.326*** 0.323*** 0.176 (0.056) (0.022) (0.066) (0.06) (0.083) (0.09) (0.105) Food security -0.215** -0.25*** -0.27*** -0.222** 1.4 0.203 0.136 0.217 (0.088) (0.085) (0.1) (0.092) (0.112) (0.125) (0.237) Standards of living -0.022 -0.011 -0.025 -0.023** 1.3 -0.015 -0.018 -0.024 (0.042) (0.041) (0.047) (0.044) (0.047) (0.049) (0.075) (of which)
Per capita income -0.089 -0.058 -0.077 -0.068 1.2 0.017 -0.034 -0.061 (0.08) (0.06) (0.093) (0.085) (0.131) (0.077) (0.148)
Assets -0.019 -0.048* -0.05 -0.05 1.3 0.015 0.019 0.061 (0.028) (0.027) (0.032) (0.03) (0.037) (0.035) (0.047)
Land ownership (1=yes, 2=no) 0.0418 0.072 0.052 0.046 -0.077 -0.041 -0.071 (0.096) (0.099) (0.1) (0.1) 3 (0.106) (0.096) (0.144) Satisfaction 0.021 -0.014 -0.035 -0.023 1 0.07 0.037 0.079 (0.073) (0.074) (0.083) (0.077) (0.097) (0.111) (0.131) EMPOWERMENT 0.397*** 0.356*** 0.365*** 0.374*** 3.6 0.405*** 0.39*** 0.346*** (0.043) (0.037) (0.046) (0.044) (0.048) (0.043) (0.067) Political integration 0.097 0.081 0.104 0.083 1 -0.07 -0.08 -0.209 (0.065) (0.068) (0.073) (0.07) (0.09) (0.1) (0.136) Involvement in organizations 1.36*** 1.29*** 1.33*** 1.35*** 2 1.422*** 1.418*** 1.539*** (0.144) (0.135) (0.145) (0.145) (0.175) (0.162) (0.215) Training 1.37*** 1.277*** 1.251*** 1.321*** 7.8 1.280*** 1.257*** 0.079*** (0.118) (0.107) (0.124) (0.12) (0.122) (0.117) (0.018) Written contracts 0.108 0.081 0.05 0.06 1 0.17** 0.157** 0.028 (0.093) (0.076) (0.1) (0.1) (0.078) (0.072) (0.191)
Daily working hours -0.141* -0.211** -0.102 -0.138 1 -0.084 -0.108 -0.021
(0.09) (0.088) (0.102) (0.095) (0.1) (0.138) (0.14)
Financial access 0.059** 0.048* 0.05* 0.05* 1.3 0.328*** 0.311*** 0.349*** (0.03) (0.028) (0.031) (0.029) (0.059) (0.086) (0.105) Working environment -0.084 -0.073 -0.127* -0.109* 1.2 -0.213*** -0.224* -0.449***
(0.06) (0.06) (0.07) (0.065) (0.076) (0.092) (0.149)
Covariates No Yes - - - No Yes -
Observations 508 508 508 508 1058 1058 741
***, **, *: statistically significant at respectively 1%, 5% or 10% significance level. Standard errors in parenthesis.
Each cell reports a different estimation of the treatment effect. (i) And (ii) report the results of the OLS estimation, the first without covariates and the second with the introduction of household and workers characteristics. (iii) And (iv) report the average treatment effect on the treated estimated through the PSM method. (iii) Shows the results of Kernel matching and (iv) of radius caliper matching (caliper=0.6). Column (v) and (vi) report the results of the difference-in-differences method, the first without covariates and the second with the introduction households and workers characteristics. Column (viii) shows the ATE calculated through the diff-in-diff with PSM Column (v) reports the 𝛾 obtained through the sensitivity analysis of Rosenbaum bounds. The main outcomes are two multidimensional indices: welfare and empowerment. See also footnotes 10 and 12 and not to table A2.
18
The second part of table A1 shows the effects of FT4ALL on farmworkers’ empowerment. The effect on empowerment is positive and strongly statistically significant. The table shows that the dimensions training and workers’ organization provide the largest contribution to the positive value of the index of empowerment. Indeed, certified farmers received more than the double the number of hours of training compared to the control group and found training easier to access. The results of PSM are confirmed by the diff-in-diff method. Moreover, treated farmers resulted in being greater than two times more involved in organizations and this is almost fully explained by the presence of FT organizations on farm. There was also a positive and slightly significant increase in the participation in women’s groups, which is a positive sign in terms of women’s empowerment. Results on the dimension financial access were also positive and this might be a reflection of the investment of the premium in credit to workers. Results on the other dimensions were not as positive. Indeed, they showed an increase in mean working hours, even if it is not statistically significant. This is in line with what farm workers declared, stating that work performance pressure and workload increased after the certification started, in order to raise coffee quality and thus the sales of certified coffee. The effects on
working environment are negative and statistically significant, especially due to a negative
effect on the component communication (possibility to discuss work-related issues). This is probably due to the increased pressure that workers receive from the farm owners, who aim at increasing the quality of FT coffee in order to increase its demand and the received premium. As a result, many participants might not feel work stability and fear retaliation for voicing their rights.
7.3.Brazil20
We evaluated the effects of the certification in Brazil uniquely with the methods of OLS and PSM. We calculated the propensity scores including the same observable characteristics used
20 Outcome variables for Brazil are built in the same way as in Nicaragua. However, there are some differences in the variables
19
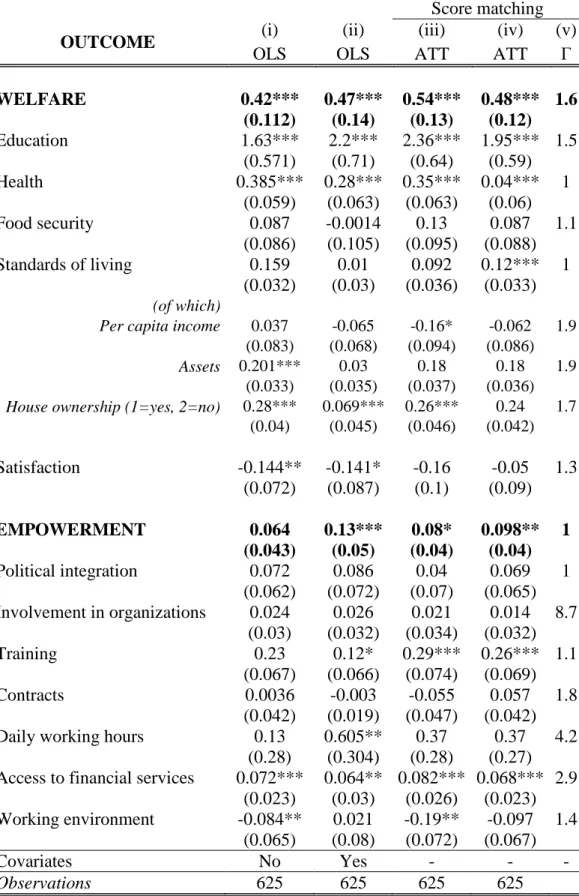
for Nicaragua, with the addition of three dummies for the type of work conducted by household members working in the study farm. This information is relevant in Brazil, as salaries are differentiated on the basis of the kind of work and contracts are standardized. As in the case of Nicaragua, matching quality was tested through a test of differences in means before and after matching and of the standardised bias, whose result revealed that the matching was successful. Results of OLS regressions and average treatment effects are reported in table A2, which was built following the same structure as table A1 for Nicaragua. Results of PSM reveal a positive and statistically significant effect of the certification both on participants’ welfare and on empowerment, even if the effect on the latter is much smaller in Brazil than in Nicaragua, most likely due to farm size. The positive effect on welfare is driven by the positive and statistically significant effect on education and health, as access to education and health increased, mostly due to the provision of benefits from the farm. The effect is positive also on the dimension food
security, even if it is not statistically significant. As for the dimension life standards, the effect
is positive and statistically significant, only if measured with radius matching, driven by an improvement of the asset index, caused in turn by increased house quality. Indeed the treatment group appears to have better access to piped water and toilets. On the other hand, the effects on per capita income are negative even if not statistically significant.21 Finally, the result in the dimension satisfaction with life is negative and statistically significant, especially because of participants’ dissatisfaction with their houses. This low level of satisfaction might also be driven by the fact that workers in Brazil do not see much future in agriculture and have actively prevented their children from following their footsteps as farm workers.
owning houses. Moreover, because of little variance, variables regarding productive assets were excluded from the evaluation. To evaluate house quality the variable electricity was not included, as everybody in the sample had access to this service, nor were variables related to the main material of the house, due to lack of data. Finally, because of data availability, different house facilities were included. In Brazil we included the ownership of a washing machine instead of the ownership of irons and mixers. The index of empowerment was equal to the one of Nicaragua in all components. The only difference was in the dimension contracts, which in Brazil was measured as the proportion of people in the household who have a long-term contract.
21 These results reflect the decision of the farm reviewing the collective work agreement and gradually reducing workers’
20
TABLE A2: Brazil – Results
Score matching
OUTCOME (i) (ii) (iii) (iv) (v)
OLS OLS ATT ATT Γ
WELFARE 0.42*** 0.47*** 0.54*** 0.48*** 1.6 (0.112) (0.14) (0.13) (0.12) Education 1.63*** 2.2*** 2.36*** 1.95*** 1.5 (0.571) (0.71) (0.64) (0.59) Health 0.385*** 0.28*** 0.35*** 0.04*** 1 (0.059) (0.063) (0.063) (0.06) Food security 0.087 -0.0014 0.13 0.087 1.1 (0.086) (0.105) (0.095) (0.088) Standards of living 0.159 0.01 0.092 0.12*** 1 (0.032) (0.03) (0.036) (0.033) (of which)
Per capita income 0.037 -0.065 -0.16* -0.062 1.9 (0.083) (0.068) (0.094) (0.086)
Assets 0.201*** 0.03 0.18 0.18 1.9
(0.033) (0.035) (0.037) (0.036)
House ownership (1=yes, 2=no) 0.28*** 0.069*** 0.26*** 0.24 1.7 (0.04) (0.045) (0.046) (0.042) Satisfaction -0.144** -0.141* -0.16 -0.05 1.3 (0.072) (0.087) (0.1) (0.09) EMPOWERMENT 0.064 0.13*** 0.08* 0.098** 1 (0.043) (0.05) (0.04) (0.04) Political integration 0.072 0.086 0.04 0.069 1 (0.062) (0.072) (0.07) (0.065) Involvement in organizations 0.024 0.026 0.021 0.014 8.7 (0.03) (0.032) (0.034) (0.032) Training 0.23 0.12* 0.29*** 0.26*** 1.1 (0.067) (0.066) (0.074) (0.069) Contracts 0.0036 -0.003 -0.055 0.057 1.8 (0.042) (0.019) (0.047) (0.042)
Daily working hours 0.13 0.605** 0.37 0.37 4.2
(0.28) (0.304) (0.28) (0.27)
Access to financial services 0.072*** 0.064** 0.082*** 0.068*** 2.9
(0.023) (0.03) (0.026) (0.023)
Working environment -0.084** 0.021 -0.19** -0.097 1.4
(0.065) (0.08) (0.072) (0.067)
Covariates No Yes - - -
Observations 625 625 625 625
***, **, *: statistically significant at respectively 1%, 5% or 10% significance level. Standard errors in parenthesis.
The table reports the coefficients on the treatment dummy (1=certified, 0=not certified) when regressed on the indices of welfare and empowerment and on their dimensions. Welfare is composed of five dimensions: health, education, food security, living standards and satisfaction level. All variables are standardized and transformed into z-score using the means and standard deviations of the control group. All components of each dimensions were aggregated through a simple average, assuming that all dimensions have equal weight. Variables were chosen based on the existing literature on multidimensional indexes and on FT and on their variance. Column (i) and (ii) report the results of the OLS estimation, the first without controls and the second with the addiction of households and workers’ characteristics. Column (iii) and (iv) report the average treatment effect on the treated, calculated through the score-matching method. In column (v) the 𝛾 of the Rosenbaum bounds test were reported. See also footnotes 10 and 12
21
As in the case of Nicaragua, workers’ training and financial access are the main drivers of the positive effect on empowerment, showing that the treatment farm complies with FT standards. The number of hours of training received is higher in the treatment group, along with workers’ perception of their ability to access training. The effect on the dimension financial services is positive and statistically significant, due to increased access to both credit and savings. Contrary to Nicaragua, participation to organizational life is not statistically significant, as workers’ participation in decision-making processes is mainly restricted to union negotiations and to the investment of the Fair Trade Premium and the majority is not involved in any other kind of organization other than FT. Similarly to Nicaragua, the certification has a negative and statistically significant effect in the dimension working environment. Indeed, workers feel they do not have a high degree of freedom in expressing their opinions and complains about job related issues and do not feel work stability. Many participants stated that they do not approach management or direct supervisors to complain about work issues, even if they expressed a willingness to voice their opinions when needed, out of fear of losing their job. In all other dimensions the effect of the certification is not statistically significant. However, it is noteworthy to show that workers from the treatment group feel more involved than the control group in politics, both at community and regional levels, even if the difference is not statistically significant.
7.4. Interpretation
The most important contribution of this study to the ongoing debates on certifications’ effectiveness and on FT4ALL pros and cons is its multilevel approach, which allows one to read the results in light of the coffee market situation and the qualitative analysis conducted at the meso level. Lack of a wide dataset regarding FT sales, prevents us from deriving conclusions on whether certifying estates could marginalize coffee producers organized into cooperatives, which have always been FT priority. However, from these results one might
22
understand whether the certification has a positive impact on workers’ livelihood and empowerment, making it valuable to divide the FT coffee market between cooperatives and estates. The results presented above show an overall positive effect of the certification on participants’ welfare and empowerment in both Nicaragua and Brazil. Welfare positive effects were recorded especially in those areas where the premium was invested, such as education, healthcare and house quality, showing that the investment of the premium is a good instrument to increase workers’ welfare. However, the analysis at the meso level revealed that, while Nicaraguan workers found the certification and the premium useful tools to improve their livelihoods, Brazilian workers opined that the premium should be used more directly to give financial assistance to workers or to increase the wage. Indeed, from our study we found that per capita income is lower in the control group than in the treatment group in both Nicaragua and Brazil.
The results on welfare need to be interpreted carefully for several reasons. First, it is hard to assess how much of these improvements can be addressed to FT4ALL, especially in the case of Brazil, where both treatment and control farms own other certifications. Second, the treatment farm in Brazil sold too little a quantity of FT certified coffee to make a considerable impact for a coffee estate with approximately 1200 workers, while the certified farm in Nicaragua did not sell any FT coffee in 2015/2016.
Results for empowerment also need to be analysed in light of the meso findings. As shown above, the positive effects were mostly driven by workers’ participation in organizational life and training. However, it is important to highlight that through the meso analysis, we recorded that in both countries, workers participated only in FT assemblies and decisions on how to invest the premium, but are neither part of the labour unions and syndicates, nor have much contact or dialogue with the farm management board. Moreover, most workers appreciated the received training but also expressed the interest in receiving capacity enhancement trainings
23
that are more readily transferable to other situations and job positions. The meso analysis also revealed that while all Nicaraguan farmworkers had knowledge of FT, many Brazilian interviewees did not know about the FT certification and the ones who had heard of it, could not articulate its purpose aside from acknowledging that it is one of the many certifications that the farm currently possesses.
It is also essential to keep in mind what we demonstrated in the context section. Indeed, FT4ALL is a certification strongly influenced by market prices and fluctuations. As a result, when market prices decrease, consumers might be less likely to purchase FT coffee, which is sold at a higher price, and this could be one of the reasons why the treatment farm in Nicaragua did not manage to sell any FT certified coffee in 2015/2016, when market prices were very low. Moreover, estates, especially the ones with more than one certification, could decide to sell to the buyer offering the highest price, disregarding whether or not that buyer is interested in FT certified or non-certified coffee. The fact that FT is included in a market means that this certification might have some negative side effects, which are visible in our results. Indeed, in order to have higher benefits from the certification, producers should try to sell more coffee under the FT certification. The improvement of the quality required causes increased pressure and workload on workers and therefore decreases the quality of the working environment.
8. Concluding remarks
This work fits in the ongoing debate on the effectiveness of food standards and certification schemes. Its analysis of the certification FT4ALL amplifies the existing literature on FT, which has focused until now on FT effects on small producers rather than on workers. The quantitative analysis conducted reveals that the new certification has a positive and statistically significant effect on workers’ welfare and empowerment. However, when these results are read in light of the coffee market context, one could be reluctant to believe that certifying estates holds actual value. Indeed, as Mendez (2010) has shown the quantity of FT coffee sold strongly depends on
24
coffee market prices; hence, the certification having only a slight impact might be from too little a percentage of coffee being sold under the certification.
In terms of empowerment, the certification seems to be helpful, as it encourages workers to organize themselves and participate in the farm organizational life. Yet, most workers seem to be uniquely involved in FT activities and decisions on how to invest the premium and do not participate in labour unions or syndicates. However, the meso analysis revealed that FT workers are more aware of their rights and abilities, even if they still lack direct communication with the management board, mostly due to fear or cultural reasons.
The situation presented above suggests that FT4ALL certification might be more effective in smaller farms than in very large estates, as smaller farms can more directly invest in workers’ needs and are less likely to own other certifications. Moreover, the small quantity of coffee sold with FT may have a larger impact on smaller estates than on larger estates. Finally, workers in smaller estates are more aware of FT.
These findings do not seem to negate the value of the new FT4ALL certification scheme, because it still holds positive impacts on workers’ welfare and empowerment. However, there is need for improvement of the certification, as standards could be adapted to farm sizes and technological levels and should me more effective at driving upwards workers income, thus salaries. On the other hand, given that the overall demand for FT coffee is lower than its supply, the inclusion of estates in the market could harm small producers, even if a definitive answer to these questions still requires a deeper analysis of the FT market and sales.
References
Arnould, E. J. (2009). Does fair trade deliver on its core value proposition? Effects on income,
educational attainment, and health in three countries. Journal of Public Policy & Marketing
28.2, 186-201.
Bacon, C. (2005). Confronting the coffee crisis: can fair trade, organic, and specialty coffees
reduce small-scale farmer vulnerability in northern Nicaragua? World development 33.3 , 497-511.
Besky, S. (2008). Can aplantation be fair? Paradoxes and Possibilities in Fair Trade Darjeeling
25
Caliendo, M. a. (2008). Some practical guidance for the implementation of propensity score
matching. Journal of economic surveys 22.1, 31-72.
Chiputwa, B., Spielman, D. J., & Qaim, M. (2015). Food standards, certification, and poverty among coffee farmers in Uganda. World Development, 66, 400-412.
CIAT (2014). Putting a premium on empowerment. Retrieved from: International Center for Tropical Agriculture: https://ciat.cgiar.org/wpcontent/uploads/2014/04/Putting_a_premium_o
n_empowerment.pdf
Dehejia, R. H. (2002). "Propensity score-matching methods for nonexperimental causal
studies.". Review of Economics and statistics 84.1, 151-161.
De Janvry, A., McIntosh, C., & Sadoulet, E. (2015). Fair Trade and Free Entry: Can a Disequilibrium Market Serve as a Development Tool?. Review of Economics and
Statistics, 97(3), 567-573.
Di Prete, T. G. (2004). Assessing Bias in the Estimation of Causal Effects: Rosenbaum Bounds
on Matching Estimators and Instrumental Variables Estimation. Discussion paper SP I
2004-101.
Dragusanu, R., (2014a). The economics of fair trade. The Journal of Economic Perspectives 28.3: 217-236.
Dragusanu, R., (2014b). The impacts of Fair Trade certification: Evidence from coffee
producers in Costa Rica. Harvard University .
Fair Trade USA. (2014). Impact Report Fair Trade Certified Tea. Retrieved from
http://fairtradeusa.org/sites/default/files/Tea_Impact_Report.pdf
Fair Trade USA. (2014a). Impact report Fair Trade Certified Bananas. Retrieved from
http://faitradeusa.org/sites/default/files/Bananas_Impact_Report.pdf
Fair Trade USA. (2014b). Impact Report Fair Trade Certified Flowers. Retrieved from:
http://fairtradeusa.org/sites/default/files/Flowers_Impact_Report.pdf
Fair Trade USA. (2016). Agricultural Production Standard. Retrieved from Fair Trade USA:
http://fairtradeusa.org/sites/default/files/wysiwyg/filemanager/APS_Forms_2016/FTUSA_ST ND_APS_EN_0.2.0.pdf
Fairtrade International. (2015). Scope and benefits of Fairtrade, 7th edition. Fairtrade
International.
Fairtrade international. (n.d.). Fairtrade international - About Fairtrade. Retrieved from:
http://www.fairtrade.net/about-fairtrade.html
Hansen, H. a. (2014). Food standards are good–for middle-class farmers. World Development 56, 226-242.
ICO - International Coffee Organization (2016, September). Trade Statistics Tables.
Retrieved from International Coffe Organization: http://www.ico.org/prices/po-production.pdf
International Trade Center. (2015). Trade Map - List of importing markets for the product
exported by Nicaragua and Brazil in 2015. Retrieved from: http://www.intracen.org/
Jena, P. R. (2012). The impact of coffee certification on small‐scale producers’ livelihoods: a case study from the Jimma Zone, Ethiopia. Agricultural economics 43.4 , 429-440.
Jena, P. R. (2015). Can coffee certification schemes increase incomes of smallholder farmers?
Evidence from Jinotega, Nicaragua. Environment, Development and Sustainability: 1-22.
Khandker, S. R. (2010). Handbook on impact evaluation: quantitative methods and practices.
World Bank Publications.
Kling, J. R. (2007). Experimental analysis of neighborhood effects. Econometrica 75.1,
83-119.
Lyall, A. (2014). Assessing the impacts of Fairtrade on worker-defined forms of empowerment on Ecuadorian flower plantations. Switzerland: Fairtrade International and Max
26
Makita, R. (2012). Fair Trade Certification: The Case of Tea Plantation Workers in India. . Development Policy Review, 30, 1, 87-107.
Mann, H. B. (1947). On a test of whether one of two random variables is stochastically larger
than the other. The annals of mathematical statistics, 50-60.
Mendez, V. E. (2010). Effects of Fair Trade and organic certifications on small-scale coffee
farmer households in Central America and Mexico. Renewable Agriculture and Food Systems, 236-251.
Nguyen, T. M.-H.-E. (2015). Impact of certification system on smallhold coffee farms’income
distribution in Vietnam. Asian Journal of Agriculture and Rural Development 5.6 , 137-149.
Pérez-Escamilla, R. (2007). Escala latinoamericana y caribeña de seguridad alimentaria
(ELCSA). Perspectivas en Nutrición Humana (pp. 117-34).
Raynolds, L. T. (2002). Consumer/producer links in fair trade coffee networks. Sociologia ruralis 42.4 , 404-424.
Raynolds, Laura T. (2012a). Fair trade: Social regulation in global food markets. Journal of Rural Studies 28.3, 276-287.
Raynolds, Laura T. (2012b). Fair Trade flowers: Global certification, environmental
sustainability, and labor standards. Rural Sociology 77.4, 493-519.
Reardon, T. e. (2009). Agrifood industry transformation and small farmers in developing
countries. World development 37.11 , 1717-1727.
Rosenbaum, P. R. (1983). The central role of the propensity score in observational studies for
causal effects. Biometrika 70.1, 41-55.
The World Bank. (s.d.). PovertyNet - What is empowerment? Tratto da The World Bank:
web.worldbank.org/WBSITE/EXTERNAL/TOPICS/EXTPOVERTY/EXTEMPOWERMENT
United Nations. (2015). Retrieved from United Nations. (2015). General Assembly (Vol. 15).:
http://www.un.org/ga/search/view_doc.asp?symbol=A/RES/70/1&Lang=E
Valkila, J., Nygren A. (2010). Impacts of Fair Trade certification on coffee farmers,
cooperatives, and laborers in Nicaragua. Agriculture and Human Values 27.3, 321-333.
Welch, B. L. (1938). The significance of the difference between two means when the
population variances are unequal. Biometrika 29.3/4, 350-362.
Wilcoxon, F. (1945). "Individual comparisons by ranking methods." . Biometrics bulletin 1.6 ,