Elsevier Editorial System(tm) for Membrane Science Manuscript Draft
Manuscript Number: JMS-14-1420R2
Title: Characterisation and modelling of transient transport through dense membranes using on-line mass spectrometry
Article Type: Full Length Article
Keywords: transient diffusion, time-dependent diffusion coefficients, mass spectrometry, pervaporation, on-line monitoring
Corresponding Author: Dr. Carla Brazinha, Ph.D.
Corresponding Author's Institution: REQUIMTE / CQFB, FCT, Universidade Nova de Lisboa First Author: Sofia Castro Fraga, MSc
Order of Authors: Sofia Castro Fraga, MSc; L. Trabucho, Ph.D.; Carla Brazinha, Ph.D.; João Goulão Crespo, Ph.D.
Abstract: This work presents a methodology for characterising solute transport through pervaporation membranes or, more generally, through dense membranes, in the whole transient regime. A real-time characterisation of transport through dense membrane is obtained by using on-line mass spectrometry (MS) monitoring, which allows to acquire the concentration of solutes in the permeate compartment with time intervals of 2 seconds (and lower if required). Time-dependent diffusion coefficients, D(t), were calculated for the whole operation period, including the initial transient period. Based on these values it is possible to infer about the relevance of solute-membrane interactions and rearrangement of the membrane structure due to the presence of permeant solutes. Finally, based on the information acquired, a mathematical model was developed in order to obtain solute concentration profiles inside the membrane and their evolvement along time.
Highlights
Method for characterising the solute transient transport through dense membranes
On-line mass spectrometry monitoring tool for real-time transport characterisation
Time-dependent diffusion coefficients were calculated in whole transient regime Mathematical model estimated solute concentration profiles inside the
membrane
December 6, 2014
Ref.: Ms. No. JMS-14-1420R1
Dear Prof Jerry Y.S. Lin,
We acknowledge the reception of your email with the Reviewers’ comments to our manuscript No. JMS-14-1420R1. We dealt with their comments most carefully and revised our work accordingly, as shown in the file “Response to Reviewer”.
With my best regards, Carla Brazinha
1 2 3 4 5 6 7 8 9 10 11 12 13 14 15 16 17 18 19 20 21 22 23 24 25 26 27 28 29 30 31 32 33 34 35 36 37 38 39 40 41 42 43 44 45 46 47 48 49 50 51 52 53 54 55 56 57 58 59 Ref.: Ms. No. JMS-14-1420R1
Characterisation and modelling of transient transport through dense membranes using on-line mass spectrometry Journal of Membrane Science
Note: The alterations introduced in the revised manuscript are marked in yellow.
Answers to the comments from Reviewer #1
The authors acknowledge the positive appreciation of Reviewer #1 and the comments provided. We dealt with these comments in the following way:
“Reviewer #1: I think the authors tried to correspond to the comments of the referees and the manuscript is acceptable with minor revisions. The followings are my comments.”
1) I pointed that there were errors or confusion in expression. After revision, most of them were corrected. However at the 1st line in page 21 and in the caption of Figure 3, the expression 'pperm,i' remains. Please correct them.
In the caption of Figure 3 and at page 11, line 1 (now line 25), „pperm,i‟ was replaced
by „pi,perm‟.
2) I think the authors' answers to the comments of Reviewer #3 are important. Although I feel the swelling of 5% of the thickness is sometimes substantial, it is not easy to predict the changes of permeation parameters under the condition.
In order to clear out this issue, the following paragraph was introduced:
Page 8, starting line 49: “In both cases, it was observed a minimal membrane swelling (taking swelling as an increase of the membrane dimensions, due to solubilisation of constituents of the feed stream). In spite of low membrane swelling, which translates in a very small change of membrane thickness (negligible in the case of the ceramic membrane and lower than 5% in the case of POMS), the internal structure of both membranes changes during the transient period, affecting the corresponding values of the solute diffusion coefficient. This is why the diffusion coefficient evolves during the transient period. This effect is captured by the experimental results obtained and the model developed.”
*Annotated manuscript files
1 2 3 4 5 6 7 8 9 10 11 12 13 14 15 16 17 18 19 20 21 22 23 24 25 26 27 28 29 30 31 32 33 34 35 36 37 38 39 40 41 42 43 44 45 46 47 48 49 50 51 52 53 54 55 56 57 58 59 60
3) So the present methodology is practically important. From this viewpoint, the answer to the comment 5) of Reviewer #3 is better to be mentioned in the manuscript, probably in the Appendix.
Following the reviewer #1 comment, the following text was introduced in the manuscript:
Page 9, lines 45-46 (now page 10, lines 3-5): “Equation (3) assumes a predominantly diffusive flux over a convective flux, assessed by the calculation of the Peclet number, which is lower than 0.18 in both case-studies”.
Answers to the comments from Reviewer #3
The authors acknowledge the comments provided by Reviewer #3. We dealt with these comments in the following way:
“Reviewer #3: Although the authors accepted some of my comments they did not answer (or probably did not understand) my main (the first) question. I agree that there is no way to measure experimentally the solute local concentrations inside the membrane during short transient periods.
1) But who can approve that concentration profiles which are evaluated using experimental time-dependent flux and accepted model are realistic?”
The approach proposed in this work allows for measuring solute concentrations in the feed and permeate streams, in contact with the membrane, at very short time intervals (differential time increments). From this information, it is possible to infer instantaneous solute concentration driving forces and, ultimately, time-dependent diffusivities and concentration profiles across the membrane during short transient periods. Traditional approaches where, the concentration of solute in the contacting streams is determined for a long time-span, do not allow for obtaining this information.
1) “Another important thing - knowing of dependence D(t) do not allow us to use it for other membrane and/or other feed solution. So, I am afraid that knowledge of D(t) is useless for the predicting purpose.”
The characterisation of the transient transport proposed in this work is supported in experimental data, which should be acquired for each case-study under study. The approach developed allows for comparing D(t) and solute concentration profiles for different membrane-solute systems and infer about the impact of membrane characteristics and solute properties on the transport process.
1 2 3 4 5 6 7 8 9 10 11 12 13 14 15 16 17 18 19 20 21 22 23 24 25 26 27 28 29 30 31 32 33 34 35 36 37 38 39 40 41 42 43 44 45 46 47 48 49 50 51 52 53 54 55 56 57 58 59
Characterisation and modelling of transient transport through dense membranes using on-line mass spectrometry
S.C. Fraga1, L. Trabucho2*, C. Brazinha1* and J.G. Crespo1
Abstract
This work presents a methodology for characterising solute transport through pervaporation membranes or, more generally, through dense membranes, in the whole transient regime. A real-time characterisation of transport through dense membrane is obtained by using on-line mass spectrometry (MS) monitoring, which allows to acquire the concentration of solutes in the permeate compartment with time intervals of 2 seconds (and shorter if required). Time-dependent diffusion coefficients, D(t), were calculated for the whole operation period, including the initial transient period. Based on these values it is possible to infer about the relevance of solute-membrane interactions and rearrangement of the membrane structure due to the presence of permeant solutes. Finally, based on the information acquired, a mathematical model was developed in order to obtain solute concentration profiles inside the membrane and their evolvement along time.
Keywords: transient diffusion, time-dependent diffusion coefficients, mass spectrometry, pervaporation, on-line monitoring
*corresponding authors
1REQUIMTE/CQFB, Department of Chemistry, Faculdade de Ciências e Tecnologia,
Universidade Nova de Lisboa, Campus de Caparica, 2829-516 Caparica, Portugal; *Email: [email protected]; Telephone: +351 21 294 83 85; Fax: +351 21 294 83 85
2Departamento de Matemática, Faculdade de Ciências e Tecnologia, Universidade
Nova de Lisboa, Quinta da Torre, 2829-516 Caparica, Portugal; *Email: [email protected]; Telephone: +351 21 294 83 88; Fax: +351 21 294 83 91
*Manuscript
1 2 3 4 5 6 7 8 9 10 11 12 13 14 15 16 17 18 19 20 21 22 23 24 25 26 27 28 29 30 31 32 33 34 35 36 37 38 39 40 41 42 43 44 45 46 47 48 49 50 51 52 53 54 55 56 57 58 59 60 1. Introduction
Mass transport through dense membranes is most commonly studied under steady-state conditions, when constant permeate flux of solutes and solvent are observed. The study of the transient period of mass transport, although more complex, has attracted the attention of researchers because it may offer a route for a better understanding of the membrane under study and how it interacts with the permeating species. Mass transport in pervaporation but also in organic solvent nanofiltration [1], gas and vapour permeation, is usually described by the solution-diffusion model [2-5]. Therefore, estimation of diffusion coefficients during the time-course of the transient transport process is critical. This issue is relatively simple when the permeating species do not induce major alterations in the structure of the membrane, as is the case of most gases when permeating through polymeric membranes, but it becomes rather complex when the permeating species have very high affinity to the membrane, causing swelling and rearrangements in the membrane structure [6], which impact in their flux and selectivity.
The most common technique used to characterise mass transport through dense membranes is the time-lag method, originally conceived by Daynes in 1920 [7], in order to study mass transfer through an elastomeric material. This method was refined and extended by authors as Barrer and Crank, and applied to a large variety of materials. Rutherford and Do published an excellent review of the most significant work developed with this technique up to 1997 [8]. The time-lag permeation method is a flexible and powerful technique that can give both equilibrium (sorption coefficient) and transport properties (diffusivity and permeability) in a single experiment [9]. Nevertheless, the standard mathematical analysis used with this technique assumes that the concentration of the permeating compounds is null inside the membrane at the downstream side and that the diffusion coefficient is constant throughout the transient permeation period. Therefore, the calculated diffusion coefficient does not account for possible material rearrangements that permeating solutes may cause during the initial stage of the transient regime [10 - 12]. Some authors [13 - 15] calculated concentration-dependent diffusion coefficients from transient sorption data. These studies were performed by changing and monitoring solute concentration at the upstream face of the membrane, in order to determine the plasticisation parameters of a penetrant, which diffusivity is assumed to depend exponentially with its concentration. However, the treatment of data is established assuming a Fickian diffusion process with a constant diffusion coefficient.
1 2 3 4 5 6 7 8 9 10 11 12 13 14 15 16 17 18 19 20 21 22 23 24 25 26 27 28 29 30 31 32 33 34 35 36 37 38 39 40 41 42 43 44 45 46 47 48 49 50 51 52 53 54 55 56 57 58 59
Most time-lag work has been performed with mono-component gas systems, where data is obtained by an accurate recording of pressure in the receiving compartment but, more recently, several papers have been published using on-line mass spectrometry in order to characterise the simultaneous permeation of multiple species [10, 11, 14 - 16]. On-line mass spectrometry (MS) is a suitable monitoring tool for characterising the whole transient regime of permeation of mixtures of compounds through dense films, because it allows for determining permeate compositions and partial pressures, fluxes and selectivities in real-time [17]. Bowen et al. [10] measured constant diffusion rates of different compounds in zeolite membranes using the time-lag analysis through transient responses in the permeate, monitored with a quadrupole mass spectrometer. A similar technique was used by Tanaka et al. [11] to measure the diffusion coefficient in polymeric membranes.
The challenge still relies on the development and validation of an on-line mass spectrometry technique able to acquire composition data in the permeate compartment with a minimal time interval. Ideally, one data-point per second would allow studying systems that undergo a fast change during the initial transient stage of species penetration in the membrane [17, 18]. Additionally, the transport of vapours through dense membranes introduces a degree of complexity which results from the non-constancy of the diffusion coefficient along the time-course of permeation during the transient period [8, 9], due to the progressive increase of concentration of the permeating species inside the membrane. This increase in concentration may lead to membrane swelling and rearrangement of the polymer material with impact on the permeation process and, ultimately, the diffusion coefficient of these species.
The changes occurring in a membrane during the whole transient regime depend on its internal structure and impact directly on the diffusion of the permeating species through the membrane. Therefore, the study of the whole transient regime may contribute for the fundamental understanding of structure-transport relationships in dense membranes. The design, development and fabrication of new and improved membranes for specific applications will directly benefit from this knowledge.
The goal of this work is to develop an adequate methodology for characterising solute transport through pervaporation membranes or, more generally, through dense membranes, in the whole transient regime. What really matters is the impact of the solute local concentration on the membrane itself and, ultimately, on the ease /
1 2 3 4 5 6 7 8 9 10 11 12 13 14 15 16 17 18 19 20 21 22 23 24 25 26 27 28 29 30 31 32 33 34 35 36 37 38 39 40 41 42 43 44 45 46 47 48 49 50 51 52 53 54 55 56 57 58 59 60
knowledge there is no way to measure experimentally the solute local concentrations inside the membrane during short transient periods. Experimental approaches such as Raman confocal microscopy could give the required spatial resolution but not within the required time-scale. Therefore, there are not techniques allowing for obtaining local solute concentrations during the fast transient periods under study. The approach followed in this study is based on the ability to obtain permeation data with time intervals as short as 2 seconds. Considering the extremely high quality of the data obtained (with not observable scatter) this data can be further interpolated, making possible to obtain a “continuum” of permeation data (and a “continuum“ of D(t) experimental vales). The approach followed in this work is therefore supported on the assumption that, although the diffusion coefficient does not depend intrinsically from time, this dependence accommodates all possible effects that impact on the diffusion coefficient values.
A real-time characterisation of transport through dense membrane is obtained by on-line MS monitoring in terms of the solute partial pressures and fluxes. With these experimental parameters, together with the sorption coefficients of the solutes in the membranes under study, a mathematical model is developed in order to estimate the permeating solutes concentration profiles across the membrane, along time. The characterisation of the transient regime was carried out in this work for evaluating the changes that occur in the membrane material when exposed to penetrating solutes. Time-dependent diffusion coefficients, D(t), were calculated, supported on the on-line MS monitoring technique, where each increment of time was as short as 2 seconds.
Two case-studies were selected, corresponding to different systems, using permeating solutes with different affinity towards the membranes under study. The dehydration of solvents, in this case of isopropanol, was selected because it is the most relevant industrial application of pervaporation processes, with important economical savings when compared to conventional distillation processes [19 - 21]. This system was also selected because, due to the character of the membrane (ceramic, hybrid silica-based, HybSi®), minimal changes are expected to occur in the membrane structure during permeation [22 - 23]. The second case-study selected involves the recovery of aromas from dilute aqueous streams, in this case of dilute ethyl acetate in water. A modified silicon–rubber composite membrane (polyoctylmethylsiloxane-polyetherimide, POMS-PEI) is used in this organophilic pervaporation process and a higher degree of polymer rearrangement is anticipated.
1 2 3 4 5 6 7 8 9 10 11 12 13 14 15 16 17 18 19 20 21 22 23 24 25 26 27 28 29 30 31 32 33 34 35 36 37 38 39 40 41 42 43 44 45 46 47 48 49 50 51 52 53 54 55 56 57 58 59 2. Experimental 2.1. Materials
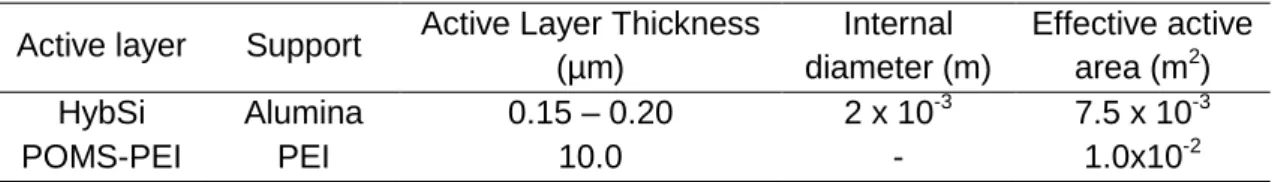
The components used to prepare the feed solutions were isopropanol (99.8% Merck, Germany), ethyl acetate (99.5%, Merck, USA) and deionised water. Two different types of dense membranes were used, a tubular Hybrid Silica selective ceramic membrane HybSi® (Pervatech, The Netherlands) and a modified silicon–rubbery composite membrane of polyoctylmethylsiloxane supported on a porous structure of polyetherimide POMS-PEI (GKSS, Germany). These membranes were selected to be used, respectively, in the dehydration of solvents [24] and in the recovery of a representative aroma compound from wine-must [17, 25]. These membranes were used for isopropanol dewatering and for ethyl acetate recovery. The properties of these membranes are in listed in Table 1.
2.2. Experimental set-up
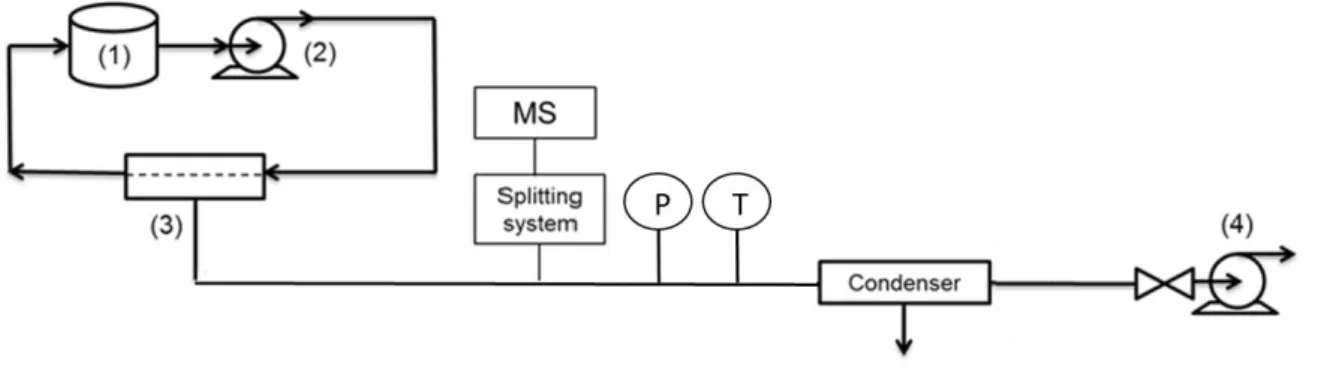
The pervaporation-condensation system used was coupled on-line to a mass spectrometer using the experimental setup represented in Figure 1.
The set-up for isopropanol dewatering includes a tubular stainless steel pervaporation cell (Pervatech, Netherlands) connected to a condenser. The feed vessel was a water jacketed vessel in which the temperature of water was controlled by a controlling bath (model CW 05G, JeioTech, Korea). The pervaporation module and the permeate circuit (to the condenser) was covered with a heating tape connected to a temperature controller (CB100, from RKC Instruments Inc., Japan). A rotary vane pump (DUO 2.5, Pfeiffer Vacuum, Germany) assured vacuum conditions in the permeate circuit and the downstream pressure was measured by a pressure gauge consisting of a capacitance manometer, model 600 Barocel, and a transducer power supply model 1575 (BOC Edwards, UK). The condenser was a glass U-shape trap immersed in liquid nitrogen (temperature of -196 ºC) which condensed all vapours permeating through the membrane. The splitting system to the MS consisted of a sapphire needle valve at 60ºC in order to avoid vapour condensation. The mass spectrometer (Prisma Plus QMG 220 M2, Pfeiffer Vacuum, Germany) was used with an axial beam ion source, emission current 1mA, electron energy 70 eV, single quadrupole, secondary electron multiplier SEM detection.
1 2 3 4 5 6 7 8 9 10 11 12 13 14 15 16 17 18 19 20 21 22 23 24 25 26 27 28 29 30 31 32 33 34 35 36 37 38 39 40 41 42 43 44 45 46 47 48 49 50 51 52 53 54 55 56 57 58 59 60
The pervaporation unit used for the recovery of ethyl acetate from water is described in detail in Brazinha et al. [17]. The rig includes a flat membrane test cell, which provides a radial flow over the membrane, and two condensers in series. The condensers were U-shaped traps: the first condenser was immersed in a refrigerated bath (FP500-MC model, Julabo, Germany) and the second one in liquid nitrogen. The feed water-jacketed vessel, the rotary pump and the devices for measuring pressure and temperature in the downstream circuit were the same as in the isopropanol dehydration system. The mass spectrometer (QMA125, Blazers, Germany) had the same features of the mass spectrometer of the previous system but with a Faraday Cup detection. The permeate was connected to the mass spectrometer through a splitting system with a needle valve installed in a tube line and adjusted according to the objective of each experiment.
2.3. Operating conditions
The feed compositions used in the pervaporation experiments were 5% wt of deionised water in isopropanol and 50 ppm of ethyl acetate in deionised water. In both systems the solutes were added in the beginning of the experiments and conditions were imposed in order to assure a constant feed composition during the experiments. The isopropanol dehydration unit was operated with a feed volume of 1 L and at linear feed stream velocity inside the membrane module of 2 m/s corresponding to a Reynolds number of approximately 4500. Temperature of the pervaporation module, the feed vessel and the permeate circuit was kept constant at 40 ºC. The permeate pressure, pperm [Pa], was kept at 83 Pa. Regarding the ethyl acetate recovery, experiments were
performed with a feed volume of 11L in order to ensure that the concentration of solute was constant throughout each experiment. The feed Reynolds number was maintained constant at 430 [25]. The temperature of the feed vessel and the permeate circuit was kept at 24±1 ºC and the permeate pressure was varied between 100 and 200 ± 10 Pa. The properties of the feed solution are listed in Table 2. The Henry constant of compound i, Hi [Pa], is the product of its activity coefficient, i [-], and its saturated
vapour pressure, pvi [Pa].
2.4. Sorption experiments
The sorption experiment of water in the HybSi® material was conducted at 40ºC starting with a binary mixture of 5%wt water in isopropanol (IPA), as in the pervaporation experiment performed to process this solution. The material was the active dense layer of the organic-inorganic hybrid silica-based hydrophilic membrane, HybSi®, provided by Pervatech. Small pieces of this active dense layer of HybSi®
1 2 3 4 5 6 7 8 9 10 11 12 13 14 15 16 17 18 19 20 21 22 23 24 25 26 27 28 29 30 31 32 33 34 35 36 37 38 39 40 41 42 43 44 45 46 47 48 49 50 51 52 53 54 55 56 57 58 59
were placed in contact with the solution, in a mass ratio of solution to material of 3:1, in vials commonly used for headspace sampling in GC analysis, in order to assure a close system. A stirring and heating plate with a temperature controller was used. The vial was stirred with a magnetic stirrer for homogenising the mixture. The water content in the solution was periodically measured with a Karl-Fisher equipment (Model 756 KF Coulometer, Metrohm, Switzerland) after sampling with a gas tight syringe, from the beginning of the experiment until a stabilised value of water concentration was reached. Determination of sorption of ethyl acetate in the dense polymer POMS at 18ºC is described in Schäfer et al [28] using a similar method used for water, as described above.
2.5. Mass Spectrometry monitoring
A mass spectrometer characterises compounds according to their specific mass to charge ratio (m/z) and intensity of electric signal, providing a characteristic mass spectra of a specific compound. First the mass spectra are acquired in the scan mode in order to detect all mass fragments (m/z) for a defined compound. After the characteristic mass peaks are chosen, MS data is shown in the multiple ion detector (MID) mode. The selected mass fragments monitored were: m/z 18 for water, m/z 43 for ethyl acetate and m/z 43 also for isopropanol (ethyl acetate and isopropanol were not present in the same samples). The calibration procedure chosen is described in detail in [17]. Briefly, it converts the MS intensity of each individual compound in its corresponding pressure, assuring that each compound under study is the only specie in the circuit. The temperature is maintained constant as in the pervaporation experiments, measured and controlled with a temperature controller (CB100, from RKC Instruments Inc., Japan) connected to a heating tape in the circuit. This calibration procedure allows for studying situations where a sudden and significant change in composition of the vapour stream occurs, since it can be performed in a wide range of partial pressures.
2.6. Off-line analysis
In order to confirm the concentrations provided by mass spectrometry, off-line analyses were performed to the condensate of the pervaporation experiments for both systems. The water content of the condensate was measured by a Refractive Index equipment. The concentration of ethyl acetate was measured by Gas Chromatography GC using a gas chromatograph CP-3800, Varian, USA, connected to an automatic sampler (Combi PAL, CTC Analytics, Switzerland) with a FFAP-CB capillary column Varian CP 7485.
1 2 3 4 5 6 7 8 9 10 11 12 13 14 15 16 17 18 19 20 21 22 23 24 25 26 27 28 29 30 31 32 33 34 35 36 37 38 39 40 41 42 43 44 45 46 47 48 49 50 51 52 53 54 55 56 57 58 59 60
The method is described in [19]. Before injection, a previous dilution with water was performed, followed by a solvent extraction step with diethyl ether.
2.7. Calculation methods
Fittings to experimental data were performed using the TableCurve 2D® software. The model for characterising solute transient transport was developed using the Maple and the Wolfram Mathematica technical computing softwares, two different programs used in an independent way in order to assure confidence in the results.
3. Results and Discussion 3.1. Sorption experiments
At 40 ºC, the solution of water in isopropanol (5.0 % wt of water in isopropanol) in contact with the hybrid silica membrane, HybSi®, reached equilibrium conditions in less than two hours, as shown in Figure 2.
The sorption coefficient obtained for water in hybrid silica, HybSi®, was found to be Sw=1.2, using equation (1): conditions m equilibriu solution w membrane w w w w S , , (1)
where w [-] is the weight fraction. Sorption coefficient experiments were also performed for ethyl acetate in POMS, according to [28]. The sorption coefficient determined was 5.4, at 18 ºC, which was assumed to be very similar at 24±1 ºC (the temperature used in the pervaporation experiments). The sorption coefficients values for the two solutes under study in the respective membrane materials show that these solutes have a higher affinity towards the contacting membranes than to the solutions.
In both cases, it was observed a minimal membrane swelling (taking swelling as an increase of the membrane dimensions, due to solubilisation of constituents of the feed stream). In spite of low membrane swelling, which translates in a very small change of membrane thickness (negligible in the case of the ceramic membrane and lower than 5% in the case of POMS), the internal structure of both membranes changes during the transient period, affecting the corresponding values of the solute diffusion coefficient.
1 2 3 4 5 6 7 8 9 10 11 12 13 14 15 16 17 18 19 20 21 22 23 24 25 26 27 28 29 30 31 32 33 34 35 36 37 38 39 40 41 42 43 44 45 46 47 48 49 50 51 52 53 54 55 56 57 58 59
This is why the diffusion coefficient evolves during the transient period. This effect is captured by the experimental results obtained and the model developed.
3.2. Characterisation of steady state transport properties
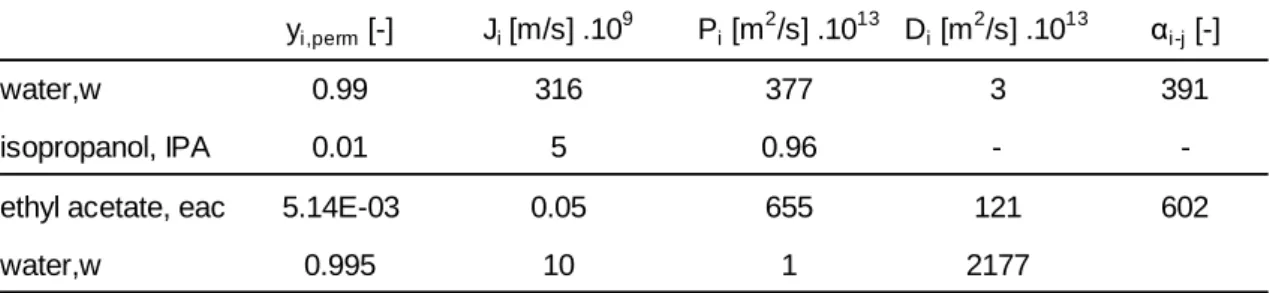
The length of each pervaporation test was enough to ensure that steady state was achieved (easily identified through the established MS online monitoring technique). The condensate from the steady period state was collected and characterised (using a Refractive Index measurement or by gas chromatography, according with the experiment) in terms of the solute molar fraction, partial fluxes (calculated from total fluxes and permeate composition), permeabilities, diffusion coefficients and selectivity (see Table 3). Composition of permeates, at steady state, determined off-line, was compared with the composition obtained on-line by MS measurement. Permeabilities, Pi [m2/s] were calculated using the 1st Fick’s law for systems at steady-state, using the
sorption coefficient of solute i experimentally determined (water and ethyl acetate) and considering the gradient of partial pressure as the driving force of the process, through equation (2):
i feed iperm
i i ip
p
H
L
P
J
,
,
(2)where pi,feed and pi,perm [Pa] are respectively the partial pressure of compound i in the
feed and permeate compartments, which were calculated by the Raoult and Henry’s laws.
i feed i feed vi feed iperm perm
i i ix
p
T
y
p
H
L
P
J
,
, , (2’)where L is the thickness of the active dense layer of film (m), Tfeed is the temperature at
the feed side and yi,perm [-] is the molar fraction of compound i in the permeate.
The solutes’ diffusion coefficients in the steady state, Di [m2/s], were calculated through
equation (3)
i i
i
S
D
1 2 3 4 5 6 7 8 9 10 11 12 13 14 15 16 17 18 19 20 21 22 23 24 25 26 27 28 29 30 31 32 33 34 35 36 37 38 39 40 41 42 43 44 45 46 47 48 49 50 51 52 53 54 55 56 57 58 59 60
and the solute selectivity in relation to the solvent, αi-j [-], was defined as the ratio of the
solute and solvent permeabilities. Equation (3) assumes a predominantly diffusive flux over a convective flux, assessed by the calculation of the Peclet number, which is lower than 0.18 in both case-studies.
The ethyl acetate diffusion coefficient in the POMS membrane was found to be three orders of magnitude higher than the water diffusion coefficient in the hybrid silica membrane (see Table 3), even though ethyl acetate is a larger molecule (molecular mass of 88 g/mol) than water (molecular mass of 18 g/mol). This behaviour may be explained by the fact that the hybrid silica membrane, HybSi®, has a more rigid structure than the elastomeric POMS membrane.
3.3. Characterisation of solute permeation by on-line mass spectrometry
The transient period of pervaporation was characterised in terms of real-time permeate compositions and partial fluxes of the solutes (water and ethyl acetate), through on-line mass spectrometry monitoring, as shown in Figure 3. Considering the linear relation between partial fluxes and corresponding intensities of electric signal of the characteristic mass peak, as shown in [18], the on-line partial fluxes, Ji (t), were
calculated using equation (4):
t
I
t
I
t
J
t
J
i i i i (4)The partial fluxes obtained using off-line methods (when the system is under steady state) were found to be similar to those obtained by mass spectrometry for the same period, as can be seen by comparing Ji values, shown in Table3 and Figure 3. The values obtained by mass spectrometry in steady state were, therefore, validated when compared with those obtained by off-line measurement.
The partial pressures of each solute i in the permeate side, pi,perm [Pa], and its partial
fluxes, Ji [m/s], were obtained by MS monitoring, enabling the acquisition of one
data-point in every few seconds. This result is particularly remarkable and useful for monitoring fast transient periods. In this work it was possible to acquire one data point every two seconds, but this acquisition period may be additionally reduced.
The equation of transport (2’’) and equations (5) and (6), obtained combining the equation of transport (2’) with equations (3) and (4), were defined for the whole
1 2 3 4 5 6 7 8 9 10 11 12 13 14 15 16 17 18 19 20 21 22 23 24 25 26 27 28 29 30 31 32 33 34 35 36 37 38 39 40 41 42 43 44 45 46 47 48 49 50 51 52 53 54 55 56 57 58 59
transient period, making possible to relate the flux and the diffusion coefficient of the solute:
t k D
t
k p
t
Ji 1 i 2 i,perm (2’’) i iH
L
S
k
1 (5) k2 pi,feed (6)where L [m] is the thickness of the membrane, x [m] is the space coordinate through which the mass transport occurs across the membrane, x=0 corresponds to the membrane/feed interface and x=L corresponds to the membrane/permeate interface. k1 [Pa-1.m-1] and k2 [Pa] are constants. The partial permeate pressure of the solute
pi,perm [Pa] and the solute partial fluxes Ji [m/s] evolve along time and were determined
with a time interval as short as 2 seconds. The solute diffusion coefficient, Di [m2/s], is
only dependent on time and is a spatial average for each short t. Consequently, solute diffusion coefficients through the whole transient period were calculated, from eq. (2’’) to (6) (see Figure 4), using eq. (7):
0; 0 2 1 t t p k k t J t D (7)The evolvement of D(t) along time, presented in Figure 4 for the transport of water through the HybSi membrane and for ethyl acetate through the POMS membrane, offers extremely interesting information. In first place, it presents the actual values of the diffusion coefficients of target solutes and allows for comparing their absolute value. For the cases under study, it was interesting to find that the water diffusion coefficient through the HybSi membrane is smaller than the ethyl acetate diffusion coefficient through the POMS membrane. This behaviour results from the character of the HybSi membrane, which presents a more rigid structure, making difficult the diffusion of any permeant. In contrast, POMS is known as an elastomeric polymer that can easily accommodate permeant compounds, which can ultimately induce rearrangements in the polymer structure and lead to swelling effects. When comparing the evolvement of D(t)/D∞ for both solutes it can be observed that the diffusion
1 2 3 4 5 6 7 8 9 10 11 12 13 14 15 16 17 18 19 20 21 22 23 24 25 26 27 28 29 30 31 32 33 34 35 36 37 38 39 40 41 42 43 44 45 46 47 48 49 50 51 52 53 54 55 56 57 58 59 60
quicker than ethyl acetate in POMS, which is explained by the minor effect it induces in the structure of the more rigid membrane HybSi material. These curves, D(t)/D∞, allow therefore to infer about the relevance of solute-membrane interactions and their relative importance.
It is interesting to mention that the transport of ethyl acetate through a POMS membrane can be studied using the time-lag method. The value found for the diffusion coefficient of ethyl acetate using this method is 1.2 x 10⁻¹² m2/s with a time-lag of 13.8s. This value is of the same order of magnitude of the average value of the experimental time-dependent diffusion coefficient of ethyl acetate (Figure 4b) between 0 s and 13.8 s (5.6 x 10⁻¹² m2/s, calculated from Figure 4b). However, the time-lag method does not allow to obtain a complete D(t) evolvement curve which can tell us a lot about the relevance of the solute-membrane interactions established.
3.4. Development of a mathematical model for solute transient transport through a dense membrane
Supported on the quality of the experimental data acquired by mass spectrometry, the next step was to derive the concentration profiles of the permeant solutes along the diffusion spatial coordinate (assuming a unidirectional flux). Using the on-line data obtained by mass spectrometry, the permeating solutes concentration profiles across the membrane were calculated along time.
In order to develop this mathematical model, fittings to the experimental values of solute permeate pressure (Figure 3) and solute flux were performed using the TableCurve 2D® software and were used in the model. Solutes sorption coefficients were also considered in the model, as well as other constants related with the solutes, namely their saturated vapour pressure at feed temperature, their Henry’s constant and their molar fractions at the feed and permeate compartments (see eq.s. (2’’), and (5) to (7)).
The analytical model proposed for the transient mass transport of a solute through a dense membrane material considered the following assumptions:
i. the fluid dynamic conditions used are sufficiently good to assure that the external mass transfer boundary layers (feed and permeate) are not relevant;
ii. the solute sorption is an extremely fast process that does not limit the process from a kinetic point of view;
1 2 3 4 5 6 7 8 9 10 11 12 13 14 15 16 17 18 19 20 21 22 23 24 25 26 27 28 29 30 31 32 33 34 35 36 37 38 39 40 41 42 43 44 45 46 47 48 49 50 51 52 53 54 55 56 57 58 59
iii. the active membrane layer is considered homogeneous for each short increment of time between measurements , and
iv. the diffusion of the solute is unidirectional, occurring only in the perpendicular direction to the membrane surface.
The first assumption is valid for the system of ethyl acetate in water according to the study performed previously for ethyl acetate transport versus feed Reynolds number [25]. This assumption is also valid for the system of water in isopropanol considering the high value of feed Reynolds number of 4500, which clearly assures a turbulent flow, confirmed by the study of water transport versus feed Reynolds number, as referred in [25]. The second assumption reflects the fact that interfacial phenomena are not the rate controlling steps in the penetrant transport from the external phase into the membrane material [15]. The third assumption is reasonable if we consider the extremely short time-interval achieved for data acquisition by mass spectrometry. The fourth assumption considers that the volume change of the polymer is small enough to assure a non-deformed coordinate system.
The change of concentration inside the membrane in the transient state can be given by the following expression:
0; 0 , 0 t L x x c t D x t c (8)where x=0 and x=L corresponds to the upstream and downstream interfaces of the membrane, respectively.
The initial condition of the model:
x
x
L
c
,
0
0
;
0
(9)
means that no solute is in the membrane at t = 0. The boundary conditions are:
0
;
)
,
0
(
t
c
1t
c
(10)
,
; 0 L t J t t x c t D (11)1 2 3 4 5 6 7 8 9 10 11 12 13 14 15 16 17 18 19 20 21 22 23 24 25 26 27 28 29 30 31 32 33 34 35 36 37 38 39 40 41 42 43 44 45 46 47 48 49 50 51 52 53 54 55 56 57 58 59 60
where c1 [-] is the solute concentration at the upstream surface of the membrane (x=0)
(in weight fraction units) which considers the solubility of the solute in the membrane, and is given by the product of the solute concentration in the bulk feed solution (which was kept constant during the pervaporation experiment) and the solute sorption coefficient. The concentration at the downstream surface of the membrane (x=L) and for t>0 is considered to be given by the partial pressure in the permeate circuit in each instant of time.
The output of the model is the concentration of the solute inside the membrane, which varies with the spatial coordinate x and time t, c(x, t). The solution of the model is a concentration c(x, t) that is given as the sum of a transient (u) and of a quasi-stationary (r) component:
x
,
t
u
x
,
t
r
x
,
t
;
0
x
L
,
t
0
c
(12)The transient component, function of x and t, was the product of orthogonal functions Xn(x) and Tn(t), unique solutions of the problem of Cauchy type solved numerically
through the Euler method. The quasi-stationary component, function of x and t, were calculated with series of Fourier. When the diffusion coefficient was considered constant, the model was solved analytically. The detailed explanation of the solution of the model is given in Appendix A.
Figure 5 shows the solutes’ concentration profiles inside the membranes at different instants of time, considering time-dependent diffusion coefficients, for the systems water / HybSi and ethyl acetate / POMS-PEI. Time zero corresponds to the instant of time immediately before the solute started permeating the membrane, according to the initial condition of the model (eq. 9).
The calculated concentrations profiles and their evolvement with time are extremely difficult to acquire experimentally, involving the use of sophisticated techniques, namely confocal methods such as confocal Raman. For the very short time span associated with transient periods it may be not possible to use these techniques and, under these circumstances it may not be possible to acquire solute concentration profiles inside dense membranes for the transient period. The concentration profiles presented in Figure 5 are non-linear and progressively approach a more linear profile. This
1 2 3 4 5 6 7 8 9 10 11 12 13 14 15 16 17 18 19 20 21 22 23 24 25 26 27 28 29 30 31 32 33 34 35 36 37 38 39 40 41 42 43 44 45 46 47 48 49 50 51 52 53 54 55 56 57 58 59
behaviour reflects the evolvement of the membrane material as the penetrant solute starts by inducing rearrangements in the membrane structure until a more stable internal arrangement is achieved, as steady-state approaches. As expected, it can be seen the fast evolvement of the concentration profiles when water permeates the HybSi membrane (a shorter membrane rearrangement is induced), while this process takes longer when ethyl acetate is transported through the elastomeric POMS-PEI membrane.
In Figure 6, water and ethyl acetate concentrations inside the respective membranes, at the downstream interface of the membrane, are plotted as a function of time. Two different situations were considered: in one case, it was assumed that the solute transport process may be described by using a constant solute diffusion coefficient, calculated from steady-state conditions (D constant); in the other case, it was considered that a variable diffusion coefficient, D(t), is required to properly describe the solute transport process. Obviously, at steady-state both approaches coincide. As it can be seen, the use of constant diffusion coefficients, estimated from steady-state conditions, leads to an overestimation of solute concentrations during the transient period, which are not correct, although expected since the Dconstant values were
estimated when the membranes were already fully rearranged (steady-state) and transport occurs faster. This Figure shows clearly that the use of constant D values is, obviously, adequate for describing transport during steady-state; it also shows that they should not be used to describe transport during the transient period, where they predict wrongly the time required for permeation of the first molecules to the downstream compartment and the concentration of solute in the downstream interface during the transient period.
4. Conclusions
This work demonstrates that on-line monitoring of membrane processes by mass spectrometry offers a number of unique advantages for the understanding of membrane-solute interactions during mass transport. Since the composition of permeate streams can be acquired with time intervals as short as 2 seconds, and shorter, (see Figure 3) it is possible to follow the transport evolvement of multiple compounds through dense membranes from the onset of permeation. The way solute permeation evolves during the initial instants can tell us a lot about the nature of solute-membrane interactions and how the solute-membrane material adapts to the progressive
1 2 3 4 5 6 7 8 9 10 11 12 13 14 15 16 17 18 19 20 21 22 23 24 25 26 27 28 29 30 31 32 33 34 35 36 37 38 39 40 41 42 43 44 45 46 47 48 49 50 51 52 53 54 55 56 57 58 59 60
Specifically this work shows that, using the on-line mass spectrometry technique and the adequate data analysis presented, it is possible to:
- Determine the actual values of solute diffusion coefficients as a function of time elapsed since the onset of permeation, D(t) (see Figure 4a1 and 4a2);
- Compare the absolute values of diffusion coefficient between solutes, for the same membrane or for different (or modified) membranes (see Figure 4a1 and 4a2);
- Infer about membrane-solute interactions and their relative importance, i.e., the impact of solute penetration on membrane adaptation / rearrangement, by analysing and comparing the evolvement of D(t) curves for different solutes in different membranes (see Figure 4b);
- Infer solute concentration profiles inside the membrane as a function of time for different solutes in different membranes (see Figure 5);
- Understand the limitations of describing a transient transport process using diffusion coefficients calculated from steady-state conditions (see Figure 6).
This methodology represents a fast and simple approach which can be used for guiding membrane development and better understanding of the impact of different membrane structures on solute transport. As an example that deserves to be studied, is the development of membranes starting from the same material but where different degrees of cross-linking are used [29]. Such membrane structures lead to different solute-membrane interactions and, therefore, different c(L, t) and D(t) profiles which can be obtained using the approach discussed. The same applies for situations where nanoparticles [30, 31] or flakes are introduced within the membrane, either aiming to increase mass transport or hinder the permeation of given species.
5. Acknowlegments
The authors would like to acknowledge the financial support provided by the European KBBE FP7 project entitled SOLVER (Solvent Purification and Recycling in the Process Industry using Innovative Membrane Technology). The authors would like to acknowledge the Fundação para a Ciência e a Tecnologia, Portugal for the PhD grant of Sofia Fraga (SFRH/BD/81814/2011) and the Pos Doctoral Fellow grant of Carla Brazinha (SFRH/BPD/79533/2011). The authors would also like to acknowledge Pervatech and GKSS for the kind donation of membranes. The work of L. Trabucho
1 2 3 4 5 6 7 8 9 10 11 12 13 14 15 16 17 18 19 20 21 22 23 24 25 26 27 28 29 30 31 32 33 34 35 36 37 38 39 40 41 42 43 44 45 46 47 48 49 50 51 52 53 54 55 56 57 58 59
was partially supported by the Fundação para a Ciência e a Tecnologia through PEst-OE/MAT/UI0209/2013 and PTDC/MAT109973/2009 programmes.
References
[1] P. Silva, S. Han, A.G. Livingston, Solvent transport in organic solvent nanofiltration membranes, J. Membr. Sci. 262 (2005) 49-59.
[2] P. Shao, R.Y.M. Huang, Polymeric membrane pervaporation, J. Membr. Sci. 287 (2007) 162-179.
[3] P. Schaetzel, C. Vauclair, Q.T. Nguyen, R. Bouzerar, A simplified solution–diffusion theory in pervaporation:the total solvent volume fraction model, J. Membr. Sci. 244 (2004) 117–127.
[4] Mitesh R. Shah, Richard D. Noble, David E. Clough, Analysis of transient permeation as a technique for determination of sorption and diffusion in supported membranes, J. Membr. Sci. 280 (2006) 452-46.
[5] J.G. Wijmans, R.W. Baker, The solution-diffusion model: a review, J. Membr. Sci. 107 (1995) 1-21.
[6] M. Mulder, Basic Principles of Membrane Technology, 2nd edition, Kluwer Academic Publishers.
[7] H.A., Daynes, The process of diffusion through a rubber membrane, Proc. R. Soc. London A97 (1920) 286-306.
[8] S.W. Rutheford, D.D. Do, Review of Time Lag Permeation Technique as a Method for Characterisation of Porous Media and Membranes, Adsorption 3 (1997) 283-312. [9] E. Favre, N. Morliere, D. Roizard, Experimental evidence and implications of an imperfect upstream pressure step for the time-lag technique, J. Membr. Sci. 207 (2002) 1-2, 59–72.
[10] T.C. Bowen, J.C. Wyss, R.D. Noble, J.L. Falconer, Measurements of diffusion through a zeolite membrane using isotopic-transient pervaporation, J. Membr. Sci. 71 (2004) 199-210.
[11] K. Tanaka, Hi. Kita, K. Okamotoa, R. D. Noble, J. L. Falconer, Isotopic-transient permeation measurements in steady-state pervaporation through polymeric membranes, J. Membr. Sci. 197 (2002) 173-183.
[12] C.K. Yeom, B.S. Kim, J.M. Lee, Precise on-line measurements of permeation transients through dense polymeric membranes using a new permeation apparatus, J. Membr. Sci. 161 (1999) 55-56.
[13] N. Follain, Jean-Marc Valleton, L. Lebrun, B. Alexandre, P. Schaetzel, M. Metayer, S. Marais, “Simulation of kinetic curves in mass transfer phenomena for a
1 2 3 4 5 6 7 8 9 10 11 12 13 14 15 16 17 18 19 20 21 22 23 24 25 26 27 28 29 30 31 32 33 34 35 36 37 38 39 40 41 42 43 44 45 46 47 48 49 50 51 52 53 54 55 56 57 58 59 60
concentration-dependent diffusion coefficient in polymer membranes”, J. Membr. Sci., 349,195-207 (2010).
[14] M.R. Shah, R.D. Noble, D.E. Clough, Measurement of sorption and diffusion in nonporous membranes by transient permeation experiments, J. Membr. Sci. 287 (2007) 111-118.
[15] S. Marais, M. Métayer, Q.T. Nguyen, M. Labbé, D. Langevin, New methods for the determination of the parameters of a concentration-dependent diffusion law for molecular penetrants from transient permeation or sorption data, Macromol. Theory Simul. 9 (2000) 207-214.
[16] Ondrej Vopickaa, Vladimir Hyneka, Veronika Rabová, Measuring the transient diffusion of vapor mixtures through dense membranes, J. Membr. Sci., 350 (2010) 217-225.
[17] C. Brazinha, A.P. Fonseca, O.M.N.D. Teodoro, J.G. Crespo, On-line and real-time monitoring of organophilic pervaporation by mass spectrometry, J. Membr. Sci. 347 (2010) 83-92.
[18] T. Schäfer, J. Vital, J.G. Crespo, Coupled pervaporation/mass spectrometry for investigating membrane mass transport phenomena, J. Membr. Sci. 241 (2004) 197– 205.
[19] C. Brazinha, J.G. Crespo, Aroma recovery from hydro alcoholic solutions by organophilic pervaporation: modelling of fractionation by condensation, J. Memb. Sci. 341 (2009) 109–121.
[20] A. Mafi, A. Raisi, Abdolreza Aroujalian, Computational fluid dynamics modeling of mass transfer for aroma compounds recovery from aqueous solutions by hydrophobic pervaporation, J. Membr. Sci. 119 (2013) 46-55.
[21] M. M. Shahrestani, A. Moheb, M. Ghiaci, High performance dehydration of ethyl acetate/water mixture by pervaporation using NaA zeolite membrane synthesized by vacuum seeding method, J. Membr. Sci. 92 (2013) 70-76.
[22] A.Buekenhoudt, F.Bisignano, G. DeLuca, P.Vandezande, M.Wouters, K.Verhulst, Unravelling the solvent flux behaviour of ceramic nanofiltration and ultrafiltration membranes, J. Membr. Sci., 439 (2013) 36-47.
[23] G. M. Shi, T.S. Chung, Thin film composite membranes on ceramic for pervaporation dehydration of isopropanol, J. Membr. Sci. 448 (2013) 34-43.
[24] S. K. Mah,S. P. Chai, T. Y. Wu, Dehydration of glycerin solution using pervaporation: HybSi and polydimethylsiloxane membranes, J. Membr. Sci. 450 (2014) 440-446.
1 2 3 4 5 6 7 8 9 10 11 12 13 14 15 16 17 18 19 20 21 22 23 24 25 26 27 28 29 30 31 32 33 34 35 36 37 38 39 40 41 42 43 44 45 46 47 48 49 50 51 52 53 54 55 56 57 58 59
[25] T. Schafer, J.G. Crespo, Study and optimization of the hydrodynamic upstream conditions during recovery of a complex aroma profile by pervaporation, J. Membr. Sci., 301 (2007) 46-56.
[26] W.J. Lyman, W.F. Reehl, D.H. Rosenblatt, Chemical Property Estimation Methods, McGraw-Hill Book Company, 1982.
[27] Site of National Institute of Standards and Technology http://webbook.nist.gov. [28] T. Schaer, A. Heintz, J.G. Crespo, Sorption of aroma compounds in poly(octylmethylsiloxane) (POMS), J. Membr. Sci. 254 (2005) 259-265.
2 ] .R. Mason, . Maynard- tem, . . J. Heard, . Satilmis, .M. udd, . Friess, M. anc , P. Bernardo, G. Clarizia, J.C. Jansen, Enhancement of CO2 Affinity in a Polymer of Intrinsic Microporosity by Amine Modification, Macromol.47 (2014) 1021−102 .
[30] L. Shao, J. Samseth, M.B. Hägg, Crosslinking and stabilization of nanoparticle filled PMP nanocomposite membranes for gas separations, J. Membr. Sci. 326 (2009) 285-292.
[31] J. E. Bara, A. K. Kaminski, R. D. Noble, D.L. Gin, Influence of nanostructure on light gas separations in cross-linked lyotropic liquid crystal membranes, J. Membr. Sci. 388 (2007) 13-19.
1 2 3 4 5 6 7 8 9 10 11 12 13 14 15 16 17 18 19 20 21 22 23 24 25 26 27 28 29 30 31 32 33 34 35 36 37 38 39 40 41 42 43 44 45 46 47 48 49 50 51 52 53 54 55 56 57 58 59 60 Figure Captions
Figure 1: Representation of the pervaporation unit with online monitoring of the
permeate stream through MS: (1) feed vessel, (2) recirculation pump, (3) pervaporation cell and (4) vacuum pump. The splitting system consists of a heated sapphire valve
Figure 2: Sorption kinetics of water in hybrid silica, HybSi®, using a solution of water in
isopropanol at 40ºC
Figure 3: Experimental permeate partial pressures, pi,perm [Pa] and partial fluxes, Ji
[m/s] obtained through on-line mass spectrometry (MS) monitoring (dots) for (a) the system of water in isopropanol and (b) the system of ethyl acetate in water and the respective fittings to the experimental data (lines)
Figure 4: Solute diffusion coefficients, Di [m2/s], obtained through on-line mass
spectrometry monitoring: (a) water diffusion coefficient in the system of water in isopropanol and (b) ethyl acetate diffusion coefficient in the system of ethyl acetate in water
Figure 5: Time dependent solute weight fraction along the membrane for different
periods of time (a) water concentration along HybSi® membrane and (b) ethyl acetate concentration along POMS-PEI membrane
Figure 6: Solute weight fraction in the membrane at downstream side over time,
calculated using (steady-state) constant and variable diffusion coefficients (a) for water in isopropanol using HybSi membrane and (b) ethyl acetate in water using POMS-PEI dense membrane
1 2 3 4 5 6 7 8 9 10 11 12 13 14 15 16 17 18 19 20 21 22 23 24 25 26 27 28 29 30 31 32 33 34 35 36 37 38 39 40 41 42 43 44 45 46 47 48 49 50 51 52 53 54 55 56 57 58 59
Appendix A: Mathematical model to describe the concentration inside the membrane
The mathematical model aims at characterising the solute transport through dense membranes in the transient regime. The input of the model is the data obtained experimentally through mass spectrometry tool: flux, partial pressure and consequently diffusion coefficient over time. Using this data, the solute concentration profiles along the membrane thickness and at the downstream side were estimated. This information is essential to study the transient period and the changes that occurs in the membrane when in contact with different solutes, especially with high affinity to the membrane material.
1. The analytical model
The following analytical model (equations (8) to (11) of the manuscript) describes the evolution of concentration c(x; t) inside the membrane at a point 0 < x< L and at time t > 0 during all the permeation process. The length of the membrane shall be denoted by L and the concentration, at a point x [0; L] and at time t ≥ 0, by c(x; t).
0
)
(
)
,
(
)
(
0
)
(
)
,
0
(
(A.1)
0
0;
=
c(x,0)
0
0
0
1
t
t
J
t
L
x
c
t
D
t
t
c
t
c
L
x
t
L
x
x
c
D
x
t
c
The second equation stands for the initial condition, which corresponds to zero concentration at all points in the membrane for . The last two equations are the boundary conditions. In the upstream side of the permeation process, the concentration is maintained constant since the feed solution does not change in terms of it composition during the process (c1(t)) . The second boundary condition, is associated
with the flux which is permeating in the downstream surface of the membrane in each instant of time.
The data to the model
*Manuscript
1 2 3 4 5 6 7 8 9 10 11 12 13 14 15 16 17 18 19 20 21 22 23 24 25 26 27 28 29 30 31 32 33 34 35 36 37 38 39 40 41 42 43 44 45 46 47 48 49 50 51 52 53 54 55 56 57 58 59 60
The flux J(t) is given by the experimental data following the equation at any time t ≥ 0 for the whole transient state:
(A.2)
0
t
p(t)];
-D(t)[k
k
=
J(t)
1 2
Where coefficients k1 and k2 are positive constants such that:
(A.3)
0
t
all
for
0
>
p(t)
-k
2
The pressure, p(t), which is obtained experimentally through MS (Figure 3 of the manuscript), is automatically fit into a curve of the following form:
) 4 . ( 0 ; ) ( ) ( 1 1 ) ( t A C E D e E D e C E D D e B t p p p p t C p p t E D p p p p t C p p p p p
where all the coefficients are equal or higher than zero. As a consequence, p(t) ≥0; for
all t ≥ 0. We remark that .
The flux will also be given experimentally with the data obtained by the MS (equation (3) of the manuscript) and will be fit, into a curve of the same type (Figure 3), that is:
) 5 . ( 0 ; ) ( ) ( 1 1 ) ( t A C E D e E D e C E D D e B t J f f f t C f f t E D f f f f t C f f f f f
where all the coefficients are non negative. As a consequence, J(t) ≥0; for all t ≥ 0. We
remark that .
From (A.2), (A.4) and (A.5), the diffusion coefficient for each instant of time will be defined as:
0 0 ( .6) 2 1 A t t p k k t J t D 1 2 3 4 5 6 7 8 9 10 11 12 13 14 15 16 17 18 19 20 21 22 23 24 25 26 27 28 29 30 31 32 33 34 35 36 37 38 39 40 41 42 43 44 45 46 47 48 49 50 51 52 53 54 55 56 57 58 59
2. Solution of the analytical model: Diffusion coefficient varying in the time
In order to solve (A.1), we consider that the concentration c(x; t) is given as the sum of a transient (u) and of a quasi-stationary (r) components, that is:
x
,
t
u
x
,
t
r
x
,
t
;
0
x
L
,
t
0
(
A
.
7
)
c
The quasi-stationary component will be of the form r(x, t) = A(t) x + B(t) and will take care of the boundary conditions, that is, it has to verify:
0
,
t
c
1
t
t
0
r
L,t J
t t 0 (A.8) x r t D As a consequence, it will be of the following form:
,
x c1
t k1
k2 p
t
x c1
t (A.9) x D t J t x r Since, from the data of the problem, the quasi-stationary component is known, it only remains to find the transient component u, which must solve the following problem, with homogeneous boundary conditions:
,
0
0
.
;
0
0
,
0
)
10
.
(
;
0
0
,
0
,
;
0
0
t
t
L
x
u
t
D
t
t
u
A
L
x
x
r
x
u
t
L
x
t
r
x
u
D
x
t
u
The solution of (A.10) may be given by means of the Sturm-Liouville theory, combined with a Fourier series technique. The eigenvalues of the associated Sturm-Liouville problem, in the spatial variable, are of the form:
1 2 3 4 5 6 7 8 9 10 11 12 13 14 15 16 17 18 19 20 21 22 23 24 25 26 27 28 29 30 31 32 33 34 35 36 37 38 39 40 41 42 43 44 45 46 47 48 49 50 51 52 53 54 55 56 57 58 59 60
The corresponding orthogonal set of eigenfunctions is given by:
(A.12)
Therefore, the transient solution, u, governed by A.10, is given by:
(A.13)
Where the functions are the unique solutions of the following Cauchy type problems:
( ) ( ) 0 2 1 2 2 ) ( t t t r T t D L n t t T n n t a n n
(A.14) ) 0 ( ) 0 ( n n r T And where functions rn stand for Fourier coefficients of the quasi-stationary component
are given by A.9, that is:
With for t≥0 and n=1,2,… (A.15)
(A.16)
Therefore, the solutions of the Cauchy problems (A.14) are given by:
![Figure 6 0 1 2 3 4 150 3000,00,30,61,21,402040400 8000246yw(x=L) x 103 [-] (b)(a) D constant D(t)yeac(x=L, t) x 105 [-]t [s]](https://thumb-eu.123doks.com/thumbv2/123dok_br/19195659.951677/37.892.221.670.105.450/figure-yw-l-d-constant-d-yeac-l.webp)
![Table 2: Properties of the feed solution used in the pervaporation experiments at 40ºC molar fraction, x i [-] γ i [-] p vi x 10 4 [Pa] [27] H i x 10 5 [Pa]](https://thumb-eu.123doks.com/thumbv2/123dok_br/19195659.951677/39.892.119.775.168.340/table-properties-feed-solution-pervaporation-experiments-molar-fraction.webp)