ii
Diogo Manuel Leitão Vinagre Piteira dos Santos
EXPLORING THE INFLUENTIAL FACTORS OF
CONTINUANCE INTENTION TO USE MOBILE APPS:
EXTENDING THE EXPECTATION CONFIRMATION
MODEL
Dissertação apresentada como requisito parcial para a
obtenção do grau de Mestre em Gestão de Informação,
Especialização em Gestão do Conhecimento e Business
Intelligence
ii
NOVA Information Management School
Instituto Superior de Estatística e Gestão de Informação
Universidade Nova de Lisboa
EXPLORING THE INFLUENTIAL FACTORS OF CONTINUANCE
INTENTION TO USE MOBILE APPS:EXTENDING THE EXPECTATION
CONFIRMATION MODEL
por
Diogo Manuel Leitão Vinagre Piteira dos Santos
Dissertação apresentada como requisito parcial para a obtenção do grau de Mestre em Gestão de Informação, Especialização em Gestão do Conhecimento e Business Intelligence
Coorientador: Professor Doutor Tiago Oliveira Coorientador: Professor Doutor Carlos Tam
iii
DEDICATÓRIA
Em primeiro lugar quero dedicar esta dissertação aos meus avós, por todo o apoio dado desde que iniciei o meu percurso académico. Dedico também à minha mãe por ter sido desde sempre um excelente exemplo para mim, tanto na vertente emocional, como na entrega e dedicação ao trabalho, incentivando-me a seguir sempre aplicado nos estudos. Dedico ainda à minha irmã pelo seu apoio incondicional esperando que daqui a dois anos também ela apresente a sua tese de mestrado.
Quero dedicar e agradecer aos meus amigos que presenciaram todos os momentos bons e menos bons, os altos e baixos de todo este processo, muito em especial ao João Santos pela paciência que demonstrou ao ler e reler esta investigação vezes sem conta, mostrando-se sempre disponível para qualquer ajuda.
Por fim, mas não menos importante, quero dedicar este estudo à minha namorada, pelo seu apoio incondicional nestes últimos meses, pela sua compreensão, dedicação, amor, e acima de tudo por nunca ter duvidado e nunca me ter deixado duvidar das minhas próprias capacidades para concluir esta tese.
iv
AGRADECIMENTOS
Agradeço ao Professor Tiago Oliveira por me ter iniciado e acompanhado nesta investigação bem como não podia deixar uma palavra de apreço especial ao Professor Carlos Tam pela sua enorme disponibilidade e colaboração. Agradeço a ambos todas as recomendações e críticas no sentido de procurar incessantemente a excelência tendo sido sendo sem dúvida uma mais-valia na minha aprendizagem.
Agradeço à minha faculdade, NOVA Information Management School, por me oferecer uma formação de elevada qualidade e de me possibilitar todos os recursos n e c e s s á r i o s para desenvolver este estudo.
v
RESUMO
O uso de aplicativos móveis (Apps) tem vindo a crescer no mundo da tecnologia, fenómeno relacionado com o aumento do número de usuários de smartphones. Para o vasto mercado de Apps móveis, poucos estudos foram feitos sobre o que faz com que os indivíduos continuem a usar Apps móveis ou pararem de usá-las. Este estudo tem como objetivo destacar os fatores subjacentes à intenção de continuidade do uso de Apps móveis, abordando dois modelos teóricos: o modelo de confirmação de expectativas (ECM), combinado com a extensão da teoria unificada de aceitação e uso da tecnologia (UTAUT2). Um total de 304 respostas válidas foram recolhidas num questionário online com o intuito de testar o modelo teórico proposto, utilizando a modelagem de equações estruturais (SEM). Os nossos resultados mostraram que satisfação, hábito, expectativa de desempenho e expectativa de esforço, respetivamente, são os fatores mais importantes na intenção de continuar a Apps móveis.
PALAVRA-CHAVES
Aplicações móveis (Apps); continuidade do uso; modelo de confirmação de expectativas (ECM); extensão de aceitação e uso de tecnologia (UTAUT2).
vi
ABSTRACT
The use of mobile applications (Apps) has been growing in the world of technology, a phenomenon related to the increasing number of smartphone users. With a huge mobile Apps market, few studies have been made on what makes individuals continue to use a mobile App or stop using it. This study aims to uncover the factors that underlie the continuance intention to use mobile Apps, addressing two theoretical models: Expectation confirmation model (ECM) and the extended unified theory of acceptance and use of technology (UTAUT2). A total of 304 valid questionnaires were collected by survey to test the theoretical framework proposal, using structural equation modelling (SEM). Our findings indicate that the most important drivers of continuance intention of mobile Apps are respectively; satisfaction, habit, performance expectancy, and effort expectancy.
KEYWORDS
Mobile applications (Apps); continuance usage; expectation confirmation model (ECM); extended unified theory of acceptance and use of technology (UTAUT2).
vii
CONTENTS
1. Introduction ... 1
2.Theoretical framework ... 3
2.1.
Mobile Applications (Apps) ... 3
2.2.
Adoption models ... 5
2.2.1.
Expectation confirmation model (ECM) ... 5
2.2.2.
Extended unified theory of acceptance and use of technology (UTAUT2) .... 6
2.2.3.
Integrated model of ECM with UTAUT2 ... 6
3. Research model and hypotheses ... 7
3.1 Research Model ... 7
4. Research methodology ... 11
4.1. Procedure and participants ... 11
4.2. Measurement of instruments ... 11
5. analysis and results ... 12
5.1 Measurement model ... 12
5.2 Structural model ... 13
6. Discussion ... 15
6.1 Theoretical implications ... 16
6.2. Managerial implications ... 16
6.3. Limitations and future research ... 17
7. Conclusion ... 18
8. References ... 19
viii
CONTENTS OF FIGURES
Figure 1: A post-acceptance model from Bhattacherjee (2001). ... 5
Figure 2: Research model ... 7
Figure 3: Research model ... 14
ix
CONTENTS OF TABLES
Table 1: Some research in mobile Apps. ... 3
Table 2: Descriptive statistics of respondent’s characteristics. ... 11
Table 3: PLS quality criteria and factor loadings. ... 12
Table 4: Means, standard deviations, correlations, and reliability and validity measures (CR,
CA, and AVE) of latent variables. ... 13
x
LIST OF ABBREVIATIONS
Apps ApplicationsAVE Average Variance Extracted
CR Composite Reliability
CFA Confirmatory Factor Analysis
DDD Difference-In-Difference-In-Difference
ECM Expectation-Confirmation Model
ECT Expectation-Confirmation Theory
IS Information System
IT Information Technology
PLS Partial Least Squares
Pi Propensity Score Matching Model
RQ Research Question
SEM Structural Equation Modelling
TAM Technology Acceptance Model
NDs The Normalized Differences
UTAUT Unified Theory Of Acceptance And Use Of Technology
UTAUT2 Extend Unified Theory Of Acceptance And Use Of Technology VSL Customer Value, Satisfaction And Loyalty Framework
1
1. INTRODUCTION
In recent years, the increasing number of smartphone subscribers has driven the usage of mobile application software for mobile devices, commonly referred to as mobile applications (Apps) (Hsu & Lin, 2015). Since the development of smartphones, our everyday lives have largely relied on their various functions (Cho, 2016). According to Gartner (2015) the market demand for mobile Apps development services will grow at least five times faster than internal information technology (IT) organizations' capacity to deliver them. Also in a recent survey 42% of organizations expect to increase spending on mobile Apps development by an average of 31% in 2016 (Gartner, 2016). As reported by Flurry Analytics (2014) in a recent survey, the overall downloads of mobile Apps (in 2013) had reached 115% year-over-year growth in 2013 and the category of ‘‘utilities and productivity Apps” posted 150% year-over-year growth, whereas the value for ‘‘messaging and social Apps” (i.e., social Apps) was up to 203%, the most dramatic growth in Apps in 2013 (Hsiao, Chang, & Tang, 2016).
In order for organizations to better realize the benefits of IT, they must understand the user behaviour, which cannot be successful without a deep understanding of individuals in the way they make use of an emerging technology such as mobile Apps (Xu et al., 2015). While various approaches can be used to encourage user adoption of an innovation, the long-term viability of a new information system (IS) hinges more on users’ continuance behaviour than on their initial adoption decisions (Venkatesh et al., 2011). According to Bhattacherjee (2001a), prior post-adoption research in the IS domain has primarily focused on one post-adoption behaviour, namely, continuance usage. Earlier research posits that the implementation of the continuance intention to use IS is vital to the success amongst companies in the competitive market due to the benefits in the investments of the companies (Bhattacherjee, 2001b). Retaining users has become important for related industries, such as mobile services, and these businesses can benefit from understanding how users develop continuance intention, and then efficiently provide new social Apps to meet users’ needs (Hsiao et al., 2016). For these reasons, we will therefore address the following research question (RQ): What are the key determinants of continuance intention of usage of mobile Apps?
To answer the RQ we developed a research model based on two existing and empirically validated theoretical models, i.e., the expectation-confirmation model (ECM), a theoretical model by Bhattacherjee, (2001b) and the extended unified theory of acceptance and use of technology (UTAUT2) of Venkatesh, Thong, & Xu (2012).This work will help companies and people who are developing IT related to mobile Apps realize what the most important factors are that will lead the end-users to continuously use them or, in other words, what the expectations and fears are about using mobile Apps. Our contribution is threefold. Firstly, while the majority of earlier IS investigations are heavily focused on initial acceptance, this study seeks to understand the concept of mobile Apps’ continuous intention, which is vital to the long-term viability of an IS (Bhattacherjee, 2001b). Secondly, to the best of our knowledge, few studies have addressed the continuance intention to use mobile Apps. Thirdly, we develop an innovative framework that brings together two very well established models ECM and UTAUT2, complementing each other, with their union of predictors. Our aim is to prove that the model is valid and can be used for a better analysis and understanding of what the key factors are of an individual’s continuance intention to use mobile Apps.
2 The next section presents the mobile Apps concept and a brief description of the two theoretical models adopted in this study. Afterwards, the research models, with their statistical hypotheses, are presented along with the methodology used. At the end, results will be presented and discussed, followed by conclusions drawn from this study.
3
2.THEORETICAL FRAMEWORK
2.1.
M
OBILEA
PPLICATIONS(A
PPS)
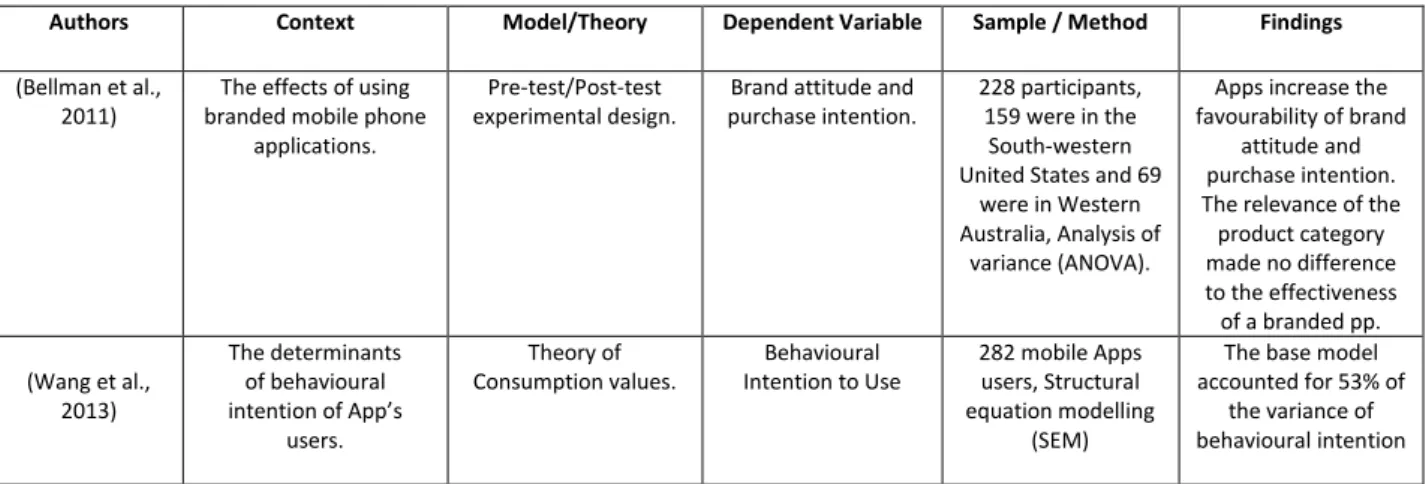
Originally ‘‘Mobile Apps’’ referred to software for general productivity and information retrieval purposes, including e-mail, calendar and contact management, stock market quotes and weather information. However, a huge surge in user demand and the widespread availability of developer tools has driven a rapid expansion to include other categories of mobile Apps including games, e-Books, utilities, social networking platforms, and others providing access to information on business, finance, lifestyle and entertainment (Hsu & Lin, 2015). The popularity and tremendous growth of smartphone usage has facilitated the research on the extensive adoption of new mobile Apps (Hsiao et al., 2016). Several models have been proposed in earlier research to study the distinct nature of mobile Apps (see Table 1). Taking that into account, we aim to clarify the user’s behaviour in relation to mobile Apps, analysing a few different examples of approaches of what has been done in the research of mobile Apps. Bellman et al., (2011) investigated the effects of using branded mobile phone applications with the Pre-test/Post-test experimental design. Shortly after, Wang et al., (2013) investigated the determinants of individual’s behaviour toward mobile Apps, making use of the theory of consumption values. In Song et al., (2014) the user’s satisfaction is addressed, based on mobile-applications’ store, applying an environmental psychology perspective using discoverability facilitators. Kang (2014) predicted the intention of mobile-applications’ use, applying an extended unified theory of acceptance and use of technology (UTAUT). Kim, Wang, & Malthouse (2015) studied the effects of adopting and using a brand's mobile App on subsequent purchases, using the difference-in-difference-in-difference (DDD) model. Approaching a cultural perspective, Hoehle & Venkatesh (2015) addressed the continuance intention to use social media mobile Apps. Recently Hsiao et al. (2016) explored the factors influencing consumers’ satisfaction levels regarding social Apps and their continuance intention, this being a similar study to our research as it focuses on social mobile Apps. Harris et al. (2016) explored the factors that influenced a consumer before installing a mobile App (using perceived risk, trust, perceived benefit, and intent to install).
Table 1: Some research in mobile Apps.
Authors Context Model/Theory Dependent Variable Sample / Method Findings
(Bellman et al., 2011)
The effects of using branded mobile phone
applications.
Pre-test/Post-test experimental design.
Brand attitude and purchase intention.
228 participants, 159 were in the
South-western United States and 69
were in Western Australia, Analysis of
variance (ANOVA).
Apps increase the favourability of brand
attitude and purchase intention. The relevance of the product category made no difference to the effectiveness of a branded pp. (Wang et al., 2013) The determinants of behavioural intention of App’s users. Theory of Consumption values. Behavioural Intention to Use 282 mobile Apps users, Structural equation modelling (SEM)
The base model accounted for 53% of
the variance of behavioural intention
4
(Kang, 2014) Predict use intention of mobile Apps.
Extended unified theory of acceptance and use of technology
(UTAUT)
Continuance intention
788 users of Apps, SEM
The analysis found that only gender
moderated the relationship between
effort expectancy and continuance intention, implying
that women were more likely than men
to prefer ease of use for continuance
intention. (Song et al.,
2014)
The satisfaction of uses in mobile Apps store.
An environmental psychology perspective, using
discoverability facilitators.
User satisfaction 278 respondents, 155 respondents were in U.S. and 123 respondents were in South Korea, Partial least squares (PLS). Model explains 49.2% of the variance in the user satisfaction for application discoverability. (Kim et al., 2015)
The effects of adopting and using a brand's
mobile Apps on subsequent purchases. Difference-in- difference-in-difference (DDD) model Effects of App Adoption 10,76 users of Apps and 5,127 non-users of Apps, the propensity score matching model(Pi), the normalized differences (NDs) Younger customers are more likely to
adopt than older customers, and the oldest customers are
the least likely to adopt. Males are more likely to adopt
than females. (Xu et al., 2015) Interpersonal
recommendation to promote mobile Apps.
Customer Value, Satisfaction and Loyalty Framework (VSL) Intention to recommend 347 questionnaires to college students in the southwestern U.S., PLS
The model explained 44% of variance in recommendation and 34% of variance in intention to recommend. (Hsu & Lin,
2015)
Purchase intention for paid mobile Apps.
Extending the expectation confirmation model (ECM) User intention to purchase 507 responses, Taiwan, SEM.
The user’s intention to purchase is determined by
value-for-money, satisfaction, and the
availability of free alternatives, while that of potential users is determined by value-for-money, social value, App ratings, and free alternatives (Hoehle &
Venkatesh, 2015)
The continued intention to use social
media mobile Apps explained by a cultural
perspective to understand.
Using five Hofstede’s cultural values along with mobile Apps usability
Continue intention to use 1,844 respondents of U.S., Germany, China, and India, PLS. The results explained 38% of variance in continued intention to use (Hsiao et al., 2016) Investigating key determinants of users’ continuance intention regarding social Apps. Satisfaction, Continuance intention, Habit, and Customer
value perspectives,
Continuance intention
407 questionnaires to college students from Taiwan, SEM and confirmatory factor analysis (CFA)
The model explained variance of satisfaction, habit, and continuance intention accounted for 70%, 67%, and 71%, respectively. (Harris, Brookshire, & Chin, 2016)
Explore the factors that influence a consumer
before installing a mobile App.
Perceived risk, trust, Perceived benefit, and
Intent to install and seven antecedents of
trust and risk
Intention to Install 128 students, USA, PLS
Model explains 50.5% of the variance
in the intention to install an App.
5 We conclude that there are many different subjects and ways to approach the study of mobile Apps, using diverse theories. However, few theories explore the issue of mobile Apps using ECM, to the best of our knowledge. One of the aims of this research is to explore this gap, making use of expectation-confirmation theory (ECT) applied to mobile Apps.
2.2. A
DOPTION MODELS2.2.1. Expectation confirmation model (ECM)
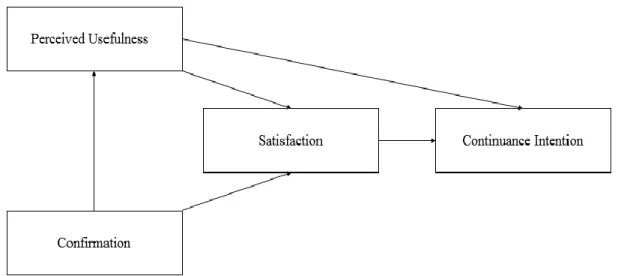
Recently, to study the post-acceptance behaviour at the individual level, the ECM has been adopted by several IS researchers (e.g. Bhattacherjee (2001b); Lin, C. S., Wu, S., & Tsai (2005); Thong, Hong, & Tam (2006); Lee (2010) ). The ECM emerged from an adaptation of ECT. The ECT claims that expectations, along with perceived performance, lead to post-purchase satisfaction. This effect can be measured by negative or positive dissonance between performance and performance (Oliver, 1980). Bhattacherjee (2001b) adapted it to ECM in order to predict IS continuance usage.This model is supported by three variables to predict and explain the individual’s continuous intention of IT usage: satisfaction, confirmation of expectations, and perceived usefulness. In Figure 1 (the ECM) the two primary variables to determine IS continuance intentions are confirmation and perceived usefulness, determined by the consumer’s initial expectations. Both influence user’s satisfaction. The satisfaction and perceived usefulness forecast the individual’s continuance intention of IS.
Figure 1: A post-acceptance model from Bhattacherjee (2001).
In the IT products and services context, several investigations have been made addressing different types of models in order to deepen the concept of post acceptance and examine the behaviour of individuals. In order to investigate continuance use of IS a few recent studies have been produced with themes similar to our research addressing this issue, mobile Apps. The most recent are: Hsu & Lin, 2015, Xu et al., 2015 and Hsiao et al., 2016, who proposed that their frameworks incorporate ECM.
6 This same model is an integral part of the structure of this research, and is used in order to address one of its main objectives, the behaviour of individuals after they haveused mobile Apps. Our study extends the ECM in an innovative way in order to better understand the mobile Apps post-adoption phenomena.
2.2.2. Extended unified theory of acceptance and use of technology (UTAUT2)
To explain users’ intentions of using an IS and subsequent usage behaviour of technology in organizational contexts, Venkatesh et al. (2003) developed the UTAUT. This model is a representation of synthesis of eight distinct theoretical models taken from sociological and psychological theories utilized in the literature to explain that behaviour (Venkatesh et al. 2003). The UTAUT, in order to influence behavioural intention to use a technology and usage behaviours, is supported by four main constructs: performance expectancy, social influence, effort expectancy, and facilitating conditions. These constructs are focused on the influence of behavioural of intention to use a technology. The behavioural intention and facilitating conditions determine technology use. The gender, age, voluntariness, and experience are considered as the moderators of the four constructs in the UTAUT model to explain differences between individuals.
Later, Venkatesh et al. (2012) developed UTAUT2, extending and adapting the theory to the consumer context. Three new constructs (hedonic motivation, price value, and habit) were added to the original UTAUT model. In that research it was demonstrated that the extension of UTAUT, compared with the original model, produced a substantial improvement in the explained variation of behavioural intention and variation of the use behaviour.
2.2.3. Integrated model of ECM with UTAUT2
Our main model is based on Bhattacherjee (2001b), who showed that an ECM extension model gives a better contribution to IT use in order to address the weaknesses of the original model. As seen above in this literature review, some studies have made their research based on ECM extensions. However, to the best of our knowledge, no investigation has used the same constructs and the same theories that we set together with UTAUT2. We selected the constructs from the UTAUT2 of Venkatesh et al. (2012), a relatively recent model that focuses mainly on behavioural intention and use, which we suggested can give greater explanatory power to the essential constructs of our main model, performance expectation and continuance intention of mobile usage. Taking these into account and based on the suggestions of Venkatesh et al. (2012) and Bhattacherjee (2001b), their models should be applied to different technologies or attempt to identify other relevant factors to extend. For these reasons, we propose to combine the ECM with the UTUAT2 to gain a better understanding of mobile Apps continuance intention.
7
3. RESEARCH MODEL AND HYPOTHESES
3.1
R
ESEARCHM
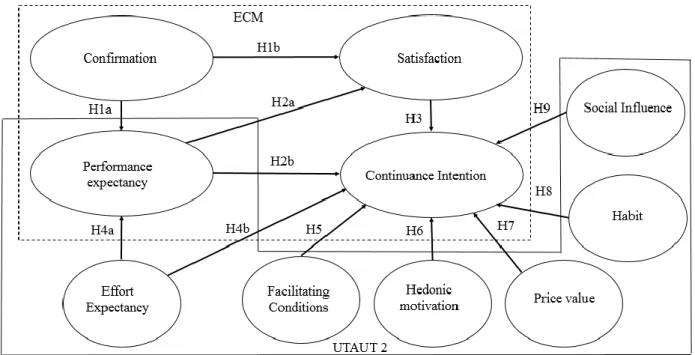
ODELThe ECM is the basis of the entire process, measuring the level of satisfaction and expectations of individuals, but we feel that adding some predictors to this model will be a critical point and should be explored in greater detail in order to achieve a better understanding of continuance intention of usage of mobile Apps. Thus, we propose to incorporate the seven constructs of UTUAT2, which are significant direct determinants of intention of use and reachsubstantial improvements in the explained variation in behavioural intent and in the use of technology (Venkatesh et al., 2011). We propose a holistic research model extending the ECM and combining it with UTUAT2. A theoretical model is presented to examine the continuance intention applied to end users using Apps. This model is shown in Figure 2 and the corresponding hypotheses are discussed in this section.
Figure 2: Research model
The confirmation of expectations is defined as users anticipating benefits through their experiences with the IT (Lee, 2010). The ECM posits that the users’ confirmation of expectations will have a positive effect on the perceived usefulness, also known as performance expectancy of IT, and also confirmation is positively related to satisfaction with IS use because it implies realization of the expected benefits of IS use (Bhattacherjee, 2001b). Moreover, IT users’ confirmation of expectations suggests that the users obtained expected benefits through their IT usage, thereby leading to a positive effect on users’ satisfaction and perceived usefulness (performance expectancy) with IT. Adapted to mobile Apps, a user who confirms the previous expectation by using it can quickly realize all its benefits. Thus, user satisfaction with mobile Apps depends on the confirmation that the use of them is closer to their actual experience. Therefore, we posit the following:
H1a. Confirmation is positively associated with the performance expectancy of mobile Apps. H1b. Confirmation is positively associated with the satisfaction with mobile Apps.
8 Performance expectancy is defined as “the extent to which a person believes that a system enhances his or her performance” (Chiu & Wang, 2008). This is a similar concept to perceived usefulness and relative advantage (Alwahaishi & Snásel, 2013). According to Bhattacherjee (2001b), user satisfaction was determined by confirmation of expectations from prior use and perceived usefulness (performance expectancy). Adapted to our study, if the mobile Apps user feels that using a mobile App is useful, hewill get more satisfaction from its use. On the other hand, the construct performance expectancy, in terms of utility, has consistently been shown to be the strongest predictor of behavioural intention (Venkatesh et al., 2003). Adapting it to our research suggests that mobile Apps users will continue to use them if they believe mobile Apps will have a positive outcome. Therefore, we posit the following:
H2a. Performance expectancy is positively associated with the satisfaction with mobile Apps.
H2b. Performance expectancy is positively associated with the continuance intention of usage of
mobile Apps.
Satisfaction “an ex-post evaluation of consumers’ initial (trial) experience with the service, and is captured as a positive feeling (satisfaction), indifference, or negative feeling (dissatisfaction)”. (Bhattacherjee, 2001a). The ECM supports that satisfaction with a product or service is the primary motivation for its continuance (Oliver, 1980). Bhattacherjee (2001b) demonstrated that the direct relationship between satisfaction and continuance intention is at the core of the IS continuance model, and is validated empirically. Also, Bhattacherjee (2001b) argued that users with higher levels of satisfaction, have stronger intentions to use. Adapted to our research, if mobile Apps users are satisfied with them, they tend to continue to use them. Therefore, we posit the following:
H3. Satisfaction is positively associated with the continuance intention of usage of mobile Apps.
Effort expectancy is “the extent to which a learner believes that using a system is free of effort” (Chiu & Wang, 2008). According to Saadé & Bahli (2005) effort expectancy (similar to perceived ease of use in technology acceptance model (TAM)) positively affects performance expectancy. Adapted from Davis (1989) to our research, when users believe that a mobile Apps is useful, at the same time they may also believe that the mobile App is difficult to use, and that the benefits of using it are offset by the effort of using the mobile App. Earlier research has indicated that the more complex an innovation, the lower its rate of adoption or intention to use it again, especially among consumers (e.g. Venkatesh & Brown (2001); Brown & Venkatesh (2005) ). On the other hand, Venkatesh et al. (2003) indicated that effort expectancy has a positive influence on continuance intention, in addition to its indirect effect via attitude. Adapted to our context, the less effort associated with using mobile Apps, the greater the user preference for continuing to use it. Therefore, we posit the following:
H4a. Effort expectancy is positively associated with the performance expectancy of mobile Apps. H4b. Effort expectancy is positively associated with the continuance intention of usage of mobile Apps.
Facilitating conditions “is the degree to which an individual believes that organizational and technical infrastructure exist to support use of the IS” (Venkatesh et al., 2003). According to Venkatesh et al. (2012) a consumer who has access to a favourable set of facilitating conditions is more likely to have a greater intention to use a technology. Facilitating conditions is a construct that reflects an individual’s perceptions about his or her control over a behaviour (Venkatesh, Brown, Maruping, & Bala, 2008). Adapted to mobile Apps users, the more facilitation conditions associated with using the mobile App, the more a user will continue to use them. Therefore, we posit the following:
9
H5. Facilitating conditions is positively associated with the continuance intention of usage of mobile
Apps.
Hedonic motivation is the fun or pleasure resulting from using a technology and expresses an important role in contributing to technology acceptance and use (Brown & Venkatesh, 2005). People with utilitarian motivation focus primarily on instrumental value, whereas people with hedonic motivation pay more attention to pleasure, fun, and playfulness (Chang, Liu, & Chen, 2014). Hedonic motivation is a critical determinant of behavioural intention and was found to be a more important driver than performance expectancy in non-organizational contexts (Venkatesh et al., 2012). Davis et al., (1992) found perceived enjoyment (similar to hedonic motivation) to be the key determinant of behavioural intention to use PC. Adapted to our research, the increased entertainment that mobile Apps provide to users, leads users to continue using and enjoying them. Therefore, we posit the following:
H6. Hedonic motivation is positively associated with the continuance intention of usage of mobile
Apps.
Price “is the financial cost required to obtain and use a product” (Xu et al., 2015). On the other hand, value “is an abstract concept with meanings that vary according to context” (Chiu et al., 2005). Confirmed by Porter (1980), if a free alternative offering is available, users will typically choose the free substitute rather than the paid version. Venkatesh et al., (2012) mention that the cost and pricing structure may have a significant impact on consumers’ technology use. In the mobile Apps market users not only have many choices of mobile Apps with similar functions but most of them are also free, which lessens the user’s drive to make a purchase for a mobile apps with similar functions even though the paid version may offer a better quality function (Hsu & Lin, 2015). For these reasons we propose to connect price value to continuance intention, since the cost associated with a mobile App may have a significant impact on consumers’ technology use. Therefore, we posit the following:
H7. Price value of a mobile App is positively associated with the continuance intention of usage of
mobile Apps.
Habit “is the extent to which people tend to perform behaviours (use IS) automatically because of learning” (Limayem et al., 2007). Users with prior experience in IS usage typically form habits which then promote the continuation of the same type of behaviour (Gefen, 2003). Rather than initial acceptance, the construct habit has been shown to be a critical factor in predicting technology use (e.g., S. S. Kim & Malhotra, (2005); Kim et al., (2005); Limayem et al., (2007) ). According to Barnes (2011) continuance intention can be predicted by the extent to which a behaviour has become automatic because of prior learning, habit. In our case, the habits of using mobile Apps will encourage the intention of continuing to use the same mobile Apps, as individuals tend to perform automatic behaviours. Therefore, we posit the following:
H8. Habit is positively associated with the continuance intention of usage of mobile Apps.
Social influence “is the degree to which an individual considers important how others believe he or she should use a technology” (Chiu & Wang, 2008). In other words, it reflects the extent to which an individual’s attitudes, beliefs, and behaviours are influenced by referent others (Wang, Y., Meister, D. B., & Gray, 2013). Social influence has been shown to have a direct influence on behavioural intention
10 (e.g. Venkatesh & Morris (2000); Venkatesh, Morris, & Ackerman(2000) ). Earlier research such as Shen et al. (2011) or Zhou & Li (2014) discovered that social influence affects the desire and has a significant effect on continuance usage. In the context of this research, the greater the social influence of a mobile App, the greater the continuity of use by its users. Therefore, we posit the following:
11
4. RESEARCH METHODOLOGY
4.1.
P
ROCEDURE AND PARTICIPANTSOur study investigates the attitudes of individuals in relation to mobile Apps. An online survey was developed because it apparently is the quickest and most effective way to get opinions on this subject, immediately excluding those without Internet access. The questionnaire was created with the objective of answering the hypotheses generated in the proposed theoretical framework (Fig 2). A pilot survey was conducted to ensure the validity and reliability of the measures, as well as a more logical arrangement of questions. Data from the pilot survey were not included in the final questionnaire.
The data were collected from people who are studying and/or are somehow linked to academia. Emails were sent to students and alumni of a university in Lisbon, Portugal in May 2016.
4.2.
M
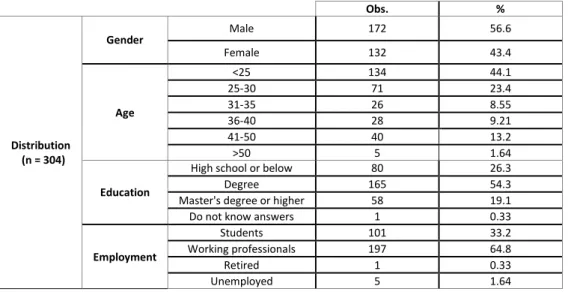
EASUREMENT OF INSTRUMENTSBased on the fact that studies of technology continuance intention have traditionally been conducted using survey research (Roca, Chiu, & Martínez, 2006), an on-line survey was developed in two versions, English and Portuguese. Grounded on the literature and assumptions of the model in Figure 1, the survey was posted online through a free Web hosting service. The items and scales for the constructs were adapted from Venkatesh et al. (2012), Bhattacherjee (2001b), and Vila & Kuster (2011). Each item was measured with a seven-point Likert scale, ranging from ‘‘strongly disagree’’ (1) to ‘‘strongly agree’’ (7) (Appendix A). At the end of June 2016, after two months, a total of 304 valid answers had been collected. Briefly, approximately 57% of respondents were men, 44% aged lower than 25 years old, and 54% had a Bachelor’s degree. Detailed descriptive statistics on the respondents’ characteristics are shown in Table 2.
Table 2: Descriptive statistics of respondent’s characteristics.
Obs. % Distribution (n = 304) Gender Male 172 56.6 Female 132 43.4 Age <25 134 44.1 25-30 71 23.4 31-35 26 8.55 36-40 28 9.21 41-50 40 13.2 >50 5 1.64 Education
High school or below 80 26.3
Degree 165 54.3
Master's degree or higher 58 19.1 Do not know answers 1 0.33
Employment
Students 101 33.2
Working professionals 197 64.8
Retired 1 0.33
12
5. ANALYSIS AND RESULTS
The data analysis was carried out using structural equation modelling (SEM). In accordance with Chin et al. (2003) the models were estimated with partial least squares (PLS), which has been widely selected as a tool in the IS/IT field. The dimension of the sample is more than 10 times greater than the maximum number of paths directed to a construct (Gefen & Straub, 2005) and therefore the PLS can be considered adequate for estimation. Since the sample in our study met the necessary conditions for using PLS, the estimation and data manipulation were performed using SmartPLS (Ringle, et al., 2015). The theoretical research model was tested using variance-based techniques, i.e., PLS, with Smart PLS 2.0 M3 software to analyse the relationships defined by the theoretical model.
5.1
M
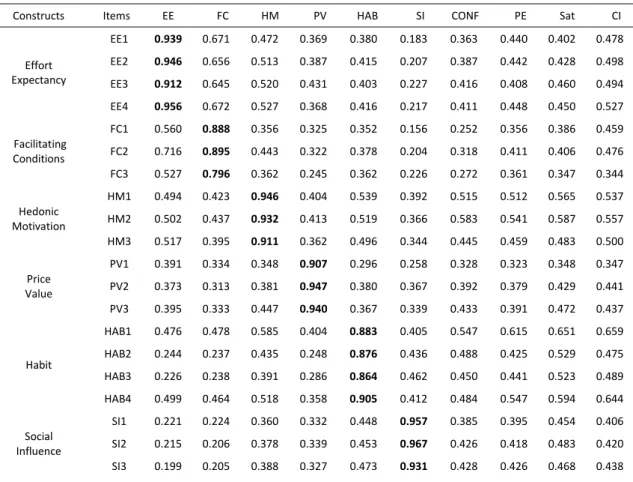
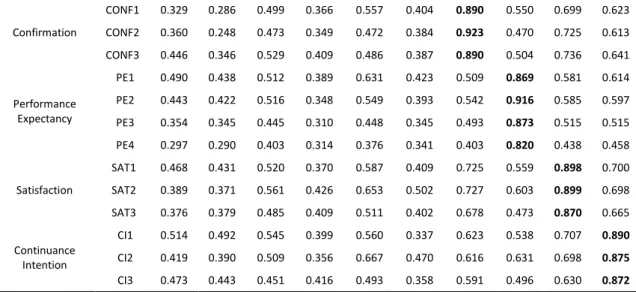
EASUREMENT MODELIn order to obtain a properly validated model, the following measures were used: construct reliability, indicator reliability, convergence validity, and discriminant validity. These can be observed in Tables 3 and 4, as well as their calculations in relation to the constructs used. The indicator reliability was evaluated based on the criterion that the loadings are above 0.7 and every loading less than 0.4 should be eliminated (Henseler, et al., 2009). For these reasons, the FC4 item was excluded due to its low loading and lack of statistical significance, and the model was recalculated without it. Table 3 shows the results detailing the factor loadings for all items. All items were higher than 0.7, suggesting that the constructs are reliable as recommended.
Table 3: PLS quality criteria and factor loadings.
Constructs Items EE FC HM PV HAB SI CONF PE Sat CI
Effort Expectancy EE1 0.939 0.671 0.472 0.369 0.380 0.183 0.363 0.440 0.402 0.478 EE2 0.946 0.656 0.513 0.387 0.415 0.207 0.387 0.442 0.428 0.498 EE3 0.912 0.645 0.520 0.431 0.403 0.227 0.416 0.408 0.460 0.494 EE4 0.956 0.672 0.527 0.368 0.416 0.217 0.411 0.448 0.450 0.527 Facilitating Conditions FC1 0.560 0.888 0.356 0.325 0.352 0.156 0.252 0.356 0.386 0.459 FC2 0.716 0.895 0.443 0.322 0.378 0.204 0.318 0.411 0.406 0.476 FC3 0.527 0.796 0.362 0.245 0.362 0.226 0.272 0.361 0.347 0.344 Hedonic Motivation HM1 0.494 0.423 0.946 0.404 0.539 0.392 0.515 0.512 0.565 0.537 HM2 0.502 0.437 0.932 0.413 0.519 0.366 0.583 0.541 0.587 0.557 HM3 0.517 0.395 0.911 0.362 0.496 0.344 0.445 0.459 0.483 0.500 Price Value PV1 0.391 0.334 0.348 0.907 0.296 0.258 0.328 0.323 0.348 0.347 PV2 0.373 0.313 0.381 0.947 0.380 0.367 0.392 0.379 0.429 0.441 PV3 0.395 0.333 0.447 0.940 0.367 0.339 0.433 0.391 0.472 0.437 Habit HAB1 0.476 0.478 0.585 0.404 0.883 0.405 0.547 0.615 0.651 0.659 HAB2 0.244 0.237 0.435 0.248 0.876 0.436 0.488 0.425 0.529 0.475 HAB3 0.226 0.238 0.391 0.286 0.864 0.462 0.450 0.441 0.523 0.489 HAB4 0.499 0.464 0.518 0.358 0.905 0.412 0.484 0.547 0.594 0.644 Social Influence SI1 0.221 0.224 0.360 0.332 0.448 0.957 0.385 0.395 0.454 0.406 SI2 0.215 0.206 0.378 0.339 0.453 0.967 0.426 0.418 0.483 0.420 SI3 0.199 0.205 0.388 0.327 0.473 0.931 0.428 0.426 0.468 0.438
13 Confirmation CONF1 0.329 0.286 0.499 0.366 0.557 0.404 0.890 0.550 0.699 0.623 CONF2 0.360 0.248 0.473 0.349 0.472 0.384 0.923 0.470 0.725 0.613 CONF3 0.446 0.346 0.529 0.409 0.486 0.387 0.890 0.504 0.736 0.641 Performance Expectancy PE1 0.490 0.438 0.512 0.389 0.631 0.423 0.509 0.869 0.581 0.614 PE2 0.443 0.422 0.516 0.348 0.549 0.393 0.542 0.916 0.585 0.597 PE3 0.354 0.345 0.445 0.310 0.448 0.345 0.493 0.873 0.515 0.515 PE4 0.297 0.290 0.403 0.314 0.376 0.341 0.403 0.820 0.438 0.458 Satisfaction SAT1 0.468 0.431 0.520 0.370 0.587 0.409 0.725 0.559 0.898 0.700 SAT2 0.389 0.371 0.561 0.426 0.653 0.502 0.727 0.603 0.899 0.698 SAT3 0.376 0.379 0.485 0.409 0.511 0.402 0.678 0.473 0.870 0.665 Continuance Intention CI1 0.514 0.492 0.545 0.399 0.560 0.337 0.623 0.538 0.707 0.890 CI2 0.419 0.390 0.509 0.356 0.667 0.470 0.616 0.631 0.698 0.875 CI3 0.473 0.443 0.451 0.416 0.493 0.358 0.591 0.496 0.630 0.872
Contribution of each loading to its assigned construct (in bold).
As shown in Table 4, all the constructs have an adequate composite reliability (CR) of 0.7 or greater. The average variance extracted (AVE) was used to test convergent validity for each construct and should be higher than 0.5, meaning that the latent variables explain more than half of the variance of their indicators (F. Hair Jr et al. 2014; Henseler et al. 2009). In our research the AVE is above the expected threshold of 0.5, ensuring convergence. The square roots of AVEs (diagonal elements in bold) are greater than the correlation between each pair of constructs (off-diagonal elements) (Fornell & Larcker, 1981), which is a good indicator to ensure discriminant validity, since the loadings are also larger than cross loadings (Chin, 1998; Hair, et al., 2014). For these reasons, all the 10 constructs of our model are statistically distinct results and can be used to test the structural model. It was demonstrated by the measurement model that the model has good internal consistency, indicator reliability, convergent validity, and discriminant validity.
Table 4: Means, standard deviations, correlations, and reliability and validity measures (CR, CA, and
AVE) of latent variables.
AVE STDEV CR CA EE FC HM PV HAB SI CONF PE Sat CI EE 5.521 1.182 0.967 0.955 0.938 FC 4.781 1.414 0.895 0.825 0.704 0.86 HM 3.748 1.551 0.95 0.922 0.542 0.451 0.93 PV 5.242 1.203 0.952 0.924 0.414 0.349 0.423 0.932 HAB 4.213 1.536 0.934 0.907 0.43 0.421 0.557 0.377 0.882 SI 4.975 1.201 0.966 0.948 0.222 0.223 0.395 0.35 0.482 0.951 CONF 5.962 1.04 0.928 0.884 0.42 0.326 0.556 0.416 0.561 0.435 0.901 PE 4.827 1.158 0.926 0.893 0.463 0.436 0.543 0.393 0.587 0.435 0.564 0.87 Sat 5.496 1.191 0.919 0.867 0.463 0.443 0.588 0.452 0.658 0.493 0.799 0.615 0.889 CI 5.925 1.006 0.911 0.853 0.533 0.502 0.572 0.442 0.656 0.444 0.695 0.634 0.774 0.879
5.2
S
TRUCTURAL MODELThe next step after establishing an adequate measurement model was to analyse the structural model for the hypothesis testing. We assess the hypotheses and constructs’ relationships based
14 on the examination of standardized path. Figure 3 is shows the path coefficients and r-squares of our proposed model. The path coefficients were calculated from t-statistics and derived from the bootstrapping resampling method with 5,000 iterations (Henseler et al., 2009).
Note: (*p<0.10;**p<0.05; ***p<0.01) Figure 3: Research model
The model explains 38% of the variation in performance expectancy. The confirmation (β̂ = 0.448, p<0.01) and effort expectancy (β̂ = 0.275; p<0.01) are statistically significant in explaining performance expectancy, thus confirming H1a and H4a.
The model explains 67.8% of the variation in satisfaction. The confirmation (β̂ = 0.664, p<0.01) and performance expectancy (β̂ = 0.241; p<0.01) are statistically significant in explaining satisfaction, thus confirming H1b and H2a.
The model explains 68% of the variation in continuance intention. The performance expectancy (β̂ = 0.144, p<0.01), satisfaction (β̂ = 0.466, p<0.01), effort expectancy (β̂ = 0.104; p<0.10), and habit (β̂ = 0.157; p<0.01) are statistically significant in explaning the continuance intention, thus confirming H2b, H3, H4b, and H8. The facilitating conditions, hedonic motivation, price value, and social influence are not statistically significant, and consequently H5, H6, H7, and H9 are not confirmed.
The majority of the hypotheses from the combination of ECM and UTAUT2 model (8 out of 12 hypotheses) were supported by the model.
15
6. DISCUSSION
The proposed model demonstrates a good fit and most of the relationships are supported. Figure 4, the original ECM model is shown, calculated in the context of this research without the additional constructs that we proposed. It can be concluded that the inclusion of new constructs added more value to complement and further explore the original model, as revealed in the higher values of variation explained in performance expectancy and continuance intention. The performance expectancy, satisfaction, effort expectancy, and habit added more value to the proposed model and it is noticeable that it has more explanatory power to continuance intention than does the original ECM.
Note: (*p<0.10;**p<0.05; ***p<0.01) Figure 4: Original ECM model
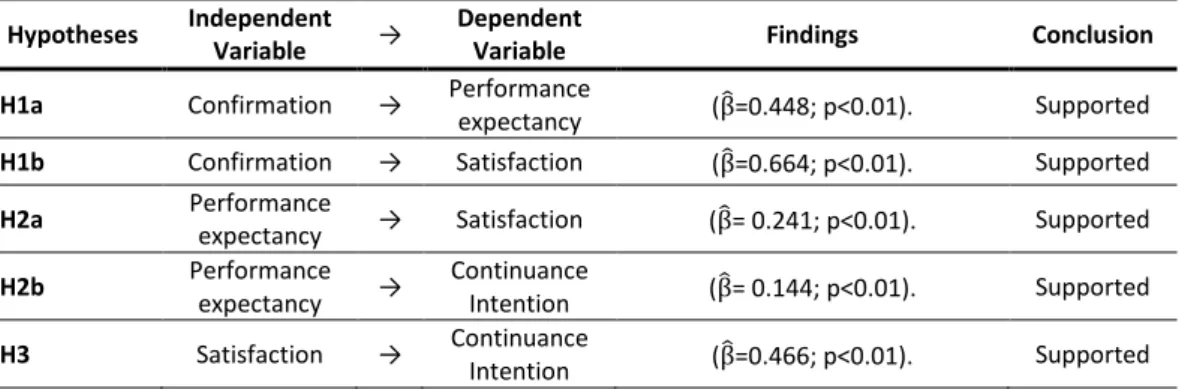
However, some constructs added were not significant predictors in continuance intention. The results of our survey suggest that our respondents are incorporating the smartphone into their daily routines. Thus, having the ideal conditions for the use of mobile Apps, they give no importance to the facilitating conditions. Social influence was also given little importance to continuance intention to use mobile Apps. These results are similar to those of Chiu & Wang (2008). Contradicting the Li et al. (2015), the hedonic motivation was found to have a non-significant relationship with continuance intention, indicating that users may not care about amusements as much as expected. In addition, price value was not found to be important in our proposed model, perhaps because most of the Apps on the market are free or reduced in price. Table 6 summarizes the results of hypotheses tests.
Table 5: Hypotheses conclusions
Hypotheses Independent
Variable →
Dependent
Variable Findings Conclusion
H1a Confirmation → Performance
expectancy (β̂=0.448; p<0.01). Supported
H1b Confirmation → Satisfaction (β̂=0.664; p<0.01). Supported
H2a Performance
expectancy → Satisfaction (β̂= 0.241; p<0.01). Supported
H2b Performance expectancy → Continuance Intention (β̂= 0.144; p<0.01). Supported H3 Satisfaction → Continuance Intention (β̂=0.466; p<0.01). Supported
16 H4a Effort Expectancy → Performance expectancy (β̂=0.275; p<0.01). Supported H4b Effort Expectancy → Continuance Intention (β̂=-0.104; p<0.01). Supported H5 Facilitating Conditions → Continuance Intention Non-significant. Not Supported H6 Hedonic Motivation → Continuance Intention Non-significant. Not Supported H7 Price Value → Continuance Intention Non-significant. Not Supported H8 Habit → Continuance Intention (β̂=0.157; p<0.01). Supported H9 Social Influence → Continuance Intention Non-significant. Not Supported
6.1
T
HEORETICAL IMPLICATIONSThe theoretical implications of this work can be described in three points. First, the fundamental contribution of this research is the combination of ECM with UTAUT2. Regarding the ECM, we extended it adapting the UTAUT2 constructs, in order to identify antecedents that focus on user satisfaction and continuance use. Theoretically, our results suggest that the new constructs added to our proposed model, increasing the predictive power in explaining continuance intention.Second, our proposed model was applied in the context of mobile Apps, addressing the concept of continuance intention. Few studies have addressed this concept, to the best of our knowledge. Our study differs from others because it can be adapted to the different types of mobile Apps and their environment. In other words, recent research in mobile Apps are more focused on specific Apps or strands associated with them (e.g. Hsiao et al. (2016) with social Apps; Hoehle et al,. (2015) with cultural perspectives; Hsu & Lin, (2015) with purchase intention).Third, in the context of mobile Apps, perceived usefulness and especially satisfaction are the keys of ECM.Even so, with the combination of proposed models, ECM and UTAUT2, this research demonstrates that there are others important constructs to take into consideration while approaching continuance intention, namely effort expectancy and habit.
6.2.
M
ANAGERIAL IMPLICATIONSThe results contribute to new insights about the continuance intention of mobile Apps by individuals. First, it was demonstrated that all the constructs of ECM plus effort expectancy and habit are important in explaining continuance intention. These findings may provide some direction for companies and developers of mobile Apps to encourage user’s continuance intention with them. For example, effort expectancy and habit were found to be the two predictors of UTAUT2 that influence continuance intention. This suggests that companies and developers should create/update mobile Apps to make them easy and intuitive to use. In other words, mobile Apps should not require much effort and adaptation from its users, enabling them to learn how to use the mobile Apps faster and eventually create usage habit.
Second, companies should be concerned about performance expectancy and users' satisfaction with mobile Apps, since they are the key for ECM to determine continuance intention, in compliance with Stone & Baker-Eveleth (2013). Service providers should offer solutions which indicate that there are
17 possible benefits associated with mobile Apps that could positively influence customers’ sense of satisfaction and their willingness to continue to use that service. Third, social influence and facilitating conditions had no relevance to explain the continuance intention to use mobile Apps. Nevertheless, social influence and facilitating conditions might influence service provides to design strategies to deal with the problem of social pressure and ease of installation for potential adopters of mobile Apps. Earlier studies in technology acceptance demonstrate that these constructs are important (e.g. Kulviwat, Bruner II, & Al-Shuridah (2009) with social influence and Zhou, Lu, & Wang (2010) with facilitating conditions ). Thus, some constructs that were important in IS adoption may not be relevant for continuance intention. Fourth, the hedonic motivation related to mobile Apps (e.g. games) was shown to be not relevant for continuance intention to use, contradicting earlier studies (e.g. Li et al. (2015)). This particular type of mobile App is emerging in the marketplace, so companies should seek to create some kind of loyalty from their users and constantly adapt the mobile Apps to their expectations. Fifth, the price value was also revealed to be not important to continuance intention to use mobile Apps. The service providers related to mobile Apps should realize that the users tend to opt for products that are free or inexpensive (Hsu & Lin,2015).
6.3.
L
IMITATIONS AND FUTURE RESEARCHSome limitations can be pointed in our research. Starting with our sample: it represents a highly educated population and relatively young/adults, in a country (Portugal), with a high rate of diffusion of smartphones. Future research may test our proposed model in different countries and regions, with users less familiar with the use of mobile Apps and with different ages and levels of education. Taking advantage of the fact that our sample is almost equally distributed by gender, an approach to a future research might be studying the differences between genders.
This research is related to only one type of technology (mobile Apps). To enhance generalization, a comparison with other types of technology is welcome.
Another possible methodology for a future study can be adding other constructs to increase the applicability of the proposed model.
18
7. CONCLUSION
Our research addresses the theme of mobile Apps, a modern technology, highly used by people who have smartphones. In IS literature, the concept of continuance intention has not been deeply explored regarding the various technologies. To fill this gap, we propose an innovative theoretical framework by joining ECM and UTUAT2, in order to better understand continuance intention. The empirical results showed that continuance intentions of the individuals are directly and meaningfully influenced by their satisfaction and performance expectancy of usage of mobile Apps. However, through the UTUAT2 it was demonstrated that effort expectancy and habits can be important concepts for studying continuance intention. We inspected the validity of all constructs associated with continuance intention. The companies related with mobile Apps should look at this research to better understand what makes their users continue to use their products.
19
8. REFERENCES
Alwahaishi, S., & Snásel, V. (2013). Acceptance and use of information and communications
technology: a UTAUT and flow based theoretical model. Journal of technology management &
innovation, 8(2), 61-73.
Barnes, S. J. (2011). Understanding use continuance in virtual worlds: Empirical test of a research model. Information & Management, 48(8), 313–319.
Bellman, S., Potter, R. F., Treleaven-Hassard, S., Robinson, J. A., & Varan, D. (2011). The effectiveness of branded mobile phone apps. Journal of interactive Marketing, 25(4), 191-200.
Bhattacherjee, A. (2001a). An empirical analysis of the antecedents of electronic commerce service continuance. Decision support systems, 32(2), 201-214.
Bhattacherjee, A. (2001b). Understanding Information Systems Continuance: An Expectation-confirmation Model. MIS Quarterly, 25(3), 351–370.
Brown, S., & Venkatesh, V. (2005). Model of Adoption of Technology in Households: A Baseline Model Test and Extension Incorporating Household Life Cycle. MIS Quarterly, 29(3), 399-426. Chang, I.-C., Liu, C.-C., & Chen, K. (2014). The effects of hedonic/utilitarian expectations and social
influence on continuance intention to play online games. Internet Research, 24(1), 21-45. Chin, W. W. (1998).Issues and Opinion on structural Equation Modelling. Management Information
Systems quarterly, 22(1), 1-8.
Chin, W. W., Marcolin, B. L., & Newsted, P. R. (2003). A partial least squares latent variable modeling approach for measuring interaction effects: Results from a Monte Carlo simulation study and an electronic-mail emotion/adoption study. Information systems research, 14(2), 189-217.
Chiu, C.-M., Hsu, M.-H., Sun, S.-Y., Lin, T.-C., & Sun, P.-C. (2005).Usability, quality, value and e-learning continuance decisions. Computers & Education, 45(4), 399-416.
Chiu, C.-M., & Wang, E. T. G. (2008). Understanding Web-based learning continuance intention: The role of subjective task value. Information & Management, 45(3), 194-201.
Cho, J. (2016).The impact of post-adoption beliefs on the continued use of health apps. International
journal of medical informatics, 87, 75-83.
Davis, F. D., Bagozzi, R. P., & Warshaw, P. R. (1992). Extrinsic and intrinsic motivation to use computers in the workplace1. Journal of applied social psychology, 22(14), 1111-1132. Davis, F. (1989). Perceived Usefulness, Perceived Ease of Use, and User Acceptance of Information
Technology. MIS Quarterly, 13(3), 319-340.
F. Hair Jr, J., Sarstedt, M., Hopkins, L., & G. Kuppelwieser, V. (2014). Partial least squares structural equation modeling (PLS-SEM) An emerging tool in business research. European Business
Review, 26(2), 106-121.
Flurry Analytics. (2014). Mobile App Usage Increases In 2014, As Mobile Web Surfing Declines. Retrieved May 10, 2016, from https://techcrunch.com/2014/04/01/mobile-app-usage-increases-in-2014-as-mobile-web-surfing-declines/.
Fornell, C., & Larcker, D. (1981). Evaluating Structural Equation Models with Unobservable Variables and Measurement Error. Journal of Marketing Research, 18(1), 39-50.
Gallagher, M., Pearson, P., Drinkwater, C., & Guy, J. (2001).Managing patient demand: a qualitative study of appointment making in general practice. The British journal of general
practice, 51(465), 280-285.
Gartner. (2015). Gartner Says Demand for Enterprise Mobile Apps Will Outstrip Available Development Capacity Five to One. Retrieved August 12, 2016, from
20 http://www.gartner.com/newsroom/id/3076817.
Gartner. (2016). Gartner Survey Reveals Enterprise Spending on Mobile App Development Remains Low. Retrieved October 11, 2016, from .
Gefen, D. (2003). TAM or just plain habit: A look at experienced online shoppers. Journal of
Organizational and End User Computing (JOEUC), 15(3), 1-13.
Gefen, D., & Straub, D. W. (2005). A practical guide to factorial validity using PLS-Graph: Tutorial and annotated example. Communications of the Association for Information systems, 16(1), 91-107. Hair Jr, J. F., Hult, G. T. M., Ringle, C., & Sarstedt, M. (2016). A primer on partial least squares
structural equation modeling (PLS-SEM). Thousand Oaks, CA: Sage.
Harris, M. A., Brookshire, R., & Chin, A. G. (2016). Identifying factors influencing consumers’ intent to install mobile applications. International Journal of Information Management, 36(3), 441-450. Henseler, J., Ringle, C. M., & Sinkovics, R. R. (2009). The use of partial least squares path modeling in
international marketing. Advances in international marketing, 20(1), 277-319.
Hoehle, H., & Venkatesh, V. (2015). Mobile application usability: conceptualization and instrument development. MIS Quarterly, 39(2), 435-472.
Hoehle, H., Zhang, X., & Venkatesh, V. (2015).An espoused cultural perspective to understand continued intention to use mobile applications: a four-country study of mobile social media application usability. European Journal of Information Systems, 24(3), 337-359.
Hsiao, C. H., Chang, J. J., & Tang, K. Y. (2016). Exploring the influential factors in continuance usage of mobile social Apps: Satisfaction, habit, and customer value perspectives. Telematics and
Informatics, 33(2), 342-355.
Hsu, C. L., & Lin, J. C. C. (2015). What drives purchase intention for paid mobile apps?–An expectation confirmation model with perceived value. Electronic Commerce Research and
Applications, 14(1), 46-57.
Kang, S. (2014). Factors influencing intention of mobile application use. International Journal of
Mobile Communications, 12(4), 360-379.
Kim, S. J., Wang, R. J. H., & Malthouse, E. C. (2015). The Effects of Adopting and Using a Brand's Mobile Application on Customers' Subsequent Purchase Behavior. Journal of Interactive
Marketing, 31, 28-41.
Kim, S. S., & Malhotra, N. K. (2005). A longitudinal model of continued IS use: An integrative view of four mechanisms underlying postadoption phenomena. Management science, 51(5), 741-755. Kim, S. S., Malhotra, N. K., & Narasimhan, S. (2005). Research note—two competing perspectives on
automatic use: A theoretical and empirical comparison. Information Systems Research, 16(4), 418-432.
Lee, M.-C. (2010). Explaining and predicting users’ continuance intention toward e-learning: An extension of the expectation–confirmation model. Computers & Education, 54(2), 506-516. Li, H., Liu, Y., Xu, X., Heikkilä, J., & Van Der Heijden, H. (2015). Modeling hedonic is continuance
through the uses and gratifications theory: An empirical study in online games. Computers in
Human Behavior, 48(1), 261-272.
Limayem, M., Hirt, S., & Cheung, C. (2007). How Habit Limits the Predictive Power of Intention: The Case of Information Systems Continuance. MIS Quarterly, 31(4), 705-737.
Lin, C. S., Wu, S., & Tsai, R. J. (2005). Integrating perceived playfulness into expectation-confirmation model for web portal context. Information & management, 42(5), 683-693.
Oliver, R. L. (1980). A Cognitive Model of the Antecedents and Consequences of Satisfaction Decisions. Journal of Marketing Research, 17(4), 460-469.
21 Porter, M. E. (1980). Competitive Strategy: Techniques for Analyzing Industries and Competitors, The
Free Press, New York.
Ringle, C. M., Wende, S., & Becker, J. M. (2014). Smartpls 3. Hamburg: SmartPLS.
Roca, J. C., Chiu, C.-M., & Martínez, F. J. (2006). Understanding e-learning continuance intention: An extension of the Technology Acceptance Model. International Journal of human-computer
studies, 64(8), 683-696.
Ryans, A. B. (1974). Estimating Consumer Preferences for a New Durable Brand in an Established Product Class. Journal of Marketing Research, 11(4), 434-443.
Saadé, R., & Bahli, B. (2005). The impact of cognitive absorption on perceived usefulness and perceived ease of use in on-line learning: an extension of the technology acceptance model. Information & management, 42(2), 317-327.
Shen, A. X. L., Cheung, C. M. K., Lee, M. K. O., & Chen, H. (2011). How social influence affects we-intention to use instant messaging: The moderating effect of usage experience. Information
Systems Frontiers, 13(2), 157-169.
Song, J., Kim, J., Jones, D. R., Baker, J., & Chin, W. W. (2014).Application discoverability and user satisfaction in mobile application stores: An environmental psychology perspective. Decision
Support Systems, 59(1), 37-51.
Stone, R. W., & Baker-Eveleth, L. (2013). Students’ expectation, confirmation, and continuance intention to use electronic textbooks. Computers in Human Behavior, 29(3), 984-990. Thong, J. Y. L., Hong, S.-J., & Tam, K. Y. (2006).The effects of post-adoption beliefs on the
expectation-confirmation model for information technology continuance. International Journal
of Human-Computer Studies, 64(9), 799-810.
Venkatesh, V., & Morris, M. (2000). Why Don't Men Ever Stop to Ask for Directions? Gender, Social Influence, and Their Role in Technology Acceptance and Usage Behavior. MIS Quarterly, 24(1), 115-139.
Venkatesh, V., Brown, S., Maruping, L., & Bala, H. (2008). Predicting Different Conceptualizations of System Use: The Competing Roles of Behavioral Intention, Facilitating Conditions, and
Behavioral Expectation. MIS Quarterly, 32(3), 483-502.
Venkatesh, V., Morris, M., Davis, G., & Davis, F. (2003). User Acceptance of Information Technology: Toward a Unified View. MIS Quarterly, 27(3), 425-478.
Venkatesh, V., Morris, M. G., & Ackerman, P. L. (2000). A longitudinal field investigation of gender differences in individual technology adoption decision-making processes. Organizational
behavior and human decision processes, 83(1), 33-60.
Venkatesh, V., Thong, J. Y. L., Chan, F. K. Y., Hu, P. J.-H., & Brown, S. A. (2011). Extending the two‐ stage information systems continuance model: Incorporating UTAUT predictors and the role of context. Information Systems Journal, 21(6), 527-555.
Venkatesh, V., Thong, J. Y. L., & Xu, X. (2012). Consumer acceptance and use of information technology: extending the unified theory of acceptance and use of technology. MIS
quarterly, 36(1), 157-178.
Vila, N., & Kuster, I. (2011).Consumer feelings and behaviours towards well designed websites. Information & Management, 48(4), 166-177.
Wang, Y., Meister, D. B., & Gray, P. H. (2013).Social Influence and Knowledge Management Systems Use: Evidence from Panel Data1. MIS Quarterly, 37(1), 299-313.
Wang, H.-Y., Liao, C., & Yang, L.-H. (2013). What affects mobile application use? The roles of consumption values. International Journal of Marketing Studies, 5(2), 11-22.
22 Xu, C., Peak, D., & Prybutok, V. (2015). A customer value, satisfaction, and loyalty perspective of
mobile application recommendations. Decision Support Systems, 79(1), 171-183. Zhou, T., & Li, H. (2014). Understanding mobile SNS continuance usage in China from the
perspectives of social influence and privacy concern. Computers in Human Behavior, 37(1), 283-289.
23
9. APPENDIX
Constructs Items Adapted from
Performance Expectancy
PE1. I find mobile Apps useful in my daily life.
PE2. Using mobile Apps increases my chances of achieving things that are important to me.
PE3. Using mobile Apps helps me accomplish things more quickly. PE4. Using mobile Apps increases my productivity.
(Venkatesh et al. 2011)
Effort Expectancy
EE1. Learning how to use mobile Apps is easy for me.
EE2. My interaction with mobile Apps is clear and understandable. EE3. I find mobile Apps easy to use.
EE4. It is easy for me to become skilful at using mobile Apps.
(Venkatesh et al. 2011)
Social Influence
SI1. People who are important to me think that I should use mobile Apps. SI2. People who influence my behaviour think that I should use mobile Apps.
SI3. People whose opinions that I value prefer that I use mobile Apps.
(Venkatesh et al. 2011)
Facilitating Conditions
FC1. I have the resources necessary to use mobile Apps. FC2. I have the knowledge necessary to use mobile Apps. FC3. Mobile Apps is compatible with other technologies I use.
FC4. I can get help from others when I have difficulties using mobile Apps.
(Venkatesh et al. 2011)
Hedonic Motivation
HM1. Using mobile Apps is fun. HM2. Using mobile Apps is enjoyable. HM3. Using mobile Apps is very entertaining.
(Venkatesh et al. 2011)
Price Value
PV1. Mobile Apps are reasonably priced.
PV2. Mobile Apps are a good value for the money.
PV3. At the current price, mobile Apps provide a good value.
(Venkatesh et al. 2011)
Habit
HAB1. The use of mobile Apps has become a habit for me. HAB2. I am addicted to using mobile Apps.
HAB3. I must use mobile Apps.
HT.4 Using mobile Apps has become natural to me.
(Venkatesh et al. 2011)
Confirmation
CONF1. Using mobile Apps was better than I expected.
CONF2. The service level or function provided for mobile Apps in general was better than I predicted.
CONF3. Overall, most of my expectations from using mobile Apps were confirmed.
(Bhattacherjee, 2001b)
Satisfaction
SAT1. I believe I made the correct decision in using a certain App. SAT2. Using mobile Apps makes me feel very satisfied.
SAT3. I am pleased with the mobile Apps I have downloaded.
(Vila & Kuster, 2011)
Continuance Intention
CI1. I intend to continue using mobile Apps in the future. CI2. I will always try to use mobile Apps in my daily life CI3. I will keep using mobile Apps as regularly as I do now.
(Bhattacherjee, 2001b); (Venkatesh et al.