O
R
I
G
I
N
A
L
A
R
T
I
C
L
E
UATR and NIRA evaluation in the quantification of ATBC
in NC blends
Talita de Souza Dias Mello
1, Milton Faria Diniz
2and Rita de Cássia Lazzarini Dutra
1*
1
Instituto Tecnológico de Aeronáutica – ITA, São José dos Campos, SP, Brasil
2
Divisão de Química – AQI, Instituto de Aeronáutica e Espaço – IAE, São José dos Campos, SP, Brasil
Abstract
The paint industry requires rapid and accurate methodologies of raw materials qualitiy controls. For example, the evaluation of the suitable ratio of binary mixtures of polymer/plasticizer such as nitrocellulose (NC)/acetyl tributyl
citrate (ATBC) must be done, since this ratio is directly related to the performance of the final product. However,
there is a small number of quantitative methodologies of such control in the literature. In this context, in this paper, the applicability of Infrared Fourier Transform Spectroscopy (FT-IR) techniques by using universal total attenuated
reflection (UATR), in the middle infrared (MIR), and the reflectance analysis in the near infrared region (NIRA) is evaluated for the quantification of plasticizer ATBC in mixtures with NC. MIR and NIR methodologies presented good results such as: practicality of not requiring refined sample preparation, analysis time about 30 min and good accuracy,
suitable data for using in the quality control laboratories of paint industry.
Keywords: ATBC, NC, NIRA, paints, UATR.
1. Introduction
Paints find applications in different industrial scenarios that are important for the economy and national sovereignty, such as naval, aeronautical, aerospace, microelectronic, automotive, graphic, and construction, among others[1-4].
It is known that the resins used in paints govern important properties, such as flexibility, hardness, and resistance to both alkalis and abrasion. Plasticisers also improve flexibility and resistance to wrinkling[1]. Alkyd resins and polyurethanes based in NC, among others, are used in the formulations of paints. Recently, a polymer based on oligopiperylene styrene modified with an alkoxysilane was tested as protection against adverse factors for construction, being considered as a new ecological coating[4].
As is known, the polymer used in this paper, NC, is a nitrate carbohydrate based on cellulose nitration. Specifically, one to three hydroxyl groups of D-glucopyranose may be substituted by the nitro groups thus producing various types of NC. These compounds are present in smokeless gunpowder as well as in a wide variety of everyday products. The different types of applications depend on the amount of nitrogen. Low nitrogen presence confers coverage and protection to the properties of NC, while high nitrogen provides explosive properties to this compound, making it an energetic material.
In practice, NC with low nitration can be found in common products such as cigarettes, nail varnishes and varnishes, while NC with high nitration are parts of explosive components such as smokeless powder and dynamites[5]. These characteristics make NC a versatile polymer for different applications, and studies involving this polymer are welcomed in the scientific and technological communities.
The degree of nitration of the NC determines properties such as the solubility and flammability of the final product.
NC with a high nitrogen content (≥ 12.5%), forms a soft
substance known as powder cotton which is unstable to heat, and even a carefully prepared sample can decompose rapidly at temperatures above 150 °C. Powder cotton is used in smoke-free gunpowder, rocket propellants, and explosives.
NC with a median nitrogen content (between 10.5% and 12.5%) was employed in this study and is thermally unstable,
but it decomposes less violently than powder cotton and is soluble in alcohols and ethers. NC of this type is known by different names such as pyroxylin and cotton collodion, and is employed as a solvent-based paint-forming agent and in protective coatings[6].
NC is responsible for the adhesion of the paint to the substrate and the properties of the formed film. It is widely used in automotive refinishing, wood finishing and sealants, rotogravure and flexography printing inks, nail enamels, and leather finishes[7]. On the other hand, the main constituent of single base (SB) and double base (DB) propellants is NC[8].
Phthalates are also found in thermal shielding formulations of rocket motors based on butadiene copolymer and acrylonitrile (NBR)[9]. However, due to their potential to interfere negatively with the hormonal systems of animals and humans since belonging to endocrine disruptors, exogenous substances that alter the functions of the endocrine system and cause adverse effects on health[10], special attention has been given to these compounds in recent years. The migration of these compounds into packaging materials has become an important source of contamination for food[11].
Although citrates have higher production costs, act as plasticizers of great acceptance, since they are considered natural products without health risks. ATBC is the best known, compatible with a large number of resins, such as vinyls and cellulosics. In Brazil, citrates are ingredients in polymer films for packaging, notedly when they come into direct contact with food. With a constant concern for healthy sources of raw materials from the chemical industry, there are companies that prohibit the use of phthalates, and ATBC is a favorable option. Therefore, the development of methods that characterize and/or quantify plasticizers in a composition is of paramount importance[11].
In some market segments where public oversight is effective, it is common to use ATBC together with NC resin, such as in package printing inks. The NC / plasticiser ratio is directly related to the performance of the final product, including the steps of application and drying of the paint. In order to have a better product performance the NC/ATBC ratio must be explored in order to achieve the most satisfactory relation. Therefore, characterisation techniques that attest to the presence of ATBC and/or quantify it in mixtures with resins, such as NC, are therefore important, and methodologies should be developed to achieve this.
FT-IR spectroscopy, coupled with other techniques, either on-line or off-line, has shown good results for the qualitative and quantitative analysis of resins and additives used in paints[11-15].
Souza et al.[16] applied Raman and infrared spectroscopy techniques for the identification and quantification of plasticisers in commercial stretchable PVC films. Calibration curves were constructed, by means of the addition of a standard, obtaining linearity and a high coefficient of correlation, resulting in the practicality and low cost of analysis using the FT-IR technique and the results obtained indicating that this technique can be used for the first evaluation of existing plasticisers in commercial stretchable PVC films.
Rodrigues et al.[11] developed a methodology to evaluate the applicability of the coupling (indirect or off-line) of thin-layer chromatography (TLC) and FT-IR techniques called TLC-IR, and the selective extraction in the analysis
of additives in polyurethane resin-based paint (PU) and NC.
A formulation was used, evaluating three eluent systems and one type of developer, Gibbs. The FT-IR spectra were obtained by reflection, using the last generation reflection
accessory, UATR. The main results showed that the ATBC,
the major additive in the analysed composition, was easily identified by TLC-IR. The methodology allowed the detection and differentiation of plasticisers such as dioctylphthalate (DOP) and DBP, even in a small sample, and to identify the
oleamide (sliding promoter additive) by means of selective
extraction and UATR.
FT-IR and high performance liquid chromatography
(HPLC) techniques were also used to develop a methodology
for the separation and characterisation of the main biocides used in acrylic paints. It was observed that the direct FT-IR analysis of the biocides by means of reflection techniques was not possible, because the loads and the resins interfered in the analysis, due to the presence of intense bands and high concentrations in the inks. The solvent extraction technique, especially with carbon tetrachloride, eliminated and allowed the characterisation of the different biocides used[13].
Another methodology was developed by the same group[14] using the FT-IR technique, DRIFT / NIR, that is, obtaining diffuse reflectance spectra (DRIFT) in the near infrared (NIR) region for the characterisation of n-octylisothiazolinone (OIT), carbendazim and diuron in compositions of acrylic paints containing these milled microbicides reduced to
particle sizes in the order of 5 μm. The DRIFT / NIR
analysis indicated analytical bands (a term used in infrared spectroscopy to refer to the characteristic absorption of the group whose intensity varies with the concentration, thus obeying the Lambert-Beer Law) for the said microbicides. The presence of these compounds in the dry paint film was
also confirmed by HPLC and microbiological analyses.
Although the quantification of FT-IR data is smaller than the qualitative ones, especially in the analysis of paints, it is possible to highlight a methodology[15], in the medium
infrared (MIR) region and the least explored, NIR, (UATR
and DRIFT) and / or Transmission for the determination
of the PU resin content in binary mixtures with NC, used in formulations of paints. The Reflection-UATR technique in the MIR region, as well as the DRIFT, Transmission and
Reflection techniques in the NIR region, proved to be useful
for quantifying the PU Resin content in NC binary systems
with good precision. It is understood that the developed methodology, with adaptations relative to the analytical bands, can be used to quantify other binary mixtures.
Although the aforementioned studies analyse polymers used in paints, including NC, by means of different techniques, it can be concluded that they still allow some gaps such as the application of unconventional FT-IR techniques for quantitative analysis of plasticisers in blends with resins, in particular NC. Thus, in this paper a methodology was proposed and evaluated with the use of FT-IR reflection techniques (usual and last generation) in a wide spectral range, including the near infrared region (NIR), with reflectance accessories (NIRA) and therefore the applicability of the
UATR and NIRA techniques for the characterisation and
quantification of the base polymer / plasticiser used in paint formulations.
2. Materials and Methods
Low nitration (10.8-11.2% of nitrogen) NC samples
and the plasticiser ATBC (Sandiflex) were assigned by the
company Nitroquímica. Analytical grade methanol (MERCK)
The FT-IR quantitative analysis was performed using a PerkinElmer FT-IR spectrometer, Spectrum One model (spectral range 4000 to 550 cm-1 - medium infrared region - MIR and NIR region, from 10000 to 4000 cm-1, Resolution 4 cm-1,
20 scans). For the MIR analysis, samples with known
concentrations were prepared with NC and the plasticiser and subsequently dissolved in methanol. The samples were analysed by the reflection mode, via universal attenuated
total reflection accessory (UATR). For the NIR analysis, the samples with concentrations of 10, 15, 20 and 30% of
ATBC were analysed as received by transflectance with the use of the NIRA accessory.
A calibration or analytical MIR curve was developed,
relating the relative band (A1740 / A1651) and the relative ratio of ATBC and NC. The analytical bands 1740 cm-1 (υ C=O) and 1651 cm-1 (υ
a NO2) were selected, respectively, for ATBC and NC. The baseline ranged from 1800 to 1590 cm-1. The data of the calibration curve represents the median of 5 values of the relative band A1740/A1651. The NIR calibration curve was computed by relating A5840 (ATBC) and the ratio of ATBC. A5840 is probably attributed to the first overtone
of υ C = O band or the combination band of υ C = O and υs CO band around 1270 cm
-1. The baseline ranged from 6100 to 5360 cm-1. The data represent the median of 5 values of the band intensity A5840.
2.1 Formulas used in calculations of deviations by FT-IR[17]
The deviation calculations were done according to Horák
and Vítek[17] and with the methodology adopted successfully from the previous paper of the group, involving quantitative IR analyses of blends or polymer blends[15,18]. Thus, five aliquots for each sample were analysed, being calculated the particular relative band and the median (µ) of of these values was calculated. The mean standard deviation (σˆµ) of the relative band median value was calculated according to
Equation 1. For the calculation of the error of the methodology, the median value of the relative errors found was adopted according to previous studies[15,18].
ˆ ˆ
n
µ µ
σ
σ = (1)
where, the standard deviation for the number of measurements realized is given by Equation 2:
ˆµ K RR.
σ = (2)
R is the difference between the highest and lowest
absorbance values (Xn - X1). KR is the coefficient for
calculating the standard deviation of a range of values (for 5 experiments[17], K
R = 0.430). The relative error for each analysed sample was determined by Equation 3: 2.2 Relative error
ˆ
(%)= σµµx100
(3)
3. Results and Discussion
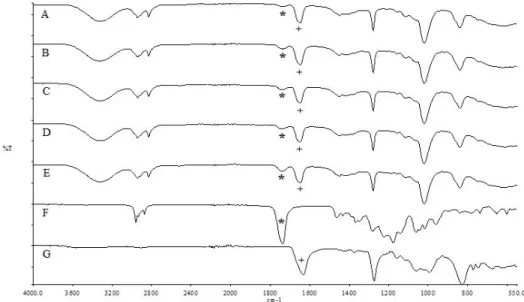
3.1 MIR region: spectra obtained by reflection, with UATR accessory
3.1.1 Characterization (qualitative analysis) FT-MIR of the NC resin and plasticiser
ATBC - The most characteristic functional groups for the NC resin are the nitro groups which absorb in approximately (cm-1): 1650 (υ
a NO2), 1270 (υs NO2) and 860 (υNO). The most characteristic absorptions of ATBC are in approximately
(cm-1): 1740 (υC= O), 1290-1000 (υ
sC-O) [19]. 3.1.2 FT-MIR analysis (quantitative)
In the case of the studied system, NC / ATBC (1), the bands considered as analytical are at 1650 cm-1 (NC) and 1740 cm-1 (ATBC). In Figure 1, only some spectra of the
studied system were inserted, with the intention of not filling the chart with too much information and making it difficult
to visualise the bands. However, the data of all the samples
is in Table 1. They were used for the development of the calibration curve (Equation 4, Figure 2), with good linear
correlation (R = 0.974) for the determination of ATBC in NC. The error of the methodology (0.73%), that is, the
median of the relative errors is within the accuracy limits
of the FT-IR spectrometer (≤2%). To find the percentages of
ATBC / NC, for unknown samples (methodology evaluation), Equations 4 and 5 were used.
0.834 0.0227
y= x− (4)
where y = (A1740/A1651) e x = [ATBC]/ [NC].
[
ATBC] [ ]
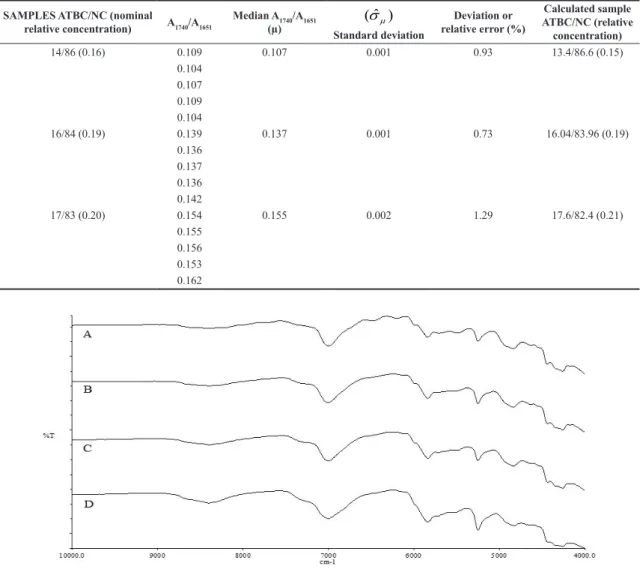
+ NC =100 (5)In order to verify the effectiveness of the methodology, three new ATBC / NC samples were prepared. The results were close to the nominal values, with relative errors, below
2%, that is, with good precision (Table 2). The analysis time was 30 minutes, demonstrating that the methodology can be used in industrial sectors, where time is an important factor in the emission of a result, for the proper interaction between laboratory and process.
3.2 NIR region: spectra obtained by reflection, with NIRA accessory
3.2.1 Characterisation (qualitative analysis) FT-NIR of ATBC plasticiser
To validate the FT-MIR methodology, another methodology
was developed by FT-NIR based on the band observed at 5840 cm-1. Only this band associated with the carbonyl of the ATBC was used because it is easier to be visualised and determined, due to its intensity and location in the NIR region, where the intensity of the bands is usually smaller, making it difficult to observe the weaker absorptions and implying the use of concentration increasing resources, sample thickness, etc.[20].
Table 1. FT-MIR data, including errors inherent in the methodology, for the preparation of the calibration curve A1740 / A1651 versus [ATBC] / [NC].
Samples ATBC/NC
(relative concentration)
A1740/A1651
Median A1740/A1651
(µ)
) ˆ (
σ
µStandard deviation
Deviation or relative error (%)
10/90 (0.11) 0.082 0.082 0.001 1.22 0.082
0.083 0.082 0.087
15/85 (0.18) 0.135 0.137 0.001 0.73 0.139
0.137 0.135 0.137
18/82 (0.22) 0.158 0.151 0.003 1.99 0.151
0.153 0.143 0.143 0.162 0.170
19/81 (0.23) 0.167 0.167 0.001 0.60 0.169
0.162 0.186 0.184
20/80 (0.25) 0.181 0.184 0.001 0.54 0.189
0.184 0.186 0.185
22/78 (0.28) 0.184 0.186 0.001 0.54 0.186
0.187 0.337 0.342
30/70 (0.43) 0.352 0.352 0.004 1.14 0.354
0.360
3.2.2 FT-NIR Analysis (quantitative)
In Figure 3, the NIR spectra of the studied system were inserted. The data used for the development of the calibration curve (Equation 6) is in Table 3 and Figure 4.
The sample, in solution, did not respond adequately to the NIR analysis, so an attempt was made to analyse it directly, as received, which is also not a simple task since the homogeneity of the sample and the morphology of the fibers hinder the repeatability of the tests due to the
Table 2. Data regarding the application of the MIR methodology to the ATBC/NC samples.
SAMPLES ATBC/NC (nominal
relative concentration) A1740/A1651
Median A1740/A1651 (µ)
) ˆ (
σ
µ Standard deviationDeviation or relative error (%)
Calculated sample ATBC/NC (relative concentration)
14/86 (0.16) 0.109 0.107 0.001 0.93 13.4/86.6 (0.15) 0.104
0.107 0.109 0.104
16/84 (0.19) 0.139 0.137 0.001 0.73 16.04/83.96 (0.19) 0.136
0.137 0.136 0.142
17/83 (0.20) 0.154 0.155 0.002 1.29 17.6/82.4 (0.21) 0.155
0.156 0.153 0.162
Figure 3. FT-NIR spectra of NC / ATBC samples, analysed as received, with different ratios of ATBC: (A) 10; (B) 15; (C) 20; and (D) 30.
complexity of compaction and preparation of the samples. Thus, four samples were analyzed, representing lower,
intermediate, and high levels. However, the methodology presented a good linear correlation (R = 0.989) for the
determination of ATBC in NC binary mixtures by NIR
according to Equation 6. The methodology error (1.70%) is within the spectrometer accuracy limits FT-IR (≤2%).
0.2632 0.0647
y= x + (6)
where y = A5840 e x = [ATBC].
Comparatively, the analysis time spent for the preparation
of samples aiming at the UATR reflection technique (MIR region) was approximately 20 minutes, since the
dissolution of NC/ ATBC in methanol was necessary. The NIRA technique (NIR region) is faster, around 5 minutes, because it discards the dissolution step, by analysing the samples as received. This shows that both methodologies,
NIR and MIR, can be used in industrial sectors that have
one or another spectrophotometer, and that need fast ATBC control techniques in NC.
4. Conclusion
The Reflection techniques in the MIR and NIR
regions were useful for quantifying the ATBC content in binary systems with NC, demonstrating practicality
when using unconventional techniques such as UATR and
NIR-transflectance, which do not require sophisticated preparation techniques. Samples present reduced time of analysis and good precision, essential factors in industries or Research Centers for the evaluation of the studied system,
since the proportion of plasticiser/NC is directly related to the performance of the final product.
5. Acknowledgements
This paper was supported in part by PVNS (National Senior Visiting Professor Program) and PROAP (Postgraduate Support Program) from CAPES and ADC/DCTA (Classical sports association of civil and military servants of the Aerospace Technical Center).
6. References
1. Fazenda, J. M. R. (2005). Tintas e vernizes: ciência e tecnologia. São Paulo: Edgard Blücher.
2. Biscaro, R. S., Botelho, E. C., Takahashi, M. F. K., Faez, R., & Rezende, M. C. (2002). Estudo reológico de tintas de poliuretano contendo pani-DBSA aplicadas como materiais absorvedores de microondas (8-12 GHz).Polímeros: Ciência e Tecnologia, 12(4), 318-327. http://dx.doi.org/10.1590/S0104-14282002000400016.
3. Coutinho, F. M. B., & Delpech, M. C. (1999). Poliuretanos como materiais de revestimento de superfície. Polímeros: Ciência e Tecnologia, 9(1), 41-48. http://dx.doi.org/10.1590/ S0104-14281999000100006.
4. Trifonova, T., Selivanov, O., Chukhlanova, N., & Selivanova, N. (2013). Polymeric coatings composition based on modified oligopiperylene styrene binders with galvanic sludge as a filler.
Chemical Engineering Science, 1(4), 75-78. http://dx.doi. org/10.12691/ces-1-4-5.
5. Fernández de la Ossa, M. Á., Ortega-Ojeda, F., & García-Ruiz, C. (2013). Discrimination of non-explosive and explosive samples through nitrocellulose fingerprints obtained by capillary electrophoresis. Journal of Chromatography. A, 1302, 197-204. http://dx.doi.org/10.1016/j.chroma.2013.06.034. PMid:23845757.
6. Química Nova Interativa. (2016). Retrieved in 2016, April 20, from http://qnint.sbq.org.br/qni/popup_visualizarMolecula. php
7. Mundocor. (2016). Retrieved in 2016, April 15, from http:// www.mundocor.com.br/tintas/nitrocelulose.asp
8. Andrade, J., Iha, K., Rocco, J. A. F. F., Franco, G. P., Suzuki, N., & Suárez-Iha, M. E. V. (2007). Determinação dos parâmetros cinéticos de decomposição térmica para propelentes BS e BD.
Eclética Química, 32(3), 45-50. http://dx.doi.org/10.1590/ S0100-46702007000300007.
9. Sanches, N. B., Diniz, M. F., Alves, L. C., Dutra, J. C. N., Cassu, S. N., Azevedo, M. F. P., Mattos, E. C., & Dutra, R. C. L. (2008). Avaliação da aplicabilidade de técnicas FT-IR de reflexão (UATR) e de transmissão para a determinação do teor de acrilonitrila (AN) em NBR. Polímeros: Ciência e Tecnologia, 18(3), 249-255. http://dx.doi.org/10.1590/S0104-14282008000300011.
10. Souza, R. R., Martins, E. A. J., Otomo, J. I., Furusawa, H. A., & Pires, M. A. F. (2012). Determinação de plastificantes em água potável utilizando cromatografia gasosa e espectrometria de massas. Química Nova, 35(7), 1453-1458. http://dx.doi. org/10.1590/S0100-40422012000700028.
11. Rodrigues, V. C., Diniz, M. F., Mattos, E. C., & Dutra, R. C. L. (2016). Separação e identificação de aditivos em tinta por TLC-IR/ UATR e extração seletiva.Polímeros: Ciência e Tecnologia, 26, 68-74. http://dx.doi.org/10.1590/0104-1428.1887.
12. Germinario, G., Van der Werf, I. D., & Sabbatini, L. (2015). Chemical characterisation of spray paints by a multi-analytical Table 3. FT-NIR data, including errors inherent in the methodology,
for the elaboration of the calibration curve A5840 versus [ATBC].
Proportion of ATBC in
sample A5840 Median A5840 (µ) Standard deviation
)
ˆ
(
σ
µDeviation or relative error (%)
10 0.088 0.092 0.001 1.09 0.091
0.094 0.095 0.092
15 0.112 0.116 0.002 1.72 0.119
0.123 0.110 0.116
20 0.136 0.127 0.003 2.34 0.120
0.127 0.134 0.126
30 0.178 0.178 0.003 1.68 0.175
(Py/GC–MS, FTIR, μ-Raman) approach.Microchemical Journal,
124, 929-939. http://dx.doi.org/10.1016/j.microc.2015.04.016. 13. Pedro, R., Moraes, J. J., Diniz, M. F., Mattos, E. C., &
Dutra, R. C. L. (2014). Análise por FT-IR (UATR e PAS) de microbicidas em filmes poliméricos de tintas comerciais.
Polímeros: Ciência e Tecnologia, 24(2), 214-221. http://dx.doi. org/10.4322/polimeros.2014.041.
14. Pedro, R., Diniz, M. F., Mattos, E. C., & Dutra, R. C. L. (2014). Avaliação do efeito da moagem no desempenho e na caracterização DRIFT-NIR de microbicidas na superfície de tintas comerciais. Polímeros: Ciência e Tecnologia, 24(2), 250-258. http://dx.doi.org/10.4322/polimeros.2014.029. 15. Rodrigues, V. C., Diniz, M. F., Mattos, E. C., & Dutra, R. C.
L. (2014). Quantificação por NIR/MIR de resina poliuretânica em misturas binárias com nitrocelulose utilizadas em Tintas.
Polímeros: Ciência e Tecnologia, 24(3), 367-372. http://dx.doi. org/10.4322/polimeros.2014.027.
16. Souza, M. L., Corio, P., Temperini, M. L. A., & Temperini, J. A. (2009). Aplicação de espectroscopias raman e infravermelho
na identificação e quantificação de plastificantes em filmes comerciais de PVC esticável.Quimica Nova, 32(6), 1452-1456. http://dx.doi.org/10.1590/S0100-40422009000600017. 17. Horák, V. M., & Vítek, A. (1978). Interpretation and processing
of vibrational spectra. Chichester: John Wiley & Sons. 18. Siqueira, S. H. S., Dutra, R. C. L., & Diniz, M. F. (2008).
Determinação por espectroscopia nas regiões MIR/NIR do teor de NCO em adesivos poliuretânicos. Polímeros: Ciência e Tecnologia, 18(1), 57-62. http://dx.doi.org/10.1590/S0104-14282008000100012.
19. Smith, A. L. (1979). Applied infrared spectroscopy. New York: John Wiley & Sons.
20. Goddu, R. F. (1960). Near-infrared spectrophotometry. In C. N. Reilly (Ed.), Advances in analytical chemistry and instrumentation (pp. 347-425). New York: Interscience.
![Table 1. FT-MIR data, including errors inherent in the methodology, for the preparation of the calibration curve A 1740 / A 1651 versus [ATBC] / [NC]](https://thumb-eu.123doks.com/thumbv2/123dok_br/16316453.718863/4.765.378.692.135.763/table-including-errors-inherent-methodology-preparation-calibration-versus.webp)