1 Recebido para publicação em 17.6.2011 e aprovado em 15.11.2011.
2 Crop Science Department, Universidade Federal do Rio Grande do Sul – UFRGS, Porto Alegre, Rio Grande do Sul, Brazil, <merotto@ufrgs.br>; 3 Crop Science Department, UFRGS, Embrapa Forestry. Colombo, PR. Brazil; 4 Crop Science Department, UFRGS, Instituto Federal de Educação, Ciência e Tecnologia do Rio Grande do Sul, Sertão, Rio Grande do Sul, Brazil.
R
EFLECTANCEI
NDICES AS AD
IAGNOSTICT
OOL FORW
EEDC
ONTROLP
ERFORMEDB
YM
ULTIPURPOSEE
QUIPMENT INP
RECISIONA
GRICULTURE1Índices de Reflectância como Ferramenta de Diagnóstico para o Controle de Plantas Daninhas
Através de Equipamentos de Uso Múltiplo em Agricultura de Precisão
MEROTTO JR., A.2
, BREDEMEIER, C.2
, VIDAL, R.A.2
, GOULART, I.C.G.R.3
, BORTOLI, E.D.2 and ANDERSON, N.L.4
ABSTRACT - Several tools of precision agriculture have been developed for specific uses. However, this specificity may hinder the implementation of precision agriculture due to an increasing in costs and operational complexity. The use of vegetation index sensors which are traditionally developed for crop fertilization, for site-specific weed management can provide multiple utilizations of these sensors and result in the optimization of precision agriculture. The aim of this study was to evaluate the relationship between reflectance indices of weeds obtained by the GreenSeeker™ sensor and conventional parameters used for weed interference quantification. Two experiments were conducted with soybean and corn by establishing a gradient of weed interference through the use of pre- and post-emergence herbicides. The weed quantification was evaluated by the normalized difference vegetation index (NDVI) and the ratio of red to near infrared (Red/NIR) obtained using the GreenSeeker™ sensor, the visual weed control, the weed dry matter, and digital photographs, which supplied information about the leaf area coverage proportions of weed and straw. The weed leaf coverage obtained using digital photography was highly associated with the NDVI (r = 0.78) and the Red/NIR (r = -0.74). The weed dry matter also positively correlated with the NDVI obtained in 1 m linear (r = 0.66). The results indicated that the GreenSeeker™ sensor originally used for crop fertilization could also be used to obtain reflectance indices in the area between rows of crops to support decision-making programs for weed control.
Keywords: GreenSeekerTM, interspecific competition, corn, NDVI, Red/NIR, soybean.
daninhas teve razoável correlação com o NDVI obtido em 1 m linear (r = 61). Os resultados indicaram que o sensor Greenseeker™, originalmente utilizado para determinação da fertilização em culturas, também pode ser empregado na obtenção dos índices de reflectância da vegetação existente na entrelinha das culturas e utilizado para a tomada de decisão sobre a necessidade de controle de plantas daninhas.
Palavras-chave: competição interespecífica, GreenseekerTM, milho, NDVI, Red/NIR, soja.
INTRODUCTION
The effect of weed interference is one of the main factors limiting potential crop productivity. Several methods are used to eliminate or suppress the development of weeds, thus decreasing interspecific competition and providing high grain yields. For all of these methods, there is a necessity of criterions that indicate the intensity of competition caused by weeds that should be used in decision-making strategies regarding the timing of weed control (Jasieniuk et al., 2008). In general, this determination is empirical and based on prior knowledge and often results in the adoption of uniform measures of weed control for the entire cultivated area. Alternatively, determinations of critical periods of interference and economic weed thresholds have been developed with the goal of streamlining weed control in various crops (Vidal et al., 2004; Everman et al., 2008). However, several studies have shown that the distribution of weeds occurs heterogeneously in both spatial and temporal scales (Jurado-Exposito et al., 2004). Therefore, the utilization of prior estimates of weed effects and sampled determinations of weed density may not result in an accurate diagnosis of weed interference (Gerhards & Christensen, 2003). These limitations can explain the low utilization of weed interference models and economic weed threshold indices by farmers during the planning and execution of weed control.
Various precision agriculture technologies are being developed for site-specific weed management (Jurado-Exposito et al., 2004; López-Granados, 2011). Initially, these technologies were related to weed detection to compose a weed map and to be used later in a decision-making weed control system (Gerhards & Oebel, 2006). Today, several systems can simultaneously achieve weed
detection and elimination (Ge et al., 2006). Optical sensors for weed control have been developed for the application of different herbicides, as well as different doses and combinations (Goudy et al., 2001; Sui et al., 2008). Various studies have demonstrated the existence of a broad range of equipment for weed identification, quantification, decision-making and robotic systems based on ground or satellite operation (Berge et al., 2008; Christensen et al., 2009; López-Granados, 2011). In addition, site-specific weed management is also being developed for physical methods of weed control, such as inter-and intra-row hoeing, electricity, fire inter-and lasers (Mathiassen et al., 2006; Christensen et al., 2009).
One of the main current uses of precision agriculture is to diagnose crop fertilization needs, which is usually determined by multispectral radiometers such as the GreenSeekerT M
. This device uses emitting diodes to generate visible (Red, 660 nm) and near-infrared (NIR, 770 nm) light. The generated radiation is reflected and measured by a photodiode. The GreenSeekerTM
which were developed specifically for the quantification of weeds. These equipment pieces have been used principally for discriminating between weeds and soil for herbicide application in vineyards and orchards (Lópes-Granados, 2011).
The great diversity and specificity of precision farming equipment represents an advantage in relation to the quality of information to be provided. However, the need for several equipment pieces, each one with a unique application, results in increasing costs and complexity in the agricultural endeavour. Thus, multipurpose tools can be a viable alternative, increasing the utilization of precision agriculture in different agricultural systems. Therefore, considering that the GreenSeekerTM tool has been validated
by several studies and has been used for crop fertilization, we hypothesize that this tool can also be used for weed quantification in the same way that it has been used for crop quantification. The use of vegetation index sensors for weed management, in addition to their most common use in fertilizer management, would result in multiple uses of these sensors and would optimize the performance of the tools employed in precision agriculture. In addition, the real-time determination of weed interference provided by the reflectance sensors can result in the broad utilization of the economic weed threshold by providing a small scale measure of the weed interference.
The objective of this study was to evaluate the relationship between reflectance indices of weeds obtained by the GreenSeeker™ sensor and conventional parameters used for weed interference quantification, and to indicate that the real time weed interference quantification through light sensors could facilitate the adoption of weed thresholds and precision agriculture for weed control.
MATERIALS AND METHODS
Site and experiment descriptions
The evaluation of weed interference through reflectance indices was carried out during the 2008/09 and 2009/10 seasons in experiments with soybean and corn crops,
respectively. The soil type of the experimental area was Typic Paleudult. The local climate was subtropical humid (Cfa type according to the Köppen classification), with a mean annual temperature of 19.4 o
C and a mean annual rainfall of 1,440 mm. Both experiments were conducted in a randomized complete block arranged in a split plot design, with four replications. The treatments consisted of doses of herbicides applied at pre- and post-emergence to obtain a gradient of weed density to be measured by different methods. The applications of the herbicides were performed using a backpack sprayer equipped with DG8002 spray nozzles delivering a spray volume of 200 L ha-1
, achieved with a pressure of 200 kPa and a velocity of 1.0 m s-1
. Herbicide applications were made in temperatures from 23 o
C to 27 o
C, air humidity from 65% to 72% and wind speed below 5 km h-1
.
Soybean experiment
The first experiment was conducted with soybean (Glycine max) cv. Fundacep 59 RR, which was seeded on December 18, 2008, with a target density of 400,000 plants ha-1
and row spacing of 0.4 m. Each plot consisted of eight rows that were 6.0 m long. Four levels of pre-emergence herbicides were allocated in the main plots, corresponding to 0%, 25%, 50% and 75% of the reference dose of 600 g ha-1
of sulfentrazone (Boral SC, 500 g a.i. L-1
, SC, FMC Corp.) and 360 g ha-1
of metribuzin (Sencor 480, 480 g a.i. L-1
, SC, Bayer CropScience). In the sub-plots, six doses ranging from 0 to 100% of the reference dose of 900 g ha-1
of glyphosate (Roundup Original, 360 g a.e. L-1
, SL, Monsanto do Brasil Ltda.) were applied 21 days after soybean emergence. Fertilization was performed with 20, 80 and 120 kg ha-1
of N, P2O5 and K2O,
respectively. Insect control was carried out with the insecticide chlorpyriphos (Lorsban 480 BR, 480 g a.i. L-1
, EC, Dow Agrosciences Industrial Ltda.) at a dose of 480 g ha-1
when soybean began flowering. Water was supplied by rainfall and by four waterings of 20 mm each. The weed quantification in the untreated check treatments was performed at 21 days after emergence and indicated the presence of 35 plants m-2
18 plants m-2
of B i d e n s p i l o s a (hairy beggarticks) 2 to 3 cm tall, and 5 plants m-2
of Sida rhombifolia (sida arrowleaf) 3 to 5 cm tall.
Corn experiment
The second experiment was conducted with corn (Zea mays) cv. Pioneer 30A04, sown on December 17, 2009, with a target density of 70,000 plants ha-1
. Each plot consisted of four rows 7 m long, separated by 1.0 m. In the main plots, three levels of herbicide were applied soon after sowing, corresponding to 0%, 33% and 66% of the reference dose of 1,375 g ha-1
of atrazine and 1,375 g ha-1
of simazine (Extrazin SC, 250 g a.i. L-1
of atrazine and 250 g a.i. L-1
of simazine, SC, Sipcan Isagro Brasil S.A.). In the sub-plots, six doses ranging from 0 to 100% of the reference dose of 1,000 g ha-1
of atrazine and 40 g ha-1
of nicosulfuron (Sanson AZ, 500 g a.i. kg-1
of atrazine and 20 g a.i. kg-1
of nicosulfuron, WG, ISK Biosciences) were applied 25 days after corn emergence. Weed quantification in the untreated check treatments was conducted on the same day as the application of post-emergence herbicides and indicated the presence of 28 plants m-2
of U. plantaginea with 2 to 3 expanded leaves, 26 plants m-2
B.pilosa 2 to 3 cm tall, and 2.2 plants m-2
of S. rhombifolia 2 to 3 cm tall. Fertilizer was applied at sowing at the rate of 25, 150 and 75 kg ha-1
of N, P2O5 and K2O, respectively, and
130 kg ha-1
N over the top when the plants were in leaf stage V4 (four visible leaf collars) and V10. In addition to water supplied by rainfall, five waterings of 20 mm each were provided during crop development.
Data acquisition and analysis
Both experiments were evaluated by analysing the conventional evaluations of weed dry matter, the proportion of ground coverage by weeds, straw and soil, visual weed control and grain yield, and the reflectance indices NDVI and Red/NIR through the GreenSeeker™ equipment. The analyses of the weed dry matter, proportion of ground coverage and reflectance indices were performed at 21 and 25 days after emergence (DAE) for the soybean and corn experiments, respectively.
The evaluation of the proportion of ground coverage by weeds, soil and straw was performed by digital photography with a red, green, blue (RGB) digital camera Canon A460 (Canon Inc., Tokyo, Japan). The images were taken with 2592 and 1944 pixels in the horizontal and vertical dimensions, respectively, resulting in a resolution of 5 Megapixels with 24-bit depth. The specifications used to obtain the images were 5 mm of focal length with an F-stop of f/ 4, an exposure time of 1/200 s and an ISO speed of ISO-80. The images were obtained by positioning the camera at a height of 1 m above the soil in the area between the rows. The digital pictures were edited using the software Sigma Scan Pro 5 (SPSS Inc, Chicago, IL, USA) for characterization of the areas of weeds, straw and bare soil, converting the images to the binary type by a segmentation method. The software uses the cylindrical coordinate HSV (hue, saturation, and value) in the RBG model. The threshold to discriminate weeds from the rest of image was set to a hue value of 103 and a saturation of 99. To discriminate weeds and straw from the rest of image, the component hue was 105, and the saturation was 98. Then, the proportion of each image covered by weeds and weeds plus straw was obtained using the software ImageJ (Abramoff et al., 2004). In the binary images obtained, the weed coverage pixels and weed plus straw coverage pixels received the value “1” (white pixel), and the soil plus straw coverage pixels and soil coverage pixels received the value “0” (black pixel). The ImageJ software was used to count how many “1” values the image had and calculate the proportion of these values in relation to the total number of pixels. The proportion covered by soil was obtained by subtracting the proportion of weeds plus straw from the total. Similarly, the proportion of straw could be obtained by subtracting the proportion of weeds from weeds plus straw. Therefore, the evaluation of weed leaf coverage is related to an estimation of the relative leaf area of weeds in relation of the total area of each image.
according to procedures described in Verhulst et al., (2009) and Grohs et al., (2009). The NDVI consists of the ratio of the (NIR-Red)/(NIR+Red). Therefore, the reflectance indices NDVI and Red/NIR are negatively correlated. The sensitivity of the GreenSeeker ™ equipment was set to 3. The sensitivity of this equipment can be high or low in a range that varies from 1 to 10, respectively. The equipment was carried at a velocity of approximately 1 m s-1
and at a height of approximately 0.5 m above the weed canopy level, which resulted in obtaining an index value of NDVI and Red/NIR approximately every 2.5 cm. The measurements were performed in the area between-rows of each plot. In the experiment with the corn crop, this determination was also performed in the area used for obtaining the digital photography and the collection of weeds to determine the weed dry matter. These determinations were called NDVI 1 m and Red/ NIR 1 m. In addition, in the corn experiment, the NDVI determination was modified to normalize the variation caused by the straw and bare soil. This manipulation consisted of counting the frequency of NDVI values greater than 0.5 obtained in bare soil and considered only the values above 0.5.
The weed dry matter was evaluated through the collection of existing plants in the 1 m located in the area between the rows of each plot. Weed control was visually evaluated using the percentage scale, where 0 corresponds to no control and 100 corresponds to total control. This evaluation was performed at 15, 29 and 45 days after treatment (DAT) for the soybean experiment and at 17, 28 and
45 DAT for the corn experiment. The grain yield was determined by harvesting the plants in an area of 4.8 m2
per plot. The grain yield was estimated by the weight of the grains harvested in the sampled area corrected to 13% humidity.
The experimental data were subjected to the analysis of variance. Then all variables were analysed through correlation and principal component analysis (PCA). Finally, the weed leaf coverage and the NDVI were analysed using a linear regression considering the weed leaf coverage as the independent variable. These analyses were performed by the program JMP IN version 4 (SAS Institute Inc., Pacific Grove, CA, USA).
RESULTS AND DISCUSSION
The correlation of the weed leaf coverage measured by digital photography with the reflectance indices NDVI and Red/NIR obtained by the GreenSeekerTM
equipment piece in the soybean experiment was 0.711 and -0.693, respectively (Table 1). Soybean grain yield showed an increasing association with the visual control of weeds performed at 15, 29 and 45 DAT (Table 1). The PCA of all variables analysed in the soybean experiment indicated that the first two principal components accounted for 83.6% of the total variance. They were 51.0 and 32.6% for the first and second principal components, respectively, indicating the validity of the analysis with the data obtained. The PCA indicated that the NDVI index and the weed leaf coverage varied together and were
Table 1 - Simple correlation coefficients between the weed infestation parameters, grain yield, and NDVI and Red/NIR reflectance
indices evaluated in the soybean experiment, 2008/09
Parameter
Weed dry matter,
1 m
Weed leaf coverage,
1m
Weed visual control at
15 DAT
Weed visual control at
29 DAT
Weed visual control at
45 DAT
Soybean grain yield
NDVI, plot
Red/NIR, plot
Weed dry matter, 1 m 1.000 0.029 -0.514 -0.535 -0.679 -0.714 -0.026 0.025
Weed leaf coverage, 1 m 1.000 -0.002 -0.041 -0.041 -0.014 0.711 -0.693
Weed visual control at 15 DAT 1.000 0.903 0.857 0.786 -0.027 0.033
Weed visual control at 29 DAT 1.000 0.914 0.822 -0.011 0.023
Weed visual control at 45 DAT 1.000 0.897 -0.025 0.033
Soybean grain yield 1.000 0.048 -0.041
- NDVI, plot 1.000 -0.996
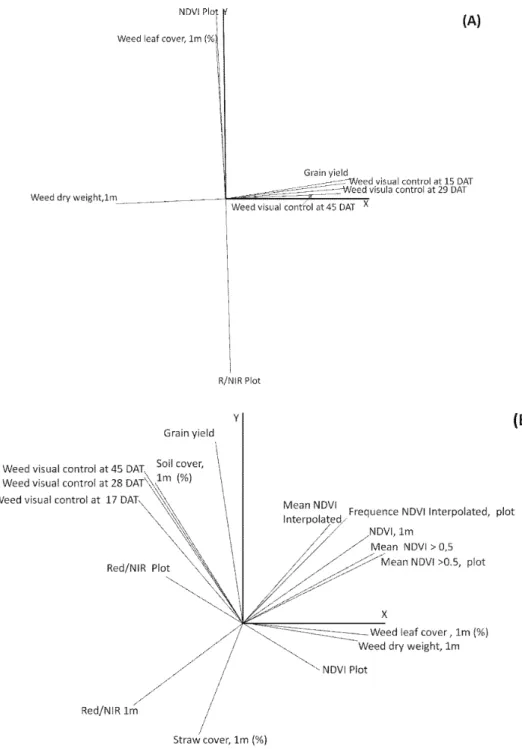
highly related to the variability of treatments (Figure 1A). These variables showed an opposite behavior to that of the Red/NIR index. In addition, the PCA analysis also indicated that the visual weed control was highly associated with grain yield, and that these parameters showed opposite behavior to the weed dry matter (Figure 1A).
The results obtained with the GreenSeeker tool for weed quantification in soybean and corn showed satisfactory performance. In general, this tool has been used to determine the amount of vegetation coverage related to crop canopies without distinguishing its location (Govaerts et al., 2007; Verhulst et al., 2009). In the soybean
Figure 1 - Principal component analysis (PCA) loading plot of the weed infestation parameters, grain yield and NDVI and Red/NIR
experiment, the narrow row spacing was identified as a limiting factor for assessment of weed presence with the GreenSeekerT M
tool. Therefore, a second experiment was conducted with corn. Thus, the larger row spacing in corn could result in better conditions for estimating the reflectance of weeds and its relationship with other methods of interspecific competition quantification. The conditions for using the GreenSeeker™ tool and for achieving the digital photography were optimized in relation to the weed canopy, the horizontal location of the reading, walking speed, and the number of readings per sample area. These determinations were based on studies using the GreenSeekerT M
and WeedSeeker sensors (Sui et al., 2008, Grohs et al., 2009) and digital photography (Gerhards & Christensen, 2003; Rasmussen et al., 2007).
The analysis and manipulation of the data in the experiment with corn were similar to those performed for the soybean trial. However, more detail was obtained in relation to the NDVI index. In addition to obtaining these indices for the whole plot, specific measurements were also performed in the same area used for digital photography and where samples were collected for determination of weed dry matter. In addition, data manipulation was performed by eliminating the NDVI readings lower than 0.5. These readings are related to bare soil or straw and can confound the effect of one or a few small NDVI readings related to weeds when the data of the whole plot is considered. This information was used to obtain the frequency and average NDVI reading. The NDVI obtained in 1 m was associated with weed dry matter and weed leaf coverage, with correlation coefficients of 0.666 and 0.782, respectively (Table 2). Regression analysis of the weed leaf coverage and the NDVI indicated that both have a positive association. In addition, this analysis also indicated that the value of NDVI for bare soil obtained by the value of the intercept coefficient of the linear regression was 0.42 and 0.36 for the soybean and corn experiments, respectively (Figure 2). These values are in accordance with the image shown in the digital photograph of Figure 3.
A gradient of weed interference was established through the use of increasing
doses of herbicides applied at pre- and post-emergence. In the corn experiment, the pre-emergent herbicide treatments resulted in a weed infestation that ranged from 0 to 230.2 g m-2
of dry matter at 25 DAE (data not shown). The effect of interspecific competition in corn observed in similar situations of weed infestation reduced corn grain yield by approximately 50% (Merotto Jr. et al., 2001). Thus,the number of weeds inthe experimental area was satisfactory in regards to the extent required for assessment by different methods of analysis and to the amount that affects crop development. In the soybean experiment, the high weed control obtained since the low herbicide doses used did not provide the variability of weed leaf coverage necessary to obtain this information. The implementation of this methodology is derived from one of the main uses of reflectance sensors related to the prediction of nitrogen fertilization in the top dressing of corn, wheat, and barley (Grohs et al., 2009; Rambo et al., 2010) and for pasture utilization (Trotter et al., 2010). Similarly, the prediction of weed leaf coverage through the NDVI index was conducted on cotton with the WeedSeekerT M
equipment, resulting in a linear model with a determination coefficient of 0.69 (Sui et al., 2008).
The close association of the reflectance indices with weed leaf coverage and weed dry matter (Tables 1 and 2, Figure 1) indicate the possibility of using the GreenSeekerTM
M
ER
O
TT
O
J
R
., A
. e
t a
l.
ta
D
an
in
h
a,
V
iç
os
a-M
G
, v
. 3
0
, n
. 2
, p
. 4
3
7
-4
4
7
, 2
0
1
2
4
2009/10
Parameter
Weed dry matter,
1m
Weed leaf coverage,
1m
Bare soil coverage,
1m
Straw coverage,
1m
Weed visual control at
17 DAT Weed visual control at
28 DAT Weed visual control at
45 DAT Grain yield
NDVI Plot
Red/NIR plot
NDVI, 1m
Red/NIR, 1m
Frequence NDVI >0.5, plot
Mean NDVI >0.5, plot
Frequence NDVI Interpolated,
plot
Mean NDVI Interpolated,
plot
Weed dry matter,
1 m 1.000 0.843 -0.462 -0.300 -0.635 -0.581 -0.530 -0.096 0.479 -0.437 0.666 -0.639 0.506 0.503 0.390 0.673
Weed leaf
coverage, 1 m 1.000 -0.596 -0.299 -0.615 -0.571 -0.550 -0.104 0.498 -0.460 0.782 -0.744 0.583 0.587 0.413 0.813
Bare soil coverage,
1 m 1.000 -0.587 0.443 0.449 0.456 0.204 -0.280 0.269 -0.330 0.293 -0.249 -0.364 -0.202 -0.348
Straw coverage,
1 m 1.000 0.093 0.041 0.011 -0.138 -0.169 0.143 -0.396 0.401 -0.292 -0.159 -0.176 -0.405
Weed visual control at 17 DAT
1.000 0.923 0.909 0.465 -0.332 0.293 -0.491 0.460 -0.333 -0.439 -0.235 -0.539
Weed visual
control at 28 DAT 1.000 0.971 0.546 -0.390 0.356 -0.430 0.401 -0.282 -0.377 -0.228 -0.478
Weed visual control at 45 DAT
1.000 0.576 -0.383 0.354 -0.430 0.403 -0.293 -0.364 -0.223 -0.469
Grain yield 1.000 -0.196 0.201 0.085 -0.099 0.107 0.052 0.091 0.037
NDVI, plot 1.000 -0.995 0.402 -0.378 0.259 0.182 0.295 0.425
Red/NIR, plot 1.000 -0.364 0.343 -0.235 -0.161 -0.290 -0.383
NDVI, 1 m 1.000 -0.995 0.875 0.697 0.760 0.957
Red/NIR, 1 m 1.000 -0.884 -0.700 -0.806 -0.932
Frequence
NDVI>0.5, plot 1.000 0.491 0.708 0.830
Mean NDVI > 0.5,
plot 1.000 0.575 0.669
Frequence NDVI
Interpo-lated, plot 1.000 0.581
Mean NDVI
The efficiency of the GreenSeekerTM
tool in achieving accurate reflectance indices for weed quantification can be evaluated through the correlation between the NDVI index and weed leaf coverage (Figure 2) as well as by comparing the values of each NDVI reading at a distance of approximately 2.5 cm and the corresponding actual presence of weeds based on a digital photograph (Figure 3). It was observed that the NDVI values are approximately 0.3 for straw and increase to 0.73 in the reading that corresponds to the location of the central part of the U. plantaginea plant (Figure 3). This picture indicates that the NDVI index is also discriminatory for plants of U. plantaginea in different stages of development, where the NDVIs for plants with lower and higher leaf areas were approximately 0.50 and 0.73, respectively (Figure 3).
The PCA of the corn experiment indicated that the first two principal components
accounted for 86.5% of the total variance, with 58.5% and 28.0% for the first and second principal components, respectively. The close association between weed dry matter and weed leaf coverage is demonstrated by the proximity of the axes of these variables on the PCA (Figure 1B). In this analysis, it is possible to observe that the NDVI index has a close association with weed leaf coverage and weed dry matter. The NDVI and Red/NIR indices obtained in the entire plot show a low correlation with the weed dry matter and weed leaf coverage obtained by digital photography of the sampling area of 1 linear m (Table 1). This can be explained by variations in the distribution of weeds, straw and bare soil in
Figure 2 - Variation in weed leaf coverage (%) obtained by
digital image and the normalized difference vegetation index (NDVI) obtained by the GreenSeekerTM sensor in the
soybean (A) and corn (B) experiments.
Figure 3 - Example of images taken by digital photography (A), the edited image (B) and the relative normalized difference vegetation index (NDVI) obtained from the same area using the GreenSeekerTM sensor (C).
(A)
(B)
(A)
(B)
each plot. The data modification that considered only the readings higher than 0.5 and the interpolation procedure resulted in only a small increase in the association between weed leaf coverage and weed dry matter in relation to the NDVI of the plot (Table 2, Figure 1).
Considering the relationships with grain yield, the NDVI index measured in the whole plot had a better association with grain yield than the NDVI measurements made only in the sample area of 1 m (Figure 1B), illustrating that as the weed leaf coverage increases, the index NDVI increases and the grain yield of the crop decreases. This relationship was closer when the NDVI was obtained over the whole plot, which was the same area sampled for grain yield. In addition, the PCA shows the association between grain yield and weed control measured by the visual method in relation to the effect of herbicides applied at post-emergence (Figure 1B). This association was closer as the evaluations were conducted later, representing a greater correspondence with the effect of the intensity of the weed competition with crop growth and development.
The evaluation of weed leaf coverage using digital images has been used in several studies. For example, several parameters related to the positioning of the camera, different filters and imaging settings were studied to quantify the coverage of weeds (Rasmussen et al., 2007). Moreover, images from digital photographs were also used for the detection and spraying of herbicides in real-time instrumentations (Gerhards & Christensen, 2003). The quality of information provided by digital photographs is dependent on the resolution of the images. In the present study, the resolution was approximately 0.048 mm2
per pixel, which is more accurate than that reported by Ngouajio et al. (1998) and Rasmussen et al. (2007), which were 1.0 and 0.25 mm2
per pixel, respectively. However, the main purpose of using digital photographs in our study was not as a means of decision making for a particular weed control method. The evaluation of weed infestation through digital imaging was used as a method for weed quantification to be compared with the reflectance indices provided by the GreenSeeker™ equipment. The PCA allows a
general interpretation of the obtained results, enables the identification of the parameters most related to the effect of the treatments and also provides a direct comparison among the evaluated parameters. The PCA has been used similarly in studies related to the effect of environmental and management factors on crop grain yield and biomass (De la Vega et al., 2001; Shukla et al., 2004).
The estimation of weed interference is still one of the main requirements for site-specific weed management. An image processing system that estimates the relative leaf area is described as one of the most adequate methods for this purpose (Burgos-Artizzu et al., 2009). Several sophisticated approaches based on satellite images, robotic systems, and specific tools for weed identification have been developed (Gerhards & Oebel, 2006; Dammer & Wartenberg, 2007; López-Granados, 2011). Most of these tools require high levels of training for operation and have high costs associated with the technology and machinery. These characteristics have resulted in the low adoption of site-specific weed management (Christensen et al., 2009). However, the utilization of multipurpose tools in precision agriculture can increase the adoption of site-specific weed management. The results obtained in this study indicated that the reflectance index NDVI obtained by a ground sensor can be used to differentiate weeds, straw and bare soil and for the quantification of weed interference in row crops. This technology can provide better opportunities for the utilization of the economic weed threshold, resulting in an improvement in weed control, and a reduction in the effect of herbicides and other weed control methods on the environment.
The reflectance index NDVI was correlated with the weed leaf area coverage and weed dry matter in soybean and corn. The GreenSeekerTM
ACKNOWLEDGEMENTS
The authors are grateful to CNPq and CAPES for the fellowships awarded to R A Vidal, I C G R GOULART and A L NUNES.
LITERATURE CITED
ABRAMOFF, M. D.; MAGELHAES, P. J.; RAM, S. J. Image processing with image. J.Biophot. Intern., v. 11, n. 7, p. 36-42, 2004.
BERGE, T. W.; AASTVEIT, A. H.; FYKSE, H. Evaluation of an algorithm for automatic detection of broad-leaved weeds in spring cereals. Prec. Agric.,v. 9, n. 6, p. 391-405, 2008.
BURGOS-ARTIZZU, X. P. et al. Improving weed pressure assessment using digital images from an experience-based reasoning approach. Comp. Electron. Agric., v. 68, n. 2, p. 207-215, 2009.
CHRISTENSEN, S. et al. Site-specific weed control technologies. Weed Res., v. 49, n. 3, p. 233-241, 2009.
DAMMER, K. H.; WARTENBERG, G. Sensor-based weed detection and application of variable herbicide rates in real time. Crop Protec., v. 26,n. 3, p. 270-277, 2007.
DE LA VEGA, A. J.; CHAPMAN, S. C. Genotype by environment interaction and indirect selection for yield in sunflower II. Three-mode principal component analysis of oil and biomass yield across environments in Argentina. Field Crops Res., v. 72, n. 1, p. 39-50, 2001.
EVERMAN, W. J. et al. Critical period of grass vs. broadleaf weed interference in peanut. Weed Technol., v. 22, n. 1, p. 68-73, 2008.
GE, S. et al. Estimating yellow starthistle (Centaurea soslstitialis) leaf area index and abovegroung biomass with the use of hyperspectral data. Weed Sci., v. 55, n. 6, p. 671-678, 2006.
GERHARDS, R.; CHRISTENSEN, S. Real-time weed identification, decision making and path spraying in corn, sugarbeet, winter wheat and winter barley. Weed Res., v. 43, n. 6, p. 385-392, 2003.
GERHARDS, R.; OEBEL, H. Practical experiences with a system for site specific weed control in arable crops using real-time image analysis and GPS-controlled patch spraying. Weed Res., v. 46, n. 3, p. 185-193, 2006.
GOUDY, H. J. et al. Evaluation of site-specific weed
management using a direct-injection sprayer. Weed Sci., v. 49, n. 3, p. 359-366, 2001.
GOVAERTS, B. et al. Evaluating spatial within plot crop variability for different management practices with an optical sensor? Plant Soil,v. 299, n. 1-2, p. 29-42, 2007.
GROHS, D. S. et al. Modelo para estimativa do potencial produtivo em trigo e cevada por meio do sensor GreenSeeker. Eng. Agríc., v. 29,n. 1, p. 101-112, 2009.
JASIENIUK, M. et al. Selection of a barley yield model using information–theoretic criteria. Weed Sci., v. 56, n. 4, p. 628-636, 2008.
JURADO-EXPÓSITO, M. et al. Spatial and temporal analysis of Convolvulus arvensis L. populations over four growing seasons. Europ. J. Agron.,v.21, n. 3, p. 287-296, 2004.
LÓPEZ-GRANADOS, F. Weed detection for site-specific weed management: mapping and real-time approaches. Weed Res., v. 51, n. 1, p. 1-11, 2011.
MATHIASSEN, S. K. et al. The effect of laser treatment as a weed control method. Biosyst. Eng., v. 95, n. 4, p. 497-505, 2006.
MEROTTO JR., A.; VIDAL, R. A.; FLECK, N. G. Variação da competição interespecífica em milho em função do controle de plantas daninhas em faixas. Planta Daninha, v. 19, n. 2, p. 287-294, 2001.
NGOUAJIO, M. et al. Validation of an operator-assisted module to measure weed and crop leaf cover by digital image analysis. Weed Technol., v. 12, n. 3, p. 446-453, 1998.
RAMBO, L. et al. Leaf and canopy optical characteristics as crop-N-status indicators for field nitrogen management in corn. J. Plant Nutr. Soil Sci., v. 173, n. 3, p. 434-443, 2010.
RASMUSSEN, J.; NORREMARK. M.; BIBBY, B. M. Assessment of leaf cover and crop soil cover in weed harrowing research using digital images. Weed Res., v. 47, n. 4, p. 299-310, 2007.
SHUKLA, M. K.; LAL, R.; EBINGER, M. Principal component analysis for predicting corn biomass and grain yields. Soil Sci., v. 169, n. 3, p. 215-224, 2004.
SUI, R.; THOMASSON, J. A.; HANKS, J. Ground-based sensing system for weed mapping in cotton. Comp. Eletron. Agric., v. 60, n. 1, p. 31-38, 2008.
TROTTER, M. G. et al. Evaluating an active optical sensor for quantifying and mapping green herbage mass and growth in a perennial grass pasture. Crop Past. Sci., v. 61, n. 5, p. 389-398, 2010.
VERHULST, N.; GOVAERTS, B.; SAYRE, K. D. Using NDVI and soil quality analysis to assess influence of agronomic management on within-plot spatial variability and factors limiting production. Plant Soil, v. 317, n. 12, p. 41-59, 2009.