Investigations on the mechanism and behavior of dynamic energy
absorption of metal foam
Abstract
Metal foams have been widely used in the engineering fields due to its excellent energy absorption capacity under impact. Under different impact velocities, metal foam exhibits different energy absorption properties. It is important to investigate the mechanism and behavior of energy absorption of metal foam under impact. In this study, a 3D microscopic finite element model (FEM) of metal foam is first established to study energy absorption properties of metal foam. It is shown that the impact energy transfers into kinetic and internal energy of metal foam which varies under impact. The variation can be explained by plastic shock wave, which is produced and then propagates under impact. The theoretical model is proposed to discuss and predict kinetic energy and the difference between dynamic and quasi-static energy absorption behavior of metal foam. Effects of inertia and base material strain rate on plastic shock wave are investigated, and the mechanism of the two effects on dynamic energy absorption properties are studied. The results indicate that base material strain rate effect resists the formation of plastic shock wave, and leads to smaller kinetic energy, but higher internal energy.
Keywords
Dynamic energy absorption, Voronoi model, Plastic shock wave, Kinetic energy, Internal energy, Inertia effect, Base material strain rate
1. Introduction
Metal foams have been being widely used in various engineering fields, such as impact energy absorbers and blast protectors (Gibson and Ashby, 1988; Lu and Yu, 2003) due to their excellent energy absorption property. It is necessary to understand their dynamic energy absorption behavior at different impact velocities.
Some research has been carried out to investigate the energy absorption properties of metal foam. Ramachandra (2003) investigated the energy absorption characteristics of Al foam experimentally under impact velocities ranging from 3 to 30 m/s. The absorbed energy increases marginally under low velocities, but increases significantly at velocities greater than 10 m/s, which was caused by shock wave propagation effects. Gaitanaros et al. (2012) established a numerical model and found that open-cell metal foam absorbed more energy while increasing the impact velocity. Investigations on the closed-cell metal foam carried out by Fang et al. (2014) also validated this conclusion. Liu et al. (2009) studied the kinetic and internal energy of metal foam under impact, and
Geng Luo a
Pu Xue a*
a School of Aeronautics, Northwestern
Polytechnical University, Xi’an, 710072, PR China. E-mail: luogeng814@163.com, p.xue@nwpu.edu.cn
*Corresponding author
http://dx.doi.org/10.1590/1679-78254519
found that as the impact velocity increases, the kinetic and internal energy increases significantly due to inertia effect. According to this literature, it is noted that the energy absorption properties of metal foam under quasi-static and dynamic loadings are dramatically different. These studies discussed the monolithic energy absorption behavior of metal foam. However, there is a lack of deep investigations on these differences, and the mechanism of dynamic energy absorption characteristics of metal foam.
Plastic shock wave occurs in metal foam under impact (Radford, et al. 2005). The dynamic energy absorption properties of metal foam are closely related to the propagation and reflection of plastic shock wave under impact loadings (Cui, et al. 2009; Idris, et al. 2009). Therefore, studying the plastic shock wave is the key solution to reveal the mechanisms of dynamic energy absorption behavior of metal foam. Metal foam exhibits two main dynamic features (Elnasri, et al. 2007; Pattofatto, et al. 2007; Zheng, et al. 2012), deformation localization and stress enhancement due to the plastic shock wave.
Many investigations have been carried out to study the dynamic properties. A one-dimension shock wave model, named as rigid, perfectly-plastic and the locking strain model (R-P-P-L model) was proposed by Reid and Peng (1997) to study the dynamic properties of foam. Lopatnikov et al. (Lopatnikov, et al. 2004) further take into account the elastic deformation of foam under impact, and proposed the elastic, perfectly-plastic, locking strain model (E-P-P-L model). Most researches are concerned about macroscopically mechanical response of metal foam. However, much controversy still exists in the field of plastic shock wave. Literature (Zhang et al. 2014) have shown that plastic shock wave reflects in metal foam, resulting in several plateau stages. The first and the second plateau stages are the so-called first and second compressions. The second one may result in further damage for the structure to be protected, because the stress increases in the second compression.
It is important to study the dynamic properties of metal foam. Hence there are four factors contribute, i.e. (1), inertia effect (Tan, et al. 2005a; Tan, et al. 2005b); (2), base material strain rate effect (Liu, et al. 2009; Liu, et al. 2014); (3), micro inertia effect (Liu, et al. 2009); (4), gas trapped in foam cells (Sadot, et al. 2016; Xu, et al. 2014). Abundant research has been carried out to prove that micro inertia effect and gas trapped in foam cells have minor effect on the stress enhancement (Liu, et al. 2009; Sadot, et al. 2016; Xu, et al. 2014). Some researchers investigated the inertia and base material strain rate effects on dynamic features of metal foam. For example, Liu et al. (Liu, et al. 2009) assumed that base material is rate dependent in their 2D Voronoi model to reveal the effects of inertia and base material strain rate, and found that inertia is a dominant factor which affects the dynamic response of cellular metals. Vesenjak et al. (Vesenjak, et al. 2012) established a 3D finite element model, based on the micro-computer tomography images to carry out the similar research, but obtained the opposite conclusion. Their research indicates that the influence of the material strain rate effect is of much greater importance. Although, all the solutions mentioned above are in the basis of numerical models, the conclusions are quite different. Besides, little theoretical models are proposed to decouple the inertia and the base material strain rate effect on dynamic properties of metal foam. The effects of inertia and base material strain rate on energy absorption properties both have not been reported in literatures.
2. Voronoi model
2.1 3D Voronoi model
The Voronoi model can effectively represent the microstructure of the foam since the cells of the foam vary randomly. In the modeling process, N nucleation points are placed randomly in a 3D block, and the distance between any two nuclei keeps lager than a minimum allowable distance, r. For each nucleus, there is a region around it where any location is closer to this nucleus than any other nucleus. The block then can be divided into N cells. As a result, the Voronoi diagram is constituted by the boundaries of all cells. A Voronoi model with periodic boundaries cut from the Voronoi structure is obtained. The degree of irregularity of foam, k, can be defined as,
0
1
r
k
d
(1)where d0 is defined as the distance between the two nuclei in a regular tetrakaidekahedral foam model with N cells
in the volume V. d0 is given by 1
3 0
2
6
2
V
d
N
(2)In this paper, foam model with dimension 10∗10∗10 mm is constructed.
2.2 Finite element model
The relative density of the metal foam used in the experiment is 0.085, and the same relative density is adopted in this paper. Assuming that the finite element model has uniform thickness of cell wall t, it can be given by
0 s AtotalV t
(3)where ρ0 is the density of metal foam, ρs is density of cell wall material, and Atotal is the total area of cell wall.
The cell wall material properties of aluminum alloy are listed in Table 1, which are provided by Gleich Ltd., Kaltenkirchen, Germany. FE Voronoi models with different degrees of irregularity and cell sizes can be obtained by changing the minimum allowable distance r and the number of nuclei N, as shown in Figure 1 and 2.
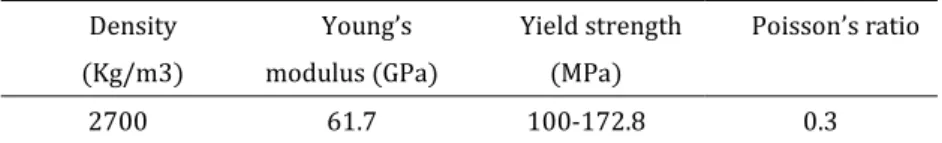
Table 1: Properties of aluminum alloy (Al-Ca-Ti) Density
(Kg/m3)
Young’s modulus (GPa)
Yield strength (MPa)
Poisson’s ratio
(a) (b) (c)
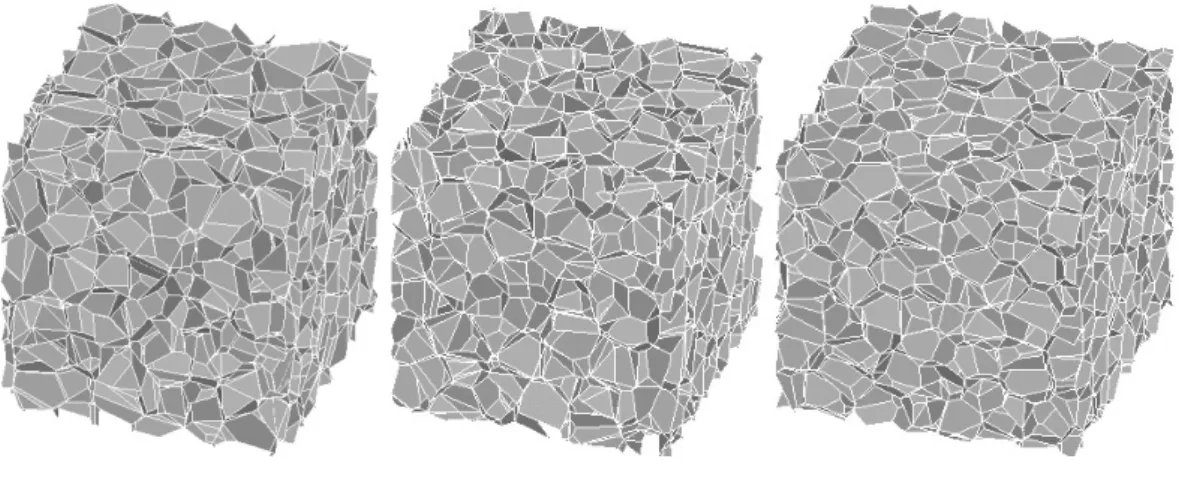
Figure 1: When the number of nuclei N=512, numerical 3D Voronoi models of metal foam with different degree of irregularity: (a) k = 0.4; (b) k = 0.6; (c) k = 0.8.
(a) (b) (c)
Figure 2: When the degree of irregularity k=0.8, numerical 3D Voronoi models of metal foam with different number of nuclei: (a) N = 1000; (b) N = 512; (c) N = 256.
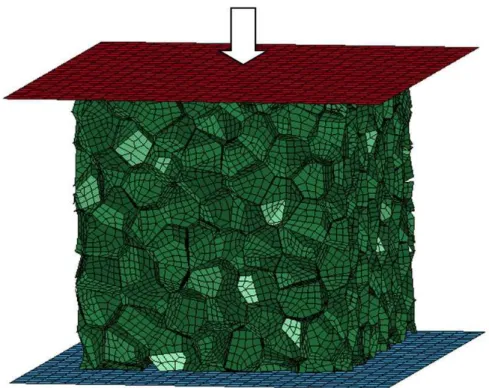
Figure 3: Numerical model of metal foam
When the impact velocity is 150m/s and the number of nuclei is 512, the curves of stress at the impact side of 3D Voronoi model with different degree of irregularity can be obtained, as shown in Figure 4. It is noticed that when the degree of irregularity k=0.6, the stress at the impact side is a little higher than the other two curves. The relationship between the degree of irregularity and plateau stress is complicated, and the similar phenomenon is also reported in Li’s work (Li, et al. 2014).
Figure 4: When the impact velocity is 150m/s and the number of nuclei is 512, the stress at the impact side of 3D Voronoi model with different degree of irregularity
0.0 0.2 0.4 0.6 0.8 1.0
0 2 4 6 8 10 12 14
St
re
ss
(M
Pa
)
Nominal strain k=0.4
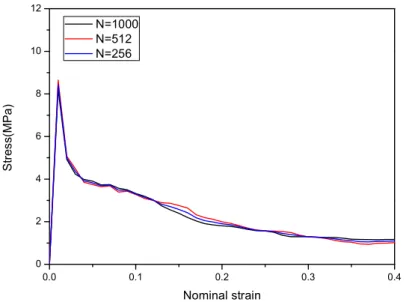
When the impact velocity is 150m/s and the degree of irregularity is 0.8, the curves of stress at the impact side of 3D Voronoi model with different number of nuclei can be obtained, as shown in Figure 5. It indicates that the number of nuclei has little effect on the stress at the impact side of foam.
Figure 5: When the impact velocity is 150m/s and the degree of irregularity is 0.8, the curves of stress at the impact side of 3D Voronoi model with different number of nuclei
According to the mesoscopic image of metal foam, as shown in Figure 6, it is observed that the microstructure of metal foam is very complex. Although the degree of irregularity has minor effect on the plateau stress of metal foam, it is more important to choose an appropriate degree of irregularity to simulate the complex inner structure of metal foam. The microstructure of Voronoi model trends to be more irregular while raising the degree of irregularity, so 0.8 is selected as the degree of irregularity in this paper. On the other hand, considering the calculation speed and precision, 512 is selected as the number of nuclei. Meanwhile, according to Eq. (3), the thickness of cell wall is obtained, and t=0.035mm.
Figure 6: Mesoscopic structure of metal foam
0.0 0.1 0.2 0.3 0.4
0 2 4 6 8 10 12
St
re
ss
(M
Pa
)
Nominal strain N=1000
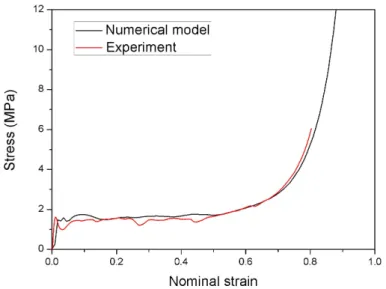
The finite element model with the specific relative density, the degree of irregularity and the number of nuclei is established in this paper. According to the quasi-static experiment carried out in our previous work (Luo, et al. 2016), the numerical model can be validated. As shown in Figure 7, good agreement is achieved, and this indicates the reliability and accuracy of the numerical models.
Figure 7: Validation of the finite element model (Luo, et al. 2016)
3. Dynamic energy absorption properties
In the process of impact, the total energy transfers into internal and kinetic energy of metal foam. In this paper, the energy absorbed by unite volume of metal foam is adopted to describe energy absorption capacity of metal foam.
3.1 Plastic shock wave of metal foam
The energy absorption behavior under impact is much different when comparing with that under quasi-static compression. The plastic shock wave is the main reason which causes the difference.
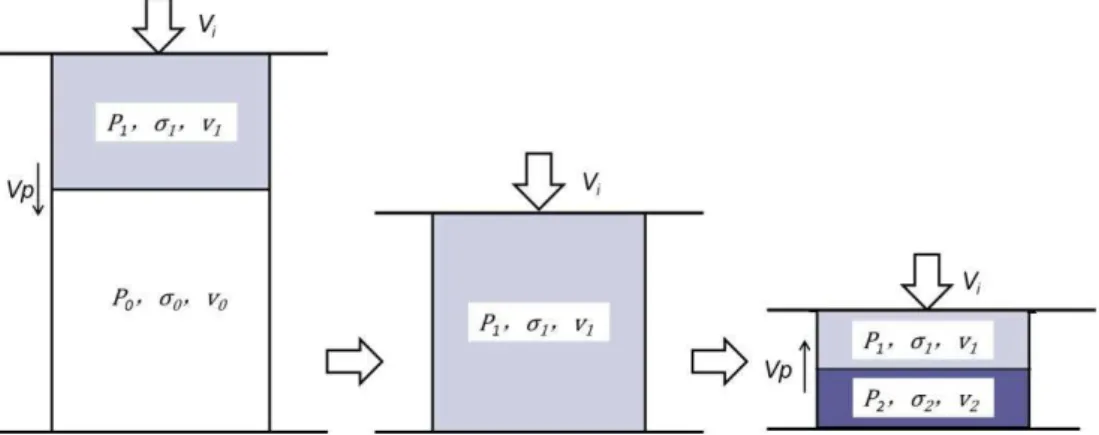
In the basis of the numerical model of metal foam, it is clear that when metal foam is under impact, a densification front exists, and then propagates along the impact direction from impact side to the support side, as shown in Figure 8. The propagation of the densification front also reported in several references (Zhang, et al. 2017; Seitz and Skews 2007; Mazor, et al. 1994). In this paper, the propagation of the densification front is defined as plastic shock wave. When the plastic shock wave arrives at the support side, the first compression comes to the end, and then the plastic shock wave reflects. The stress at the impact side equals to that at the support side and the nominal strain of metal foam can be regarded as the locking strain (Luo, et al. 2016). At the same time, the second compression starts. Figure 9 is the schematic drawing of the plastic shock wave of metal foam. Vi, and Vp is the
impact velocity and plastic wave velocity, respectively. σ1, σ2 and σ3 are the quasi-static plateau stress, first plateau
(a) ε=0 (b) ε=0.1
(c) ε=0.7 (d) ε=0.85
Figure 8: History of plastic shock wave of metal foam under impact. (a) ε=0 (b) ε=0.1 (c) ε=0.7 (d) ε=0.85
Figure 9: Schematic drawing of the propagation and reflection of plastic shock wave in metal foam under impact
3.2 Kinetic and internal energy of metal foam
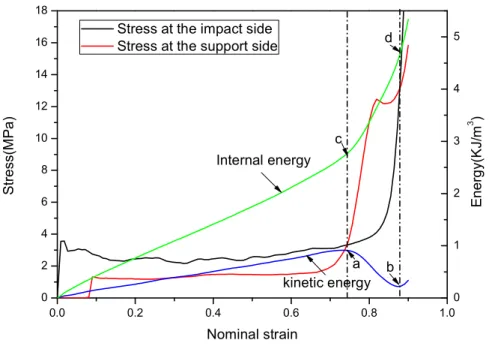
kinetic energy is quite small when the second compression ends as shown in Figure 10. Because elastic energy is not released, and it can lead to small kinetic energy. Besides, transverse motion can cause kinetic energy too.
Figure 10: The variation of kinetic and internal energy of metal foam under impact of 100m/s
Figure 10 also shows the variation of internal energy of metal foam under impact at the speed of 100m/s. It indicates that the internal energy increases during the whole compression. There are two inflexions (points c and d) on the internal energy curve, corresponding to the intersections of the two stress-strain curves. The inflexions mean that the internal energy absorption rate increases when plastic shock wave arrives at the support/stationary side. Because when the plastic shock wave reflects at the support/stationary side, the foam cells before the wave front remains the same, however, the foam cell behind the shock front will be compressed again. Thus, the internal energy absorption rate increases.
3.3 Ratio of kinetic and internal energy of metal foam
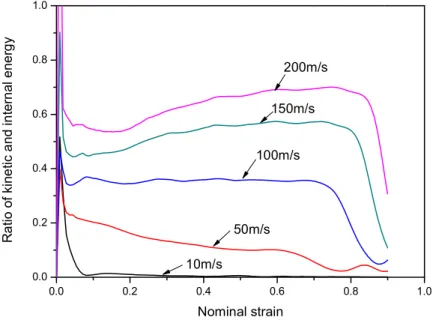
The ratio of kinetic to internal energy of the metal foam can reveal the energy-transfer mechanisms of metal foam under impact, as shown in Figure 11. It shows the ratio of kinetic to internal energy of metal foam under different compressive velocities. It indicates that every curve has a peak at the initial stage. At this moment, the kinetic energy is much higher than the internal energy due to that metal foam obtains an instantaneous kinetic energy from the elastic deformation, but the internal energy still almost equals to zero. After the peak, the ratios remain constant. So, it is believed that the kinetic and internal growth rates are appropriately equal. After this plateau stage, the ratio decreases sharply. Because the kinetic energy decreases, and the internal energy increases at the second compression, so the ratio goes down at this stage. Meanwhile, the metal foam is compressed more compact and the second compression starts at high nominal strain while increasing the impact velocity. Thus, the nominal strains of metal foam corresponding to the inflexions of these curves increase.
Figure 11 also indicates that the ratio of kinetic to internal energy increases with the increase of impact velocity. The ratio is almost 0 when impact velocity is 10m/s, because foam has little kinetic energy under impact of 10m/s, and the deformation mode is similar with quasi-static compression. The ratio is 40% and 70% when the impact
0.0 0.2 0.4 0.6 0.8 1.0
0 2 4 6 8 10 12 14 16 18 En er gy (K J/ m 3 ) St re ss( M Pa ) Nominal strain Stress at the impact side Stress at the support side
velocity is 100m/s and 200m/s, respectively. It is true that most of the impact energy transfers into internal energy of metal foam, but the kinetic energy cannot be ignored under high velocity impact.
Figure 11: Ratio of kinetic to internal energy of metal foam under different impact of different velocity
0.0 0.2 0.4 0.6 0.8 1.0
0.0 0.2 0.4 0.6 0.8 1.0
R
at
io
o
f ki
ne
tic
a
nd
in
te
rn
al
e
ne
rg
y
Nominal strain 10m/s
50m/s 100m/s
4 Theoretical prediction of dynamic energy absorption
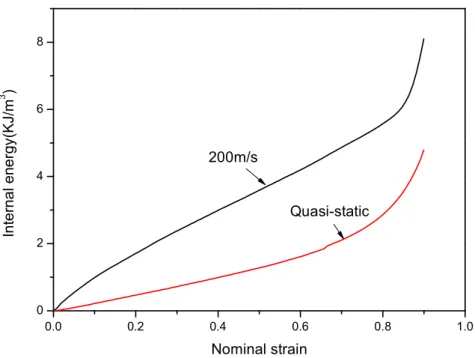
Figure 12: Internal energy under impact of 200m/s and internal energy under quasi-static compression of metal foam Figure 12 shows the curves of the internal energy under impact of 200m/s and quasi-static compression. It is noted that the dynamic internal energy is obviously higher than quasi-static one. Besides, it is known that metal foams are mainly used as structure protectors. The metal foam possesses high kinetic energy under impact, and may cause damage for the structure which should be protected. It is necessary and important to propose a theoretical model to predict the kinetic energy and the difference of dynamic and quasi-static internal energy.
The area below the nominal stress-strain curve is the energy absorbed by metal foam of per unit volume, which can be expressed as,
d d k i d
E E E
(4)qs qs i qs
E
E
(5)where Ed and Eqs donate the total energy absorbed by metal foam under impact and quasi-static compression,
respectively.
E
id andE
iqsare the dynamic internal energy and quasi-static energy, respectively. Ek is the kineticenergy.
d and
qs are the dynamic plateau stress and the quasi-static plateau stress, respectively.
is thenominal strain of metal foam. The following equation can be obtained,
d qs
i i i d qs k
E E E
E
(6)0.0 0.2 0.4 0.6 0.8 1.0
0 2 4 6 8
In
te
rn
al
e
ne
rg
y(
KJ/
m
3 )
Nominal strain 200m/s
According to the 1D shock wave model, 2 0 i d qs lock
v
(7)where Vi is the impact velocity and
lock is the locking strain. The following equation can be obtained,2 0 i
i k
lock
v
E
E
(8)According to the schematic drawing in Figure 9, the foam cells behind the shock wave front move together with the impact plate, and the foam cells before the shock wave front remain stationary with the support side. Assuming that the velocity of the plastic shock wave is vp, the initial volume of foam is V0, the area of cross-section
is S, the initial length is L0, and the mass of the part behind the shock wave front is ms, Ek can be expressed as,
2
2
0 0 0 0
0 0
1
1
2
2
s i
k p i
m v
E
V
S L v t
v
V
V
(9)The relationship between plastic shock wave velocity and locking strain is,
i p
lock
v
v
(10)The following equations can be obtained,
2 0
2
k i
lock
E
v
(11)2 0
2
i k i
lock
E E
v
(12)Eq. (10) shows that
E
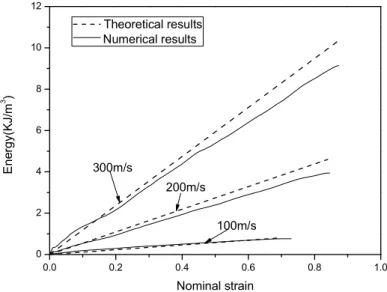
i and Ek are both related to the impact velocity and locking strain. It should be notedFigure 13: Theoretical and numerical and kinetic energy under impact of 300m/s, 200m/s and 100m/s
Figure 13 shows the theoretical and numerical results of Ek. It is noted that the theoretical prediction is quite
close to the numerical results before the nominal strain of 0.5. After that, the plastic shock wave becomes more and more indistinct during the impact process. And the theoretical model over estimates the kinetic energy of metal foam. So, the theoretical results are higher than the numerical results at the end stage of the impact process.
Based on the theoretical model, we can infer that foam can absorb more energy under impact than quasi-static compression, and the extra energy transfers into internal and kinetic energy. Figure 14 shows the theoretical ΔEi
and Ek with different relative densities under impact at different velocities. It is noted that ΔEi and Ek are closely
related to relative density and impact velocity. While increasing the relative density and impact velocity, ΔEi and Ek
enlarges. Plastic shock wave is the main reason which affects the dynamic energy absorption properties of metal foam. Metal foam with larger density and under higher impact velocity possesses more obvious plastic shock wave, resulting in larger ΔEi and Ek.
0.0 0.2 0.4 0.6 0.8 1.0
0 2 4 6 8 10 12
En
er
gy(
KJ/
m
3 )
Nominal strain Theoretical results
Numerical results
300m/s
200m/s
Figure 14: Theoretical energy absorbed by metal foam with different relative densities under impact at different velocities
5. Discussions
The dynamic energy absorption behavior is dependent on the plastic shock wave of metal foam under impact. It is necessary to investigate the factors, i.e. the inertia effect and base material strain rate, which affects the plastic shock wave.
5.1 Plateau stages of stress-strain curves
The propagation and reflection of plastic shock wave generates several compressions of metal foam under impact, which results in several plateau stages of the stress-strain curves.
Figure 15 shows the stress at the impact side and the support side of metal under impact of 100m/s which is obtained by the numerical model. It is noted that the stress-strain curves have two plateau stages in Figure 15, i.e. the first plateau stage (a-b stage), and the second plateau stage (c-d stage). The stress at the impact side is higher than that at the support side during the first plateau stage, because the plastic shock wave propagates from the impact side to the support side during this stage, and the plastic shock wave results in a plateau stage in the stress and strain curves. However, the stress at the support side increases rapidly and is much higher than that at the impact side during the second plateau stage, because the plastic shock wave reflects at the point b and then propagate from the support side to the impact side during this stage. This process is quite short, and the second plateau stage is much shorter than the first one.
50 100 150 200 250 300 0
4 8 12 16 20 24
En
er
gy
(K
J/
m
3 )
Velocity (m/s) 10%
Figure 15: The stress-stain curves of metal foam under impact of 100m/s
5.2 Inertia effect
When the base material of metal foam is strain rate insensitivity, the plateau stress of the first compression can be expressed as base on the R-P-P-L model (Tan, et al. 2005b):
2 0 1 0 1sti
lock
v
(13)where σ0 donates the quasi-static plateau stress,
lock1st donates the locking strain of the first compression.Similarly, the plateau stress of the second compression can be predicted by:
2 1 2 1 2ndi
lock
v
(14)where
lock2nd is the locking strain of the second compression.Assuming that the initial volume of the metal foam is V0 and the volume of the metal foam when the first
compression comes to the end. The following equations are obtained:
0 0
V
1 1V
(15)1 1
0
1
st
lock
V
V
(16)0.0 0.2 0.4 0.6 0.8 1.0
0 5 10 15 20
st
re
ss(
M
Pa
)
nominal strain stress at the impact side stress at the support side
a b
According to our previous work (Luo, et al. 2016), the nominal strain of metal foam when the plastic shock
wave arrives at each side is defined as the locking strain. Assuming that
1nst and
n2nd are the nominal strain ofmetal foam when the first and second compression ends, respectively, the following equation can be obtained:
2nd 2nd
lock n
(17)Substitute Eq. (13), (14), (15) into (12),
2 0
2 1 2nd 1 i 1st
n n
v
(18)
Eq. (13) and (18) can be used to predict the first and second plateau stress, respectively. Based on the theoretical model which is established before, the prediction of the first and the second plateau stress is obtained, as shown in Figure 16 and Figure 17.
Figure 16: Theoretical and numerical results of the first plateau stress under impact of different velocities 20 40 60 80 100 120 140 160 180 200 220
0 2 4 6 8 10 12 14
Pl
at
ea
u
st
re
ss(
M
Pa
)
Velocity(m/s) Numerical results
Figure 17: Theoretical and numerical results of the second plateau stress under impact of different velocities It is noted that the first and second plateau stresses all increase when raising the impact velocity. Theoretical equations can predict the plateau stress well. However, the theoretical predictions are a little higher than the numerical results. Because it is assumed that there is still obvious plastic shock wave during the second compression in the theoretical model. However, the relative density in the second compression is larger than that in the first compression, and the prescribed velocity is not high enough to cause obvious stress enhancement . So, the theoretical model over evaluates the second plateau stress.
5.3 Base material strain rate effect
The Voronoi numerical model is used to study the effect on the plateau stress when the base material is rate sensitivity. The well-known Cowper-Symonds material model is used to describe the material rate sensitivity (Li, et al. 2016), as follow:
11 p
d qs
ys ys
c
(19)
Where
dys and
qsys represent dynamic yield stress and quasi-static yield stress.
is the stain rate. Accordingto the literature, c=6500,p=4 (Su, et al. 1995).
50 60 70 80 90 100
0 5 10 15 20
Pl
at
ea
u
st
re
ss(
M
Pa
)
Figure 18: Base material strain rate sensitivity under impact of 100m/s
Figure 18 shows the stress-strain curves when the base material is rate sensitivity or not under impact of 100m/s. It is noted that base material stain rate has caused a significant stress enhancement on metal foam. According to Li’s work (Li, et al. 2016), the stress enhancement during the first compression caused by base material strain rate can be expressed as,
1
2 0
1 0 0 1
p i lock
v
c
(20)Similarly, the stress enhancement during the second compression caused by base material strain rate is,
1 2 1
2 1 1 2
p i lock
v
c
(21)Substituting Eq. (19) and (20) into (21), the following equation can be obtained,
1
2 0
2 1 1 1 2 1
p i
n n n
v
c
(22)0.0 0.2 0.4 0.6 0.8 1.0 0 20 40 60 80 100 120 St re ss (M Pa ) Nominal strain
Figure 19: Theoretical and numerical results of the first plateau stress under impact of different velocities when the base material is stain rate sensitivity
Figure 20: Theoretical and numerical results of the second plateau stress under impact of different velocities when the base material is stain rate sensitivity
Figure 19 and Figure 20 show the first and second plateau stress of metal foam under impact when the base material is strain rate sensitivity. The plateau stress is much higher with base material strain rate sensitivity than that with strain rate insensitivity, and keeps increasing. The theoretical predictions fit the numerical results. However, the predictions of the second plateau stress are smaller than numerical results, Because the stain rate of foam under impact is uncertain due to the localized deformation. The initial length is chosen to calculate the stain rate. It is correct when foam is under low velocity impact. However, the deformation area concentrates on the impact side when foam is under high impact. As a result, the numerical results are higher than theoretical results.
0 40 80 120 160 200
0 2 4 6 8 10 12 14 16
St
re
ss
(M
Pa
)
Velocity (m/s) Numerical results
Theoretical results
80 90 100 110 120
0 4 8 12
St
re
ss
(M
Pa
)
Velocity (m/s) numerical results
5.4 Effects of inertia and base material strain rate on dynamic energy absorption properties
The base material strain rate sensitivity has significant effect on the kinetic and internal energy of metal foam under compression. In the basis of the numerical model, the characteristics of kinetic and internal energy is investigated.
Figure 21: Kinetic energy of metal foam when the base material is strain rate sensitivity or not under impact of 200m/s and 100m/s
Figure 21 shows the kinetic energy of foam when the base material is strain rate sensitivity or not. It is noted that at the initial stage the kinetic energy of metal foam is a little higher when base material is stain rate insensitivity, but is much lower at the peak. According to our previous work (Li, et al. 2016), base material strain rate effect can resist the formation of plastic shock wave. So, the peak of the kinetic energy is much smaller when the base material is strain rate sensitivity.
0.0 0.2 0.4 0.6 0.8 1.0
0.0 0.5 1.0 1.5 2.0 2.5
Kinetic energy without strain rate sensitivity
Ki
ne
tic
e
ne
rg
y(
KJ)
Nominal strain Kinetic energy with strain rate sensitivity
200m/s
Figure 22: Internal energy of metal foam when the base material is strain rate sensitivity or not under impact of 200m/s and 100m/s
Figure 22 shows the internal energy of foam when the base material is strain rate sensitivity or not. It is noted that the strain rate sensitivity can significant improve the internal energy.
6. Conclusions
In this paper, a 3D Voronoi numerical model is established to study the dynamic energy absorption behavior of metal foam. Theoretical model based on the 1D shock wave theory is proposed to investigate the mechanisms of dynamic energy absorption. The effects of inertia and base material strain rate on plastic shock wave of metal foam are investigated numerically and theoretically. The conclusions are listed as follows:
(1) Plastic shock wave causes the dynamic energy absorption properties of metal foam. Kinetic and internal energy vary with the propagation and reflection of plastic shock wave. Kinetic energy reaches several highest or lowest values, but internal energy maintains growth during the impact process. Most of impact energy transfers into kinetic energy, but kinetic energy cannot be ignored under high velocity impact.
(2) Metal foam with larger density and under higher impact velocity possesses more obvious plastic shock wave, resulting in larger energy absorbed by metal foam.
(3) Base material strain rate effect of metal foam resists the formation of plastic shock wave, and leads to smaller kinetic energy, but higher internal energy.
(4) Metal foam has more than once plateau stages under impact due to the propagation and reflection of plastic shock wave. The first and second plateau stresses are closely related to the impact velocity, relative density and base material strain rate. Stress at the support side is lower than that at the impact side during the first compression, but increases sharply and become much higher than that at the impact side during the second compression.
0.0 0.2 0.4 0.6 0.8 1.0
0 2 4 6 8 10 12 14
In
te
rn
al
e
ne
rg
y(
KJ)
Nominal strain
Internal energy with strain rate sensitivity Internal energy without strain rate sensitivity
200m/s
Acknowledgement
The authors highly acknowledge the financial support from National Nature Science Foundation of China under Grants No. 11472226 and 11672248. The authors also acknowledge the financial support from Innovation Foundation for Doctor Dissertation of Northwestern Polytechnical University.
References
Cui, Liang, Stephen Kiernan, and Michael D. Gilchrist, (2009). Designing the energy absorption capacity of functionally graded foam materials. Materials Science and Engineering: A 507(1-2):215-225.
Elnasri, I., et al., (2007). Shock enhancement of cellular structures under impact loading: Part I Experiments. Journal of the Mechanics & Physics of Solids 55(12):2652-2671.
Fang, Qin, et al., (2014). A 3D mesoscopic model for the closed-cell metallic foams subjected to static and dynamic loadings. International Journal of Impact Engineering.
Gaitanaros, Stavros, Stelios Kyriakides, and Andrew M. Kraynik (2012). On the crushing response of random open-cell foams. International Journal of Solids and Structures 49(19-20):2733-2743.
Gibson, L. J. A. A., and M. F. Ashby (1988). Cellular Solids: Structure And Properties. Cambridge University Press.
Idris, M. I., T. Vodenitcharova, and M. Hoffman (2009). Mechanical behaviour and energy absorption of closed-cell aluminium foam panels in uniaxial compression. Materials Science and Engineering: A 517(1-2):37-45.
Li Z, Zhang J, Fan J, et al., (2014). On crushing response of the three-dimensional closed-cell foam based on Voronoi model[J]. Mechanics of Materials, 68(1):85-94.
Li, L., P. Xue, and G. Luo, (2016). A numerical study on deformation mode and strength enhancement of metal foam under dynamic loading. Materials & Design 110:72-79.
Liu, Y. D., et al., (2009). A numerical study on the rate sensitivity of cellular metals. International Journal of Solids and Structures 46(22-23):3988-3998.
Liu, Yan, Weiwei Gong, and Xiong Zhang, (2014). Numerical investigation of influences of porous density and strain-rate effect on dynamical responses of aluminum foam. Computational Materials Science 91:223-230.
Lopatnikov, Sergey L., et al., (2004). High-velocity plate impact of metal foams. International Journal of Impact Engineering 30(4):421-445.
Lu, Guoxing, and Tongxi Yu, (2003). Energy Absorption of Structures and Materials. Energy Absorption of Structures & Materials:385–400.
Mazor G, Ben-Dor G, Igra O, et al. (1994). Shock wave interaction with cellular materials[J]. Shock Waves 3(3):159-165.
Pattofatto, S., et al. (2007). Shock enhancement of cellular structures under impact loading: Part II analysis. Journal of the Mechanics & Physics of Solids 55(12):2672-2686.
Radford, D. D., V. S. Deshpande, and N. A. Fleck, (2005). The use of metal foam projectiles to simulate shock loading on a structure. International Journal of Impact Engineering 31(9):1152-1171.
Ramachandra, S., (2003). Impact energy absorption in an Al foam at low velocities. Scripta Materialia 49(8):741-745.
Reid, S. R., and C. Peng, (1997). Dynamic uniaxial crushing of wood. International Journal of Impact Engineering 19(5):531–570.
Sadot, O., et al., (2016). The trapped gas effect on the dynamic compressive strength of light aluminum foams. Materials Science and Engineering: A 659:278-286.
Seitz M W, Skews B W. (2007). An analytical model for shock wave impact on compressible open-cell foam[J]. Shock Waves 16(4-5):287-298.
Su, X. Y., T. X. Yu, and S. R. Reid, (1995). Inertia-sensitive impact energy-absorbing structures part II: Effect of strain rate. International Journal of Impact Engineering 16(4):673-689.
Tan, P. J., et al. (2005a). Dynamic compressive strength properties of aluminium foams. Part I—experimental data and observations. Journal of the Mechanics and Physics of Solids 53(10):2174-2205.
Tan, P. J., et al. (2005b). Dynamic compressive strength properties of aluminium foams. Part II—‘shock’ theory and comparison with experimental data and numerical models. Journal of the Mechanics and Physics of Solids 53(10):2206-2230.
Vesenjak, M., C. Veyhl, and T. Fiedler, (2012). Analysis of anisotropy and strain rate sensitivity of open-cell metal foam. Materials Science and Engineering: A 541:105-109.
Xu, Shanqing, Dong Ruan, and Guoxing Lu, (2014). Strength enhancement of aluminium foams and honeycombs by entrapped air under dynamic loadings. International Journal of Impact Engineering 74:120-125.
Zhang J, Fan J, Wang Z, et al. (2017). Shock enhancement of cellular materials subjected to intensive pulse loading[J]. Shock Waves (5–6):1-15.
Zhang Jian, Zhao Guiping, Lu Tianjian, (2014). High speed compression behaviour of metallic cellular materials under impact loading. Explosion and Shock Waves 34(3):278-284.