DOI: https://doi.org/10.1590/2446-4740.001018 Volume 34, Number 3, p. 217-225, 2018
Introduction
The mechanisms of voice production are of great complexity (Pontes et al., 2005). There are many laryngeal diseases that cause changes in the voice. These pathologies may be of organic origin, such as nodules, cysts or edemas, or of neurological origin, such as paralysis in the vocal folds (Davis, 1979; Quek et al., 2002). The laryngeal pathologies nodule, Reinke’s edema and paralysis in the vocal folds are widely used in studies involving the classification of laryngeal pathologies in adults, both male and female (Barbosa-Branco and Romariz, 2006; Costa et al., 2013; Cummings, 2008; Pinho et al., 2016).
The methods of acoustic evaluation have raised interest in research for the development of tools to support the diagnosis of laryngeal pathologies, because
it is a less traumatic method, not causing discomfort to the patient, when compared to traditional examinations for the detection of laryngeal pathologies. The methods of acoustic evaluation can be used both to evaluate the quality of voice, to perform pre-diagnosis of laryngeal pathologies, as well as the evolution of a medical or post-surgical treatment (Rabiner and Schafer, 1978).
There are several nonlinearities involved in vocal fold vibration and glottal wave generation. Due to such factors, classical methods of data analysis based on a linear model have been enriched with methods that are derived from the theory of nonlinear dynamical systems (Jiang et al., 2006). Over the last two decades, researches considering the techniques of nonlinear dynamical systems and chaos theory include: phoneme classification (Kokkinos and Maragos, 2005), automatic speaker recognition (Reynolds and Heck, 2000), discrimination between healthy and pathological voices (Henriquez et al., 2009), diagnosis of laryngeal pathologies and effects of clinical treatments (Awan et al., 2010; Chai et al., 2011; Vaziri et al., 2010).
This paper has as main objective to increase the classification rates between healthy or pathological voices, as well as to discriminate between pathologies (discrimination among pathologies is still little explored in the literature) by using a more efficient method to estimate one parameter used in nonlinear dynamical analysis (NDA). This parameter is the reconstruction
KSG estimation of reconstruction delay to detect vocal disorders in
nonlinear dynamical analysis
Mikaelle Oliveira Santos
1*, Juliana Martins de Assis
1, Vinícius Jefferson Dias Vieira
1,
Francisco Marcos de Assis
11Department of Electrical Engineering, Federal University of Campina Grande, Campina Grande, PB, Brazil.
Abstract Introduction: This research investigates the applicability of a relatively new estimator of mutual information, KSG estimator, to find the reconstruction delay of phase space in dynamical systems. There are evidences that the KSG estimator is more accurate than the naive method commonly used. Methods: In this paper we estimated mutual information between the voice signals and their delayed versions, with KSG method. The voice signals were obtained from a disordered voice database. Then, we found the reconstruction delay where mutual information reached its first minimum. We applied the encountered value of reconstruction delay in linear discriminant analysis, in order to discriminate between healthy and pathological voices or to discriminate between pathologies. Discrimination between voice pathologies using nonlinear measurements is still not much explored. Moreover, in this paper we used a single nonlinear measurement: reconstruction delay. Results: The results show that the reconstruction delay obtained with KSG method has increased classification rates in most cases, in terms of accuracy, sensitivity and specificity, when compared to the naive estimator usually adopted. Conclusion: The KSG estimator is a promising technique to improve the diagnosis of voice related pathologies.
Keywords KSG estimator, Reconstruction delay, Vocal disorders.
This is an Open Access article distributed under the terms of the Creative Commons Attribution License, which permits unrestricted use, distribution, and reproduction in any medium, provided the original work is properly cited.
How to cite this article: Santos MO, Assis JM, Vieira VJD, Assis FM. KSG estimation of reconstruction delay to detect vocal disorders in nonlinear dynamical analysis. Res Biomed Eng. 2018; 34(3): 217-225. DOI: 10.1590/2446-4740.001018
*Corresponding author: Rua Professora Joana D’arc Ferreira de Arruda, 641, José Pinheiro, CEP 58407-380, Campina Grande, PB, Brazil. E-mail: [email protected]
delay. Fraser and Swinney (1986) introduced a method for estimating the reconstruction delay as the first minimum of the mutual information in place of the interval in which autocorrelation first crosses zero. Mutual information is an established concept from information theory, which measures dependency between random variables and was firstly introduced to measure channel capacity (Cover and Thomas, 2006; Shannon and Weaver, 1949). By estimating mutual information with a more efficient mutual information estimator, which was proposed by Kraskov et al. (2004) and is called here KSG estimator, we could observe improved classification rates. These results were obtained in contrast with the naive estimator commonly used (which is based on adaptive partitioning).
Methods
This section presents the methods and data used in this paper in order to compare and to improve the classification rates in NDA.
Naive estimation of reconstruction delay As mentioned above, to find the reconstruction delay it is often used the average mutual information method (Fraser and Swinney, 1986). According to this method, one can ensure reconstruction vectors with the lowest level of redundant information, yet still correlated. Information theory aims to identify how much information a measurement made at a given time t has when observing another measurement, of the same signal, at a later time t+ τ (Kantz and Schreiber, 2004).
The average mutual information between x t( ) and its outdated version x t( + τ) with the naive estimator is obtained from a histogram of b bins, created to estimate the probability distribution of the data signal x t( ) (Costa et al., 2012):
( )
(
( ) ( ))
(
(
( )( ) ()
(
( ))
))
1 1
, , log
b b ij
ij
i j i j
p x t x t
I p x t x t
p x t p x t
= =
+ τ
τ = −∑ ∑ + τ + τ (1)
where p x ti
( )
( ) is the probability estimate that the signal ( )x t takes a value within the i-th histogram interval,
( )
(
)
jp x t+ τ is the probability estimate that x t( + τ) is the j-th histogram interval and pij
(
x t x t( ) (, + τ))
is the probability estimate that x t( ) is in i-th interval and( )
x t+ τ in j-th interval (Kantz and Schreiber, 2004). The reconstruction delay, then, is the value of τ for which the average mutual information function reaches its first local minimum (Fraser and Swinney, 1986).
However, there is evidence that the naive estimator for mutual information, obtained as above from histograms, is severely biased (Assis et al., 2016; Darbellay and Vajda, 1999). That is, the estimated mutual information
value may not depict a true mutual information value nor a value close to the true mutual information value. This happens because this estimate strongly depends on the number b of bins (segments) used.
KSG estimation of reconstruction delay
Kraskov et al. (2004) developed a mutual information estimator (KSG estimator). KSG estimator is based on the work of Kozachenko and Leonenko (1987), which estimates entropy based on the k-th nearest neighbour distances. Mutual information can be written as (Equation 2):
( ; ) ( ) ( ) ( , )
I X Y =H X +H Y −H X Y (2)
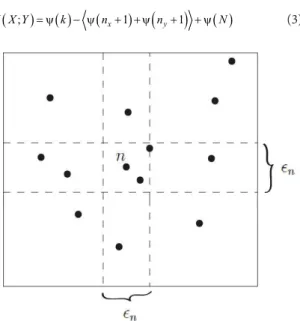
The basic idea of KSG estimator is to use different neighbours to estimate the marginal entropies H X( ) and H Y( ) and to estimate the joint entropy H X Y( , ) in order to cancel estimation bias. There are two slightly different estimators made by Kraskov et al. (2004) with similar performance, one of these is adopted here. This estimator considers the distance of each point to its k-th nearest neighbour, projects the distance in relation to X and Y and considers the wider spacing of the two:
max ,
2 2 2
y x
∈ ∈
∈
=
. With these distances it is possible to count the number of points nx and ny in relation to X and Y which are at a distance strictly less than the spacing
2
∈,
as illustrated in Figure 1. The estimate is performed as:
( ; ) ( ) ( x 1)
(
y 1)
( )I X Y = ψ k − ψ n + +ψ n + + ψ N (3)
Figure 1. Determination of ∈n, nx and ny for the KSG algorithm, for
2
k= and a data sample realization (indicated by n). In this example, 3
x
where
<
⬚>
denote the arithmetic mean, k is the number of neighbours considered, N is the sample size and ψ is the Digamma function. In this application of estimating reconstruction delay, just like with the naive method, each speech signal was delayed by τ and then mutual information was estimated between the original signal samples and the samples of the delayed signal. The number of samples of the speech signal was the number of samples to estimate mutual information.If the distributions are very skewed and/or uneven, the authors of the method suggest to transform them so as to become more uniform (or at least singlehumped and more or less symmetric). In this case the KSG estimator gave excellent results after transforming the variables to x′ =logx and y′ =logy.
Figure 2 illustrates reconstructed phase space examples with the optimum KSG estimated reconstruction delay τ to all speech classes considered in this paper.
Experimental data
The Disordered Voice Database (Model 4337, of the Kay Elemetrics, recorded by Massachusetts Eye and Ear Infirmary (MEEI) Voice and Speech Lab (Kay Elemetrics Corp., 1994) was used in the experiments. There were 53 talkers voice signals with healthy larynges and 118 talkers voice signals affected by laryngeal pathologies (55 voice signals of larynges affected by
paralysis in the vocal folds, 45 voice signals of larynges affected by Reinke’s edema, and 18 voice signals of larynges affected by vocal nodules). The voice signals are from sustained vowel /a/. The voice signals of healthy larynges, originally sampled at 50000 samples/s, were sub-sampled to 25000 samples/s to match the sampling rate of the voice signals of pathological larynges.
Five classes of signals were considered in this study: healthy voice (SDL), voice signal with paralysis on vocal folds (PRL), voice signal with Reinke’s edema (EDM), voice signal with nodules on vocal folds (NDL) and all pathologies grouped (PTL). The linear discriminant analysis was used to investigate seven cases of discrimination: SDL vs. PTL, SDL vs. PRL, SDL vs. EDM, SDL vs. NDL, PRL vs. EDM, PRL vs. NDL, and EDM vs. NDL.
Classification
The selected voice signals database are analyzed by estimating reconstruction delay. Then, linear discriminant analysis and the statistical model using Cross-Validation k-fold stratified were performed to detect the presence of voice disorders caused by Reinke’s edema, paralysis on vocal folds and nodules on vocal folds pathologies and to compare with the results obtained using the naive estimator. In this work, the value of k is equal to 10 in the cross-validation process.
Initially, the classification performance is analyzed considering only two groups signals: one with all grouped pathologies and other with healthy voices (SDL vs. PTL). Posteriorly, the classification performance is analyzed among the other six classification cases: SDL vs. PRL, SDL vs. EDM, SDL vs. NDL, PRL vs. EDM, PRL vs. NDL, and EDM vs. NDL.
Evaluation and interpretation
In order to measure the accuracy of classifiers in each study case, three measures are commonly used: accuracy, sensitivity and specificity. These measures are related to the ability of a classifier in diagnosing a disease in a sick patient (True Positive - TP) or healthy patient (False Positive - FP), or, still, diagnosing a healthy state in a healthy patient (True Negative - TN) or sick patient (False Negative - FN) (Costa et al., 2012).
The accuracy of classification measures the global correct classification rate, reflecting the ability of the classifier to identify correctly when there is a disorder. The accuracy is defined as the ratio between the number of correctly classified cases and all presented cases to classifier (Costa et al., 2012):
TP TN Accuracy
TP TN FP FN
+ =
+ + + (4)
The sensitivity of classification measures the classifier ability to identify the disorder when it actually exists. Sensitivity is defined as the ratio between the number of correctly classified cases with the disorder and the total number of cases of the disorder:
TP Sensitivity
TP FN
=
+ (5)
The specificity of classification measures the ability of the classifier to identify the absence of the disorder when it actually does not exist. Specificity is defined as the ratio between the number of correctly classified healthy cases and the total number of healthy cases:
TN Specificity
TN FP
=
+ (6)
The classifier presents high performance if it is able to obtain high values for accuracy, sensitivity and specificity. The representation of sensitivity and specificity is clearer when it comes to discrimination between healthy and pathological classes. When there is discrimination between pathologies, it must be defined in the classifier which group will have its correct classification measured by sensitivity and which group will have its correct classification measured by specificity.
Results
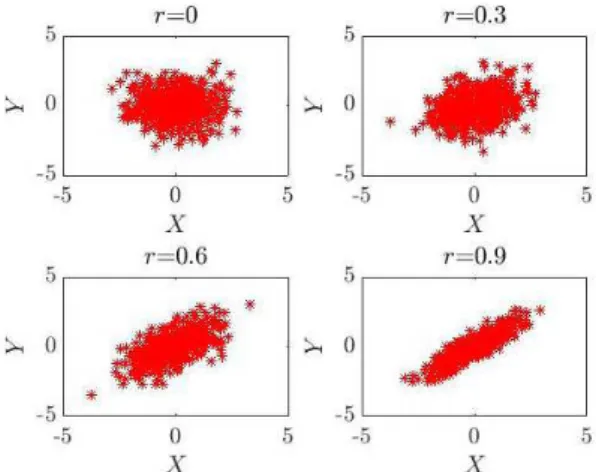
Before presenting the classification results, in this section we evaluate both naive and KSG estimators using synthetic signals. In the simulations, we generated bivariate Gaussian datasets, with 0 mean, unit variance and specific values for correlation coefficients: r=0,
0.3
r= , r=0.6 and r=0.9. Figure 3 presents bivariate Gaussian datasets, with sample size N=500.
For these cases, there is an analytical value for mutual information, which can be used to compare the estimates:
( ; ) log 11
(
2)
2
I X Y = − −r (7)
Figure 4 illustrates the estimation with both methods. It is visible from the simulations that KSG estimator is minimally biased, that is, the mean of the estimator is close to the analytical mutual information value, for all five values of tested k. However, there is a huge variation in the naive estimates according to the number of bins used. The mean value of the naive estimates does not generally fit the analytical mutual information value, especially when using more bins.
Now we present the results obtained from the classification process of healthy and pathological voices in order to investigate the discriminatory potential of a more precisely estimated reconstruction delay. The objective is to compare the detection and the discrimination of voice disorders with the results obtained with the naive estimator. The voice disorders analyzed here are Reinke’s edema, paralysis on the vocal folds and nodules on the vocal folds.
Reconstruction delay estimation
Initially we estimate the value of reconstruction delay using the naive estimator and the KSG estimator, in order to compare which method was able to estimate
Figure 4. Mutual information estimates using the naive estimator (A) and the KSG estimator (B). The naive estimates are plotted as a function of the number of bins used in the procedure. The KSG estimates are plotted as a function of the number of neighbours used in the estimation. The data
had Gaussian distributions with zero mean, unit variance and correlation coefficients r=0, r=0.3, r=0.6 and r=0.9, in each panel. Solid blue lines indicate mean values over 100 trials, each trial with sample size 400, dashed blue lines indicate 10% to 90% of the values, whereas red lines indicate analytical mutual information value.
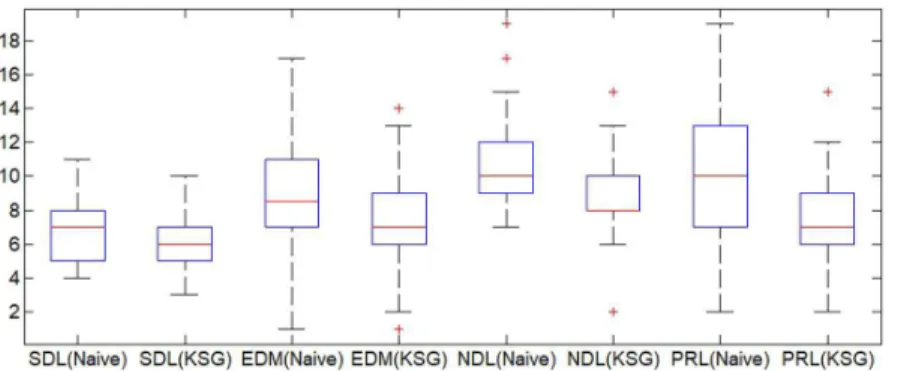
lower values. This was an interesting investigatory step, since it is desirable to estimate the lowest value of τ that reduces redundant information among vectors. Figure 5 illustrates the distribution of average values of τ for signals of healthy voices (SDL) and signals of pathologies with Reinke’s edema (EDM), nodules (NDL) and paralysis (PRL). We used both naive and KSG estimators. When using KSG estimator, we used the parameter k=3, as recommended in literature (Kraskov et al., 2004).
The results presented in Figure 5 revealed some differences in values of reconstruction delay between naive estimator and KSG estimator for all classes considered. In some cases the values of reconstruction delay fall more than a half. For example, for edema class, the naive method estimates a value of reconstruction delay τ =16 while KSG
estimator estimates a value τ =8 to the same speech signal. For nodule class, the naive method estimates a value of reconstruction delay τ =15 while KSG estimator estimates a value τ =7 to the same speech signal. For paralysis class, the classical method estimates a value of reconstruction delay τ =20 while KSG estimator estimates a value τ =9
to the same speech signal.
method, we used Wilcoxon rank sum test. The obtained results were: SDL(Naive) x SDL(KSG) – p= 0.0042 and h=1, EDM(Naive) x EDM(KSG) – p= 0,0001and h=1, NDL(Naive) x NDL(KSG) – p= 0.0005 and
h= 1, PRL(Naive) x PRL(KSG) – p= 06
1.1467e− and h= 1, SDL(KSG) x EDM(KSG) – p= 0.0003 and h= 1, SDL(KSG) x NDL(KSG) – p= 7.6711e−05
and h= 1, SDL(KSG) x PRL(KSG) – p= 0.0041
and h= 1, SDL(KSG) x PTL(KSG) – p= 05
7.3534e− and h= 1, EDM(KSG) x NDL(KSG) – p= 0.1017 and h= 0, PRL(KSG) x EDM(KSG) – p= 0.6084 and h= 0, PRL(KSG) x NDL(KSG) – p=0.0314 and h=1.
Thus, there are significant differences between KSG estimated τ and naive estimated τ for all considered
classes. When using KSG method to estimate τ, we
observe that the comparison of SDL x EDM, SDL x NDL, SDL x PRL, SDL x PTL and PRL x NDL presented significant statistical differences among the estimated τ. We observe that the only cases where there was not a significant difference between KSG estimated τ were the comparisons EDM x NDL and PRL x EDM.
Classification between healthy voices versus affected voices by pathologies
This section presents the results obtained between healthy voice signals (SDL) and voice signals affected by diseases, Reiken’s Edema (EDM), Paralysis (PRL) and Nodule (NDL), individually: SDL x EDM, SDL x PRL and SDL x NDL, and grouping all the pathologies in a single class: SDL x PTL.
Table 1 presents the obtained values of accuracy, sensitivity and specificity in signal healthy voices (SDL) and pathological (PTL) using KSG and naive estimators. The pathological voice signals comprise, in this case, the signals of all the pathologies (Reinke’s edema, paralysis and nodule) grouped in the same class.
Table 2 presents the obtained values of accuracy, sensitivity and specificity in healthy voice signals (SDL) and voices signals affected by (EDM), healthy voice
signals (SDL) and voices signals affected by (PRL), and in healthy voice signals (SDL) and voices signals affected by (NDL) using KSG estimator.
As seen from the previous tables, results obtained using KSG estimation of the reconstruction delay, in all classification cases, revealed significant differences from the results obtained using the naive estimator. In the classification between healthy voices and pathological voices, the accuracy obtained value was 68,86%, from 60,66% the naive estimator. In classification Healthy x Reinke’s Edema, the accuracy obtained value was 69,22%, from 63,78% of the naive estimator. In the classification Healthy x Paralysis on vocal folds, the accuracy obtained value was 70,18%, from 68,64% of the naive estimator and classification Healthy x Nodule on vocal folds, the accuracy obtained value was 80,00%, from 73,32% of the naive estimator.
Classification of pathologically affected voices
This section presents the results obtained in the classification of voice signals affected by Reiken’s edema (EDM), Nodules on the vocal folds (NDL) and Paralysis on the vocal folds (PRL) pathologies: EDM x NDL, PRL x NDL and PRL x EDM.
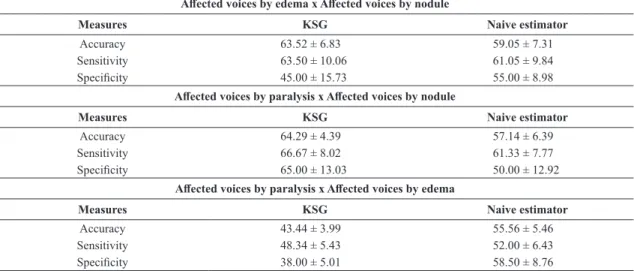
Table 3 presents the values obtained of accuracy, sensitivity and specificity in voice signals affected by EDM and voice signals affected by NDL. There are also the results obtained in the classification of voice signals affected by PRL and voice signals affected by NDL, and voice signals affected by PRL and voice signals affected by EDM.
Figure 5. Distribution of mean values of reconstruction delay τ for signals of healthy voices (SDL) and voices with Reinke’s edema (EDM), nodule (NDL) and paralysys (PRL), estimated with the naive and KSG methods.
Table 1. Rates of classification (%) Healthy x Pathological.
Healthy voices x Pathological voices
Measures KSG Naive estimator
As it can be seen, the results obtained using the reconstruction delay estimated with the KSG estimator, for classification case EDM x NDL, presented higher average accuracy of the classifier when compared with results from naive estimator. Moreover, the obtained results using the reconstruction delay estimated with the KSG estimator also offered greater mean sensitivity.
For the classification case PRL x NDL, the results obtained using the reconstruction delay estimated with the KSG estimator presented higher average accuracy of the classifier when compared with results from naive estimator. Sensitivity and specificity also presented increased values.
For the classification case PRL x EDM, the results obtained using KSG estimated reconstruction delay presented lower average accuracy of the classifier
when compared with results from the naive estimator, the accuracy obtained value was 43,44% from 55,56% of the naive estimator. However, the variance in this case was lower for all criteria with the KSG estimator.
Discussion
Discrimination between voices pathologies using nonlinear measurements is still not much explored. Some papers use several non-linear combined measures such as Costa et al. (2013) who combine 8 nonlinear measurements in healthy x pathological classification. They use the same database presented in this paper. In the classification between pathological voices the authors combine the 8 nonlinear measurements with LPC (Linear Predictive Coding). Pinho et al. (2016) use great, medium, minimum
Table 2. Rates of classification (%) Healthy x Edema, Healthy x Paralysis and Healthy x Nodule.
Healthy voices x Voices with edema
Measures KSG Naive estimator
Accuracy 69.22 ± 5.51 63.78 ± 5.51
Sensitivity 66.00 ± 7.18 65.00 ± 6.62
Specificity 72.50 ± 5.59 60.50 ± 9.77
Healthy voices x Voices with paralysis
Measures KSG Naive estimator
Accuracy 70.18 ± 5.76 68.64 ± 5.52
Sensitivity 67.34 ± 7.21 60.67 ± 4.92
Specificity 64.00 ± 6.14 66.00 ± 9.11
Healthy Voices x Voices with Nodule
Measures KSG Naive Estimator
Accuracy 80.00 ± 7.13 73.32 ± 5.34
Sensitivity 81.67 ± 7.19 81.67 ± 6.05
Specificity 75.00 ± 11.18 70.00 ± 13.34
Table 3. Rates of classification (%) Edema x Nodule, Paralysis x Nodule and Paralysis x Edema. Affected voices by edema x Affected voices by nodule
Measures KSG Naive estimator
Accuracy 63.52 ± 6.83 59.05 ± 7.31
Sensitivity 63.50 ± 10.06 61.05 ± 9.84
Specificity 45.00 ± 15.73 55.00 ± 8.98
Affected voices by paralysis x Affected voices by nodule
Measures KSG Naive estimator
Accuracy 64.29 ± 4.39 57.14 ± 6.39
Sensitivity 66.67 ± 8.02 61.33 ± 7.77
Specificity 65.00 ± 13.03 50.00 ± 12.92
Affected voices by paralysis x Affected voices by edema
Measures KSG Naive estimator
Accuracy 43.44 ± 3.99 55.56 ± 5.46
Sensitivity 48.34 ± 5.43 52.00 ± 6.43
and maximum values of τ to resconstruct phase space and use image measurements for discrimination between healthy x pathological voices. Henriquez et al. (2009) use 4 non-linear measurements combined to discriminate between healthy x pathological voices.
In this paper we used a single nonlinear measurement both in healthy x pathological voices and classification between pathological voices. We presented the reconstruction delay as a parameter applied in order to detect the presence of voice pathologies or in order to discriminate pathologies. This reconstruction delay was estimated by a new method of estimation named KSG, which has presented less biased estimates when compared with the naive estimator usually adopted.
The choice of a more accurate estimator makes the classifier more efficient, since KSG estimation approaches a value that better fits the characteristics of a true reconstruction delay. It is a well known fact that a too short reconstruction delay will not capture the dynamics of the data, while a too large reconstruction delay will make it completely independent in a statistical sense (Abarbanel, 1996). The reconstruction delay estimated with KSG method captures the dynamics of voice data more reliably, which in turn allows improved performance of classification. This was observed in the results of this paper. The reconstruction delay estimated with KSG method diagnosed more accurately in most cases.
For the first analyzed case, discrimination between healthy voices versus pathological voices, the classification with KSG estimator presented improved performance when compared to classification with the naive estimator, for the criteria accuracy and sensitivity.
The comparison between heathy voices and voices with some particular pathology (the second classification case, Healthy x Edema, Healthy x Paralysis and Healthy x Nodule) showed that KSG estimator once again presented improved performance over the naive method.
In classification between pathology voices, the results obtained with KSG estimator, for classification cases Edema x Nodule and Paralysis x Nodule, confirm the superiority of this method. Only for the classification case Paralysis x Edema the results with naive estimator were better than using KSG estimator. This fact may have occurred by some particular characteristic of the signals affected by paralysis and edema. As a matter of fact, the statistical test showed that the KSG estimated τ for both classes (paralysis and edema) were not significantly different. This explains why the discriminatory potential of the reconstruction delay is reduced in this particular case.
We stress that the results obtained in this paper are interesting for the case of detection of a disease as also for the case of classification between pathologies. The classification between pathologies is still an unexplored subject in the literature.
Finally, from the present work, we conclude that the use of KSG estimation for the reconstruction delay on phase space is a promising technique, which can be considered to improve the diagnosis of voice related pathologies.
Acknowledgements
The authors wish to thank the CAPES and CNPq by partial financing this research and for the scientific support.
References
Abarbanel HD. Analysis of observed chaotic data. USA: Springer; 1996. http://dx.doi.org/10.1007/978-1-4612-0763-4.
Assis JM, Santos MO, Assis FM. Auditory stimuli coding by postsynaptic potential and local field potential features. PLoS One. 2016; 11(8):e0160089. http://dx.doi.org/10.1371/journal. pone.0160089. PMid:27513950.
Awan SN, Roy N, Jiang JJ. Nonlinear dynamic analysis of disordered voice: the relationship between the correlation dimension (D 2) and Pre-/Post-treatment change in perceived dysphonia severity. J Voice. 2010; 24(3):285-93. http://dx.doi. org/10.1016/j.jvoice.2008.11.003. PMid:19502002.
Barbosa-Branco A, Romariz MS. Doenças das cordas vocais e sua relação com o trabalho. Comum Ciênc Saúde. 2006; 17(1):37-45.
Chai L, Sprecher AJ, Zhang Y, Liang Y, Chen H, Jiang JJ. Perturbation and nonlinear dynamic analysis of adult male smokers. J Voice. 2011; 25(3):342-7. http://dx.doi.org/10.1016/j. jvoice.2010.01.006. PMid:20472394.
Costa WCA, Assis FM, Aguiar BG No, Costa SLC, Vieira VJD. Pathological voice assessment by recurrence quantification analysis. In: Proceedings of the 2012 ISSNIP Biosignals and Biorobotics Conference: Biosignals and Robotics for Better and Safer Living (BRC); 2012 Jan 9-11; Manaus, Brazil. USA: IEEE; 2012. p. 1-6.
Costa WCA, Costa SLNC, Assis FM, Aguiar BG No. Classificação de sinais de vozes saudáveis e patológicas por meio da combinação entre medidas da análise dinâmica não linear e codificação preditiva linear. Res Biomed Eng. 2013; 29(1):3-14. http://dx.doi.org/10.4322/rbeb.2013.010.
Cover TM, Thomas JA. Elements of information theory. 2nd ed. USA: John Wiley & Sons; 2006.
Cummings L. Clinical linguistics. Edimburgo: Edinburgh University Press; 2008.
Darbellay GA, Vajda I. Estimation of the information by na adaptive partitioning of the observation space. IEEE Trans Inf Theory. 1999; 45(4):1315-21. http://dx.doi.org/10.1109/18.761290.
Davis SB. Acoustic characteristics of normal and pathological voices. Speech and Language. 1979; 1:271-335. http://dx.doi. org/10.1016/B978-0-12-608601-0.50010-3.
33(2):1134-40. http://dx.doi.org/10.1103/PhysRevA.33.1134. PMid:9896728.
Henriquez P, Alonso JÚB, Ferrer MA, Travieso CM, Godino-Llorente JI, Diaz-de-Maria F. Characterization of healthy and pathological voice through measures based on nonlinear dynamics. IEEE Trans Audio Speech Lang Process. 2009; 17(6):1186-95. http://dx.doi.org/10.1109/TASL.2009.2016734.
Jiang JJ, Zhang Y, McGilligan C. Chaos in voice, from modeling to measurement. J Voice. 2006; 20(1):2-17. http:// dx.doi.org/10.1016/j.jvoice.2005.01.001. PMid:15964740.
Kantz H, Schreiber T. Nonlinear time series analysis. Cambridge: Cambridge University Press; 2004.
Kay Elemetrics Corp. Disordered voice database. USA: Kay Elemetrics Corp.; 1994.
Kokkinos I, Maragos P. Nonlinear speech analysis using models for chaotic systems. IEEE Trans Speech Audio Process. 2005; 13(6):1098-109. http://dx.doi.org/10.1109/TSA.2005.852982.
Kozachenko L, Leonenko NN. Sample estimate of the entropy of a random vector. Probl. Peredachi Inf. 1987; 23(2):9-16.
Kraskov A, Stögbauer H, Grassberger P. Estimating mutual information. Phys Rev E Stat Nonlin Soft Matter Phys. 2004; 69(6):066138. http://dx.doi.org/10.1103/PhysRevE.69.066138. PMid:15244698.
Pinho PHU, Couras MFKB, Dantas ECS, Costa SLC, Correia SEN. Classificação de patologias laríngeas por meio de
características do espaço de fase reconstruído. In: SBrT2016: Anais do 34° Simpósio Brasileiro de Telecomunicações; 2016 ago 30 set 2; Santarém, PA. Rio de Janeiro: SBrT; 2016. p. 583-7.
Pontes P, Brasolotto A, Behlau M. Glottic characteristics and voice complaint in the elderly. J Voice. 2005; 19(1):84-94. http://dx.doi.org/10.1016/j.jvoice.2004.09.002. PMid:15766853.
Quek F, Harper M, Haciahmetoglou Y, Chen L, Ramig LO. Speech pauses and gestural holds in parkinsons disease. In: ICSLP2002 - INTERSPEECH 2002: Proceedings of the 7th International Conference on Spoken Language Processing; 2002 Sep 16-20; Denver, Colorado, USA. Denver: Causal Productions Pty; 2002. p. 2485-2488.
Rabiner LR, Schafer RW. Digital processing of speech signals. USA: Prentice Hall; 1978.
Reynolds DA, Heck LP. Automatic speaker recognition. In: Proceedings of the AAAS 2000 Meeting Humans, Computers and Speech Symposium; 2000; Washington. Washington, DC: American Association for the Advancement of Science; 2000. p. 101-104.
Shannon CE, Weaver W. The mathematical theory of information. Urbana: Illinois Books Edition; 1949.