masses on ultrasonography: a study
evaluating the diagnostic performance
and agreement with a dedicated breast
radiologist
Kiwook Kim1
, Mi Kyung Song2
, Eun-Kyung Kim1
, Jung Hyun Yoon1
1
Department of Radiology, Severance Hospital, Research Institute of Radiological Science,
2
Department of Research Affairs, Biostatistics Collaboration Unit, Yonsei University College of Medicine, Seoul, Korea
https://doi.org/10.14366/usg.16012 pISSN: 2288-5919 • eISSN: 2288-5943 Ultrasonography 2017;36:3-9
Purpose: The purpose of this study was to evaluate the diagnostic performance of S-Detect when applied to breast ultrasonography (US), and the agreement with an experienced radiologist specializing in breast imaging.
Methods: From June to August 2015, 192 breast masses in 175 women were included. US features of the breast masses were retrospectively analyzed by a radiologist who specializes in breast imaging and S-Detect, according to the fourth edition of the American College of Radiology Breast Imaging Reporting and Data System lexicon and inal assessment categories. Final assessments from S-Detect were in dichotomized form: possibly benign and possibly malignant. Kappa statistics were used to analyze the agreement between the radiologist and S-Detect. Diagnostic performance of the radiologist and S-Detect was calculated, including sensitivity, specificity, positive predictive value (PPV), negative predictive value, accuracy, and area under the receiving operator characteristics curve.
Results: Of the 192 breast masses, 72 (37.5%) were malignant, and 120 (62.5%) were benign. Benign masses among category 4a had higher rates of possibly benign assessment on S-Detect for the radiologist, 63.5% to 36.5%, respectively (P=0.797). When the cutoff was set at category 4a, the speciicity, PPV, and accuracy was signiicantly higher in S-Detect compared to the radiologist (all P<0.05), with a higher area under the receiver operator characteristics curve of 0.725 compared to 0.653 (P=0.038). Moderate agreement (k=0.58) was seen in the inal assessment between the radiologist and S-Detect.
Conclusion: S-Detect may be used as an additional diagnostic tool to improve the speciicity of breast US in clinical practice, and guide in decision making for breast masses detected on US.
Keywords: Breast; Ultrasonography; Neoplasms; BI-RADS; Diagnosis, computer-aided
Received: March 4, 2016 Revised: March 31, 2016 Accepted: April 14, 2016
Correspondence to:
Jung Hyun Yoon, MD, PhD, Department of Radiology, Severance Hospital, Research Institute of Radiological Science, Yonsei University College of Medicine, 50-1 Yonsei-ro, Seodaemun-gu, Seoul 03722, Korea
Tel. +82-2-2228-7400 Fax. +82-2-393-3035 E-mail: lvjenny@yuhs.ac
ORIGINAL ARTICLE
This is an Open Access article distributed under the terms of the Creative Commons Attribution Non-Commercial License (http://creativecommons.org/ licenses/by-nc/3.0/) which permits unrestricted non-commercial use, distribution, and reproduction in any medium, provided the original work is properly cited.
Copyright © 2017 Korean Society of Ultrasound in Medicine (KSUM)
How to cite this article:
Introduction
Ever since the release of the American College of Radiology Breast Imaging Reporting and Data System (ACR BI-RADS) lexicon for ultrasonography (US) in 2003, studies have proven it to have excellent diagnostic performance for breast masses, and it has been universally applied to daily practice [1-4]. In addition to the differential diagnosis of breast masses, US BI-RADS has contributed to standardization of imaging reports and patient management. However, many US descriptors are used for describing a breast lesion, with each descriptor containing different predictability for malignancy, and a consensus has not been reached on which descriptors have more significance in predicting malignancy [5]. In addition, US has an inherent limitation of interobserver and intraobserver variability that leads to differences among operators in both image acquisition and interpretation.
As a way to overcome the complexity of applying US descriptors and the interobserver variability of breast US, a recent study has applied computer-aided diagnosis to breast US for assistance in either lesion detection or the decision-making process during practice [6]. It has been reported that the diagnostic performance of radiologists can be improved by proper application of these computer-aided programs [7]. S-Detect is a recently developed image-analytic program that provides assistance in morphologic analysis of breast masses seen on breast US according to the US BI-RADS descriptors and inal assessment. This program can guide in deciding upon the next management for the patient, which is expected to be helpful in everyday practice. To the present, there are no studies evaluating the diagnostic performance or the degree of agreement of S-Detect with radiologists who are dedicated to breast imaging.
Therefore, the purpose of this study was to evaluate the diagnostic performance of S-Detect when applied to breast US, and determine the degree of agreement with an experienced radiologist specializing in breast imaging.
Materials and Methods
This study was of a prospective design and was approved by the Institutional Review Board of Severance Hospital, Seoul, Korea. Informed consent was obtained from all patients for study inclusion.
Patients
A total of 181 consecutive women with 201 breast masses who were scheduled for breast US examinations, US-guided core needle biopsy, or surgical excision from June to August 2015 gave consent to be included in this study. Among them, six women were excluded
because they had non-mass lesions in the breast detected on US, since image analysis of these non-mass lesions was dificult to it in the US BI-RADS lexicon, which is mostly intended for localized breast masses. Ultimately, 192 breast masses in 175 women were included in this study. The mean age of the women was 46.6±13.3 years (range, 18 to 81 years). The mean size of the breast masses included was 14.7±9.7 mm (range, 5 to 52 mm). Of the 192 breast masses, 77 (40.1%) were palpable, and one (0.5%) presented with bloody nipple discharge.
US Examination and Biopsy
US examinations were performed using a 3- 12-MHz linear transducer (RS80A with Prestige, Samsung Medison, Co. Ltd., Seoul, Korea). Two staff radiologists (J.H.Y. and E.-K.K.) with 7 and 19 years of experience in breast imaging were involved in image acquisition. Both radiologists were aware of the clinical and mammographic features and had access to the prior US examinations before US examination. Bilateral whole breast examinations were routinely performed. When a breast mass was detected, routine scanning protocols included transverse and longitudinal scanning of the breast mass, still-images recorded with and without calipers used for size measurements. For image analysis using S-Detect, video clips were recorded with the US machine, including the entire mass and surrounding normal breast parenchyma during one-directional movement of the probe, starting at one end and ending at the other end of the mass. US-guided biopsy was performed after US examinations by the same radiologist who had performed breast US.
Image Review and Application of S-Detect
US features of the breast masses were retrospectively analyzed by one staff radiologist (J.H.Y.) who has 7 years of experience in breast imaging, following the fourth edition of ACR BI-RADS lexicon and final assessment categories: shape, margin, echo pattern, orientation, lesion boundary, and posterior features [4]. US features regarding calcification were not analyzed due to the limited data analytical ability of S-Detect. The radiologist chose and recorded the most appropriate term for each descriptor. Final assessments were made for each breast mass using one of the assessment categories of BI-RADS: category 2, benign; 3, probably benign; 4a, low suspicion for malignancy; 4b, intermediate suspicion for malignancy; 4c, moderate concern for malignancy; and 5, highly suggesting malignancy.
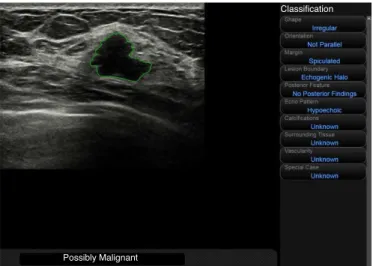
when the boundary that was automatically drawn by S-Detect was considered insuficient by the radiologist. US features according to the US BI-RADS lexicon and inal assessments were automatically analyzed and visualized by S-Detect, which was recorded for data analysis. Final assessments from S-Detect were in dichotomized form: possibly benign and possibly malignant.
S-Detect applies a novel feature extraction technique and support vector machine classifier that classifies breast masses into benign or malignant according to the proposed feature combinations integrated according to the US BI-RADS [8]. Features used for US feature analysis in S-Detect are as follows: shape differences, echo and texture features using spatial grey-level dependence matrices, intensity in the mass area, gradient magnitude in the mass area, orientation, depth-width ratio, distance between mass shape and best it ellipse, average gray changes or histogram changes between tissue/mass area, comparison of gray value of left, posterior, and right under the lesion, the number of lobulated areas/protuberances/ depressions, lobulation index, and elliptic-normalized circumference [8].
Data and Statistical Analyses
Histopathology results from US-guided core needle biopsy, vacuum-assisted excision, or surgery was considered to be the standard reference. For high-risk breast lesions, including atypical ductal hyperplasia, atypical lobular hyperplasia, lobular carcinoma in situ, intraductal papilloma, mucocele-like lesion, or radial scar, final pathological diagnosis of surgery was used. Final pathologic diagnosis of high-risk lesions was considered benign for statistical
analysis.
The inal assessment data given by S-Detect were in dichotomized form, possibly benign and possibly malignant, and for statistical analysis the final assessments made by the radiologist were dichotomized in two ways: (1) cutoff set at category 4a: negative (possibly benign), consisting of masses of category 2 and 3, positive (possibly malignant), consisting of categories 4a to 5; and (2) cutoff set at category 4b: negative consisting of category 2, 3, and 4a, and positive consisting of categories 4b to 5. Kappa statistics were used to analyze the agreement for US descriptors and inal assessment between the radiologist and S-Detect. Estimation of the overall kappa was based on the study of Landis and Koch [9]: a kappa value of less than 0 indicates poor agreement. Kappa values less than or equal to 0.20 are considered slight agreement; values of 0.21-0.40 are considered fair agreement; values of 0.41-0.60, moderate agreement; values of 0.61-0.80, substantial agreement; and values of 0.81-1.00, almost perfect agreement [9]. Diagnostic performance of the radiologist and S-Detect was calculated, including sensitivity, speciicity, positive predictive value (PPV), negative predictive value (NPV), and accuracy, and compared using the generalized estimating equation method. Area under the receiver operator characteristics curve (AUC) was obtained and compared by Delong’s method.
Statistical analyses was performed using SAS ver. 9.2 (SAS Inc., Cary, NC, USA). All tests were two-sided, and P-values of less than 0.05 were considered to indicate statistical signiicance.
Results
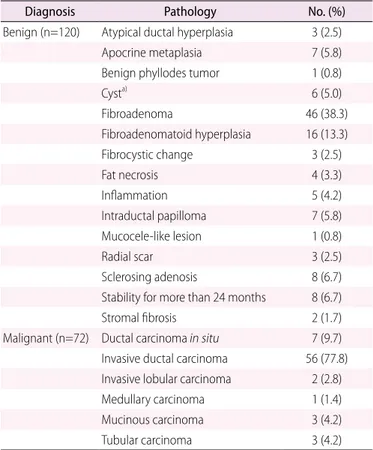
Among the 192 breast masses, 72 (37.5%) were malignant, and 120 (62.5%) were benign. Fifty-three (27.6%) lesions were diagnosed with surgery, eight (4.2%) with vacuum-assisted excision, and 118 (61.5%) with US-guided core needle biopsy. Thirteen lesions (6.7%) were included based on prior benign biopsy results and stability for more than 24 months (n=8) or typically benign US phenomena such as cysts (n=5).
Histopathologic diagnoses are shown in Table 1. The mean size of malignant masses was significantly larger than that of benign masses, 19.7±11.5 mm and 11.9±6.9 mm, respectively (P<0.001). Table 2 summarizes the proportion of S-Detect categories among each BI-RADS inal assessment by the radiologist. Malignant masses had higher rates of possibly malignant assessment on S-Detect in categories 4a to 4c, but without statistical signiicance (all P>0.05). Benign masses among category 4a had higher rates of probably benign assessment on S-Detect, 63.5% to 36.5%, respectively.
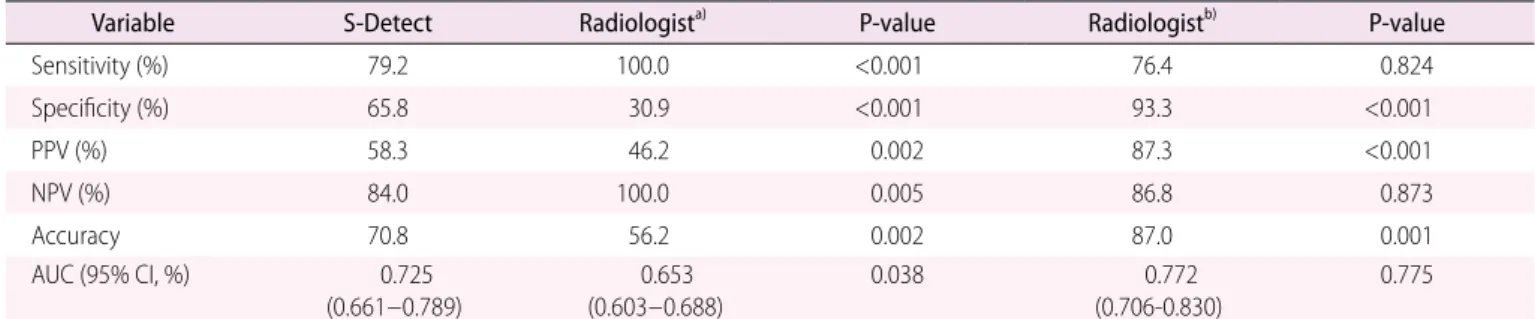
Diagnostic Performance of the Radiologist and S-Detect
Diagnostic performance of the radiologist and S-Detect is Fig. 1. Representative image showing the setting of the
summarized in Table 3. When the cutoff was set at category 4a for the radiologist, sensitivity (100.0% to 79.2%) and NPV (100.0% to 84.0%) were significantly higher for the radiologist than for S-Detect (all P<0.05). On the other hand, specificity (65.8% to 30.9%), PPV (58.3% to 46.2%), and accuracy (70.8% to 56.2%) were significantly higher for S-Detect than the radiologist (all P<0.05, respectively). When the cutoff was set at category 4b for the radiologist, specificity (93.3% to 65.8%), PPV (87.3% to 58.3%), and accuracy (87.0% to 70.8%) were signiicantly higher for the radiologist than for S-Detect (all P<0.05, respectively). AUC was signiicantly higher for S-Detect than the radiologist when the cutoff was set at category 4a, 0.725 to 0.653 (P=0.038), but did not show signiicant differences when the cutoff was set at category 4b (P=0.775) (Fig. 2).
Interobserver Agreement for US Descriptors and Final Assessment
Agreement between the radiologist and S-Detect using US descriptors for breast masses is summarized in Table 4: agreement was substantial for shape (k=0.64) and orientation (k=0.61), and fair for margin (k=0.30), echo pattern (k=0.34), lesion boundary (k=0.26), and posterior features (k=0.29). Moderate agreement (k=0.58) was seen between the radiologist and S-Detect in the dichotomized inal assessment.
Table 2. Distribution of inal assessments of the 192 breast masses according to the radiologist and S-Detect
Radiologist Pathology S-Detect P-value
Possibly benign Possibly malignant Total
Category 2 10 (5.2)
-Benign 7 (70.0) 3 (30.0)
Malignancy 0 0
Category 3 26 (13.5)
-Benign 18 (69.2) 8 (30.8)
Malignancy 0 0
Category 4a 89 (46.4) 0.797
Benign 47 (63.5) 27 (36.5) Malignancy 9 (60.0) 6 (40.0)
Category 4b 11 (5.8) 0.953
Benign 5 (71.4) 2 (28.6) Malignancy 2 (50.0) 2 (50.0)
Category 4c 19 (9.9) 0.310
Benign 2 (66.7) 1 (33.3) Malignancy 3 (18.7) 13 (81.3)
Category 5 37 (19.2)
-Benign 0 0
Malignancy 1 (2.7) 36 (97.3)
Values are presented as number (%).
Table 1. Pathologic diagnosis of the 192 breast masses included
Diagnosis Pathology No. (%)
Benign (n=120) Atypical ductal hyperplasia 3 (2.5) Apocrine metaplasia 7 (5.8) Benign phyllodes tumor 1 (0.8) Cysta) 6 (5.0) Fibroadenoma 46 (38.3) Fibroadenomatoid hyperplasia 16 (13.3) Fibrocystic change 3 (2.5) Fat necrosis 4 (3.3) Inlammation 5 (4.2) Intraductal papilloma 7 (5.8) Mucocele-like lesion 1 (0.8) Radial scar 3 (2.5) Sclerosing adenosis 8 (6.7) Stability for more than 24 months 8 (6.7) Stromal ibrosis 2 (1.7) Malignant (n=72) Ductal carcinoma in situ 7 (9.7) Invasive ductal carcinoma 56 (77.8) Invasive lobular carcinoma 2 (2.8) Medullary carcinoma 1 (1.4) Mucinous carcinoma 3 (4.2) Tubular carcinoma 3 (4.2)
a)
Discussion
US BI-RADS has contributed greatly to improving communication between physicians and radiologists, but still, observer variability acts as a major limitation of US, which is considered problematic considering the wide application of breast US. As technology has evolved, many adjunctive tools for breast US have been developed that may aid image interpretation and decision making based on
this interpretation, including elastography [10] or computer-aided diagnosis or detection [11-13]. In this study, we have evaluated the diagnostic performance of a computer-aided diagnosis program,
Table 3. Diagnostic performance of the radiologist and S-Detect
Variable S-Detect Radiologista)
P-value Radiologistb)
P-value
Sensitivity (%) 79.2 100.0 <0.001 76.4 0.824 Speciicity (%) 65.8 30.9 <0.001 93.3 <0.001
PPV (%) 58.3 46.2 0.002 87.3 <0.001
NPV (%) 84.0 100.0 0.005 86.8 0.873
Accuracy 70.8 56.2 0.002 87.0 0.001
AUC (95% CI, %) 0.725 (0.661-0.789)
0.653 (0.603-0.688)
0.038 0.772 (0.706-0.830)
0.775
PPV, positive predictive value; NPV, negative predictive value; AUC, area under the receiver operating characteristics curve; CI, conidence interval; US, ultrasonography; BI-RADS, Breast Imaging Reporting and Data System.
a)
US BI-RADS category 2-3 considered negative, categories 4a-5 considered positive. b)
US BI-RADS category 2-4a considered negative, categories 4b-5 considered positive.
Table 4. Agreement on US descriptors and inal assessment between the radiologist and S-Detect
US feature ĸ value (95% CI)
Radiologist vs. S-Detect
Shape Oval 0.64 (0.54-0.73) Round
Lobular Irregular
Margin Circumscribed 0.30 (0.20-0.40) Indistinct
Angular Microlobulated Spiculated
Echo pattern Anechoic 0.34 (0.18-0.49) Hyperechoic
Isoechoic Hypoechoic Complex
Orientation Parallel 0.61 (0.49-0.73) Not parallel
Lesion boundary Abrupt interface 0.26 (0.11-0.41) Echogenic halo
Posterior features Absent 0.29 (0.16-0.41) Enhancement
Shadowing Combined
Final assessment Possibly benign 0.58 (0.47-0.69) Possibly malignant
US, ultrasonography; CI, conidence interval.
Fig. 2. Receiver operator characteristic (ROC) curve for the radiologist and S-Detect. Solid blue line, brown interrupted line, and orange interrupted line indicates area under the ROC curve of radiologist with cutoff at ultrasonography (US) Breast Imaging Reporting and Data System (BI-RADS) category 4a (0.653), performance of radiologist with cutoff set at US BI-RADS category 4b (0.772), and area under the ROC curve of S-Detect (0.725), respectively.
100-Speciicity
0 20 40 60 80 100
Sensitivity
100
80
60
40
20
S-Detect, in the differential diagnosis of breast masses seen on US. S-Detect had significantly higher specificity, PPV, and accuracy than a radiologist, as well as a higher AUC (all P<0.05), when the cutoff was set at category 4a for the radiologist. In addition, malignant masses among category 4a to 4c had higher rates of possibly malignant assessment while benign masses in category 4a had higher rates of probably benign assessment on S-Detect, although without statistical significance. Approximately 90% of category 4a masses are eventually proven to be benign, and when applying S-Detect to category 4a lesions, 52.8% (47 of 89) of the benign masses may have avoided invasive biopsy procedures. But in contrast, nine of the 56 category 4a lesions assessed as possibly benign on S-Detect were confirmed as malignant. S-Detect may enable improvement of the specificity of US, but as seen in our results, this carries with it a decrease in sensitivity, which must be taken into consideration when applying S-Detect in clinical practice. Due to this tradeoff, S-Detect should be considered an adjunct to breast US, not one to replace grayscale US assessment.
As mentioned above, the majority of category 4a masses are eventually provenbenign, which considerably affects the diagnostic performance of the radiologist if the cutoff for dichotomization of inal assessment categories is set at category 4a. With this in mind, the diagnostic performance of the radiologist with the cutoff set at category 4b was calculated and compared to the performance of S-Detect. With the cutoff at category 4b, the radiologist had signiicantly higher speciicity, PPV, accuracy, and AUC compared to S-Detect (all P<0.05). Since the present form of S-Detect provides dichotomized data, the BI-RADS final assessment categories of the radiologist also had been dichotomized for comparison, which was signiicantly affected by the cutoff level set for analysis of our results. As biopsy is recommended for breast masses assessed as category 4a or higher in clinical practice, diagnostic performance of the radiologist with the cutoff set at category 4a may be more representative for everyday clinical practice, where S-Detect can be considered to provide additional information regarding differential diagnosis for breast masses, serving as a second opinion provider during practice.
Kappa values for each BI-RADS US lexicon descriptor and final assessment between radiologists has been reported to show fair or moderate agreement (0.24-0.41) in the literature [2,14,15]. Fair to substantial agreement was seen for US descriptors between the radiologist and S-Detect ranging from 0.29 to 0.64. Moderate agreement was observed for shape and orientation, consistent with previous reports on observer agreement between radiologists [2,15], while agreement for margin and lesion boundary was fair, k=0.30 and k=0.26, respectively, lower than the agreements of the previous reports. Differences in agreement between the prior
reports and our study relect the analytic algorithm used in S-Detect for image interpretation. For instance, the average grayscale differences between tissue/mass area or between posterior/mass area were used for analysis, which may explain the fair agreement regarding margin and lesion boundary. But more importantly, moderate agreement, k=0.58, was seen for the dichotomized inal assessment showing that the decision making of S-Detect for a breast mass detected on US was quite similar to that of a dedicated breast radiologist, supporting its potential in providing guidance to radiologists with less experience in breast imaging. Further studies with a larger number of cases are anticipated to evaluate the most effective algorithm for computer-aided diagnosis in breast US.
There are several limitations to this study. First, the analysis of US features was based on the fourth edition of the BI-RADS lexicon, since S-Detect implemented the descriptors of the fourth edition in its analysis. Although little has changed between the fourth and ifth edition of BI-RADS, changes in details may have resulted in different results. Second, analysis of calcifications, which is an important clue in the diagnosis of breast cancer [16], was not performed with S-Detect. Third, non-mass lesions were excluded from the study population since analysis was limited for non-mass lesions using S-detect. Finally, one radiologist selected the representative image and conirmed or drew a ROI for S-Detect analysis, which could have differed if other radiologists had been included. The results of our study may also have differed if radiologists with different degrees of experience had been involved in review and analysis of the sonograms.
In conclusion, S-Detect may be used as an additional diagnostic tool to improve the speciicity of breast US in clinical practice, and as a guide in decision making for breast masses detected on US.
ORCID: Kiwook Kim: http://orcid.org/0000-0002-8798-5038; Mi Kyung Song: http:// orcid.org/0000-0003-3799-0426; Eun-Kyung Kim: http://orcid.org/0000-0002-3368-5013; Jung Hyun Yoon: http://orcid.org/0000-0002-2100-3513
Conlict of Interest
This study has been supported by the research fund of Samsung Medison.
References
1. D’Orsi CJ, Sickles EA, Mendelson EB, Morris EA. ACR BI-RADS Atlas, Breast Imaging Reporting and Data System. Reston, VA: American College of Radiology, 2013.
3. Yoon JH, Kim MJ, Moon HJ, Kwak JY, Kim EK. Subcategorization of ultrasonographic BI-RADS category 4: positive predictive value and clinical factors affecting it. Ultrasound Med Biol 2011;37:693-699. 4. American College of Radiology. Breast Imaging Reporting and
Data System: BI-RADS Atlas.. 4th ed. Reston, VA: American College of Radiology, 2003.
5. Hong AS, Rosen EL, Soo MS, Baker JA. BI-RADS for sonography: positive and negative predictive values of sonographic features. AJR Am J Roentgenol 2005;184:1260-1265.
6. Jalalian A, Mashohor SB, Mahmud HR, Saripan MI, Ramli AR, Karasfi B. Computer-aided detection/diagnosis of breast cancer in mammography and ultrasound: a review. Clin Imaging 2013;37:420-426.
7. Dromain C, Boyer B, Ferre R, Canale S, Delaloge S, Balleyguier C. Computed-aided diagnosis (CAD) in the detection of breast cancer. Eur J Radiol 2013;82:417-423.
8. Lee JH, Seong YK, Chang CH, Ko EY, Cho BH, Ku J, et al. Computer-aided lesion diagnosis in B-mode ultrasound by border irregularity and multiple sonographic features. In: Proc. SPIE 8670, Medical Imaging 2013: Computer-Aided Diagnosis, 86701; 2013 Feb 28; Lake Buena Vista, FL, USA.
9. Landis JR, Koch GG. The measurement of observer agreement for categorical data. Biometrics 1977;33:159-174.
10. Au FW, Ghai S, Moshonov H, Kahn H, Brennan C, Dua H, et al.
Diagnostic performance of quantitative shear wave elastography in the evaluation of solid breast masses: determination of the most discriminatory parameter. AJR Am J Roentgenol 2014;203:W328-W336.
11. Birdwell RL. The preponderance of evidence supports computer-aided detection for screening mammography. Radiology 2009;253:9-16.
12. Kim JH, Cha JH, Kim N, Chang Y, Ko MS, Choi YW, et al. Computer-aided detection system for masses in automated whole breast ultrasonography: development and evaluation of the effectiveness. Ultrasonography 2014;33:105-115.
13. Shin HJ, Kim HH, Cha JH, Park JH, Lee KE, Kim JH. Automated ultrasound of the breast for diagnosis: interobserver agreement on lesion detection and characterization. AJR Am J Roentgenol 2011;197:747-754.
14. Lee HJ, Kim EK, Kim MJ, Youk JH, Lee JY, Kang DR, et al. Observer variability of Breast Imaging Reporting and Data System (BI-RADS) for breast ultrasound. Eur J Radiol 2008;65:293-298.
15. Park CS, Lee JH, Yim HW, Kang BJ, Kim HS, Jung JI, et al. Observer agreement using the ACR Breast Imaging Reporting and Data System (BI-RADS)-ultrasound, First Edition (2003). Korean J Radiol 2007;8:397-402.