Infrared and Raman spectroscopic characterization of the silicate
mineral olmiite CaMn
2+
[SiO
3
(OH)](OH) – implications for the molecular
structure
Ray L. Frost
a,⇑, Ricardo Scholz
b, Andrés López
a, Yunfei Xi
a, Amanda Granja
b, Zˇeljka Zˇigovecˇki Gobac
c,
Rosa Malena Fernandes Lima
daSchool of Chemistry, Physics and Mechanical Engineering, Science and Engineering Faculty, Queensland University of Technology, GPO Box 2434, Brisbane, Queensland 4001, Australia b
Geology Department, School of Mines, Federal University of Ouro Preto, Campus Morro do Cruzeiro, Ouro Preto, MG 35,400-00, Brazil
c
Institute of Mineralogy and Petrography, Department of Geology, Faculty of Science, University of Zagreb, Horvatovac 95, 10000 Zagreb, Croatia
d
Mining Engineering Department, School of Mines, Federal University of Ouro Preto, Campus Morro do Cruzeiro, Ouro Preto, MG 35,400-00, Brazil
h i g h l i g h t s
We have studied the structure of the mineral olmiite CaMn[SiO3(OH)](OH).
It forms a series with its calcium analogue poldervaartite CaCa[SiO3(OH)](OH).
We used scanning electron microscopy, thermogravimetric analysis, Raman and infrared spectroscopy. Thermogravimetric analysis proves the mineral decomposes at 502°C with a mass loss of 8.8%.
Vibrational spectroscopy enables a detailed assessment of the molecular structure of olmiite.
a r t i c l e
i n f o
Article history:
Received 3 July 2013
Received in revised form 18 August 2013 Accepted 19 August 2013
Available online 28 August 2013
Keywords:
Olmiite Phosphate Raman spectroscopy Infrared spectroscopy
a b s t r a c t
We have studied the mineral olmiite CaMn[SiO3(OH)](OH) which forms a series with its calcium analogue
poldervaartite CaCa[SiO3(OH)](OH) using a range of techniques including scanning electron microscopy,
thermogravimetric analysis, Raman and infrared spectroscopy. Chemical analysis shows the mineral is pure and contains only calcium and manganese in the formula. Thermogravimetric analysis proves the mineral decomposes at 502°C with a mass loss of 8.8% compared with the theoretical mass loss of 8.737%. A strong Raman band at 853 cm1is assigned to the SiO stretching vibration of the SiO
3(OH) units. Two Raman bands
at 914 and 953 cm1are attributed to the antisymmetric vibrations. Two intense Raman bands observed at
3511 and 3550 cm1are assigned to the OH stretching vibration of the SiO
3(OH) units. The observation of
multiple OH bands supports the concept of the non-equivalence of the OH units. Vibrational spectroscopy enables a detailed assessment of the molecular structure of olmiite.
Ó2013 Elsevier B.V. All rights reserved.
1. Introduction
The mineral olmiite, ideally CaMn[SiO3(OH)](OH), forms a
ser-ies with poldervaartite, it is Ca analogue – CaCa[SiO3(OH)](OH)
[1,2]. This mineral was first found in South Africa at the N’Chwa-ning II mine of the Kalahari manganese fields and occurs as a prod-uct of hydrothermal alteration of primary sedimentary and
low-grade metamorphic ores in a temperature range from 250°C to
400°C. Usually olmiite occurs in associated with celestine,
bul-tfonteinite, poldervaartite, sturmanite and hematite[1,2]. Olmiite crystallizes in the orthorhombic crystal system, with unit cell parameters a= 9.243(3), b= 9.076(9), c= 10.342(9) Å.
V= 868(1) Å3[1,2]. The atomic arrangement of olmiite is similar
to that of poldervaartite. Variations in bond distances and angles are related to the pronounced difference in the Mn content. The structure of both poldervaartite and olmiite can be schematically described, for convenience, as a sequence along [0 1 0] of alternat-ing layers containalternat-ing M2 + Si and M1 polyhedra, respectively. Nonetheless, the strong three-dimensional linkage among the polyhedral units results in a rather isotropic framework, as pointed out by Dai[1,2]. Olmiite consists of isolated SiO3(OH) tetrahedra
continuously connected along the [1 0 0] direction to two M2O7
polyhedra by sharing edges. The M2Si chains are linked together by corner sharing to form waved sheets parallel to (0 1 0) Alternat-ing sheets are linked together by M1 octahedra and hydrogen bonds, resulting in a strongly bonded polyhedral network[1,2].
The combination of scanning electron microscopy and vibra-tional spectroscopy has proven most useful for the study of the chemistry and molecular structure of minerals, In this work we
0022-2860/$ - see front matterÓ2013 Elsevier B.V. All rights reserved. http://dx.doi.org/10.1016/j.molstruc.2013.08.038
⇑Corresponding author. Tel.: +61 7 3138 2407; fax: +61 7 3138 1804.
E-mail address:[email protected](R.L. Frost).
Contents lists available atScienceDirect
Journal of Molecular Structure
have studied the mineral olmiite CaMn[SiO3(OH)](OH) using a
combination of techniques.
2. Experimental
2.1. Samples description and preparation
The olmiite sample studied in this work was obtained from the collection of the Geology Department of the Federal University of Ouro Preto, Minas Gerais, Brazil, with sample code SAB-098. The sample is from the type locality in N0Chwaning II mine of the
Kal-ahari manganese fields, South Africa. The mineral occurs in associ-ation with calcite and manganese oxides not determinate. The sample was gently crushed and the associated minerals were re-moved under a stereomicroscope Leica MZ4. Scanning electron microscopy (SEM) was applied to support the chemical characterization.
2.2. Scanning electron microscopy (SEM)
Experiments and analyses involving electron microscopy were performed in the Center of Microscopy of the Universidade Federal de Minas Gerais, Belo Horizonte, Minas Gerais, Brazil (http:// www.microscopia.ufmg.br).
Olmiite crystal aggregate was coated with a 5 nm layer of evap-orated Au. Secondary Electron and Backscattering Electron images were obtained using a JEOL JSM-6360LV equipment. Qualitative and semi-quantitative chemical analyses in the EDS mode were performed with a ThermoNORAN spectrometer model Quest and was applied to support the mineral characterization.
3. Electron microprobe analysis (EMP)
Chemical characterization of olmiite was carried via EMP. One single crystal was selected and prepared in epoxy resin. The single crystal was analyzed with the performance of ten spots. The chem-ical analysis was carried out with a Jeol JXA8900R spectrometer from the Physics Department of the Federal University of Minas Gerais, Belo Horizonte. For each selected element, we used the fol-lowing standards: Ca – anortite, Si – quartz, Mg – MgO, Fe – sider-ite and Mn – rhodonsider-ite. H2O was calculated by stoichiometry. The
epoxy embedded olmiite sample was coated with a thin layer of evaporated carbon. The electron probe microanalysis in the WDS (wavelength dispersive spectrometer) mode was obtained at 15 kV accelerating voltage and beam current of 10 nA. Chemical formula was calculated on the basis of five oxygen atoms (O). ZAF correction was applied with support of the JEOL software XM-97312. The error in measurements is considered ±2 wt%.
3.1. Thermogravimetric analysis – TG/DTG
TG/DTG analysis of the olmiite were obtained by using TA Instruments Inc. Q50 high-resolution TGA operating at a 10°C/
min ramp with data sample interval of 0.50 s/pt from room tem-perature to 1000°C in a high-purity flowing nitrogen atmosphere
(100 cm3/min). A total mass of 40.00 mg of finely ground samples
were heated in an open platinum crucible.
3.2. Raman microprobe spectroscopy
Crystals of olmiite were placed on a polished metal surface on the stage of an Olympus BHSM microscope, which is equipped with 10, 20, and 50objectives. The microscope is part of a Reni-shaw 1000 Raman microscope system, which also includes a monochromator, a filter system and a CCD detector (1024 pixels).
The Raman spectra were excited by a Spectra-Physics model 127 He–Ne laser producing highly polarized light at 633 nm and
col-lected at a nominal resolution of 2 cm1 and a precision of
±1 cm1in the range between 200 and 4000 cm1. Repeated
acqui-sitions on the crystals using the highest magnification (50) were
accumulated to improve the signal to noise ratio of the spectra. Ra-man Spectra were calibrated using the 520.5 cm1line of a silicon
wafer. The Raman spectrum of at least 10 crystals was collected to ensure the consistency of the spectra.
3.3. Infrared spectroscopy
Infrared spectra were obtained using a Nicolet Nexus 870 FTIR spectrometer with a smart endurance single bounce diamond
ATR cell. Spectra over the 4000–525 cm1 range were obtained
by the co-addition of 128 scans with a resolution of 4 cm1and a
mirror velocity of 0.6329 cm/s. Spectra were co-added to improve the signal to noise ratio.
Spectral manipulation such as baseline correction/adjustment and smoothing were performed using the Spectracalc software package GRAMS (Galactic Industries Corporation, NH, USA). Band component analysis was undertaken using the Jandel ‘Peakfit’ soft-ware package that enabled the type of fitting function to be se-lected and allows specific parameters to be fixed or varied accordingly. Band fitting was done using a Lorentzian-Gaussian cross-product function with the minimum number of component bands used for the fitting process. The Gaussian–Lorentzian ratio was maintained at values greater than 0.7 and fitting was under-taken until reproducible results were obtained with squared corre-lations ofr2greater than 0.995.
4. Results and discussion
4.1. Chemical characterization
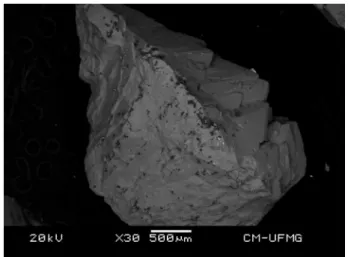
The SEM image of olmiite sample studied in this work is shown inFig. 1. The image shows a olmiite crystal aggregate. The mineral occurs in association with small amounts of manganese oxides. Qualitative chemical analysis shows a Ca and Mn silicate (Fig. 2). No other elements were detected (seeTable 1).
4.1.1. Thermogravimetric analysis
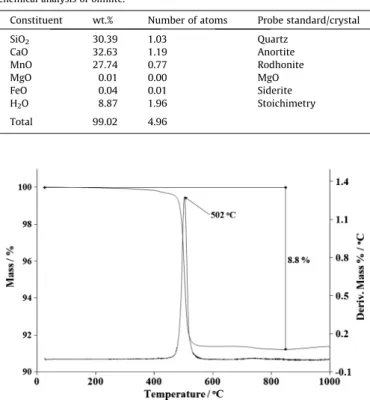
The thermogravimetric analysis of olmiite is recorded inFig. 3. A mass loss of 8.8% is observed at 502°C. The theoretical mass loss
based upon the formula CaMn[SiO3(OH)](OH) is 8.737%. The
tem-perature range for this mass loss is very narrow. The following
Fig. 1.Backscattered electron image (BSI) of an olmiite crystal aggregate up to 3.0 mm in length.
chemical reaction is proposed for the thermal decomposition of olmiite:
CaMn½SiO3ðOHÞðOHÞ !CaMnSiO4þH2O
4.2. Vibrational spectroscopy
The Raman spectrum of olmiite over the 100–4000 cm1
spec-tral range is illustrated inFig. 4a. This figure shows the position and relative intensity of the Raman bands. It is noted that there are large parts of the spectrum where no intensity is found; there-fore, the Raman spectrum is subdivided into sections depending upon the type of vibration being analyzed. The infrared spectrum of olmiite over the 500–4000 cm1spectral range is displayed in
Fig. 4b. This figure shows the position and relative intensity of
the infrared bands. Again, there are large parts of the infrared spec-trum where little or no intensity is observed and therefore, the spectrum is subdivided into sections based upon the type of vibra-tion being studied.
The Raman spectrum of olmiite over the 700–1000 cm1
spec-tral range is shown inFig. 5a. The Raman spectrum is dominated
by an intense peak at 853 cm1. Dowty showed that the –SiO
3
units had a unique band position of 980 cm1[3](seeFigs. 2 and
4of this reference). Dowty also showed that Si2O5units had a
Ra-man peak at around 1100 cm1. Olmiite consists of isolated SiO 3
(-OH) tetrahedra continuously connected along the [1 0 0] direction to two M2O7polyhedra by sharing edges. The M2Si chains are
linked together by corner sharing to form waved sheets parallel to (0 1 0) Alternating sheets are linked together by M1 octahedra and hydrogen bonds, resulting in a strongly bonded polyhedral network[1,2]. Thus, the Raman peak at 853 cm1is assigned to
the SiO stretching vibration of the SiO3(OH) units. The two bands
at 914 and 953 cm1with a low intensity shoulder at 964 cm1
are attributed to the antisymmetric vibrations of the SiO3(OH)
units. The two Raman bands at 799 and 811 cm1are attributed
to the SiOH deformation modes.
The infrared spectrum of olmiite over the 600–1100 cm1
spec-tral range is shown inFig. 5b. Strong infrared bands are observed at 860 and 970 cm1. This latter band together with the infrared
bands at 900, 920 and 938 cm1are assigned to the SiO
antisym-metric stretching vibration. The infrared band at 860 cm1is
as-cribed to the SiO symmetric stretching band. Other infrared bands are observed at 668, 731, 769, 793 and 816 cm1. If we
fol-low the assignment of the Raman bands then these bands are due to hydroxyl deformation modes.
Fig. 2.EDS analysis of olmiite.
Table 1
Chemical analysis of olmiite.
Constituent wt.% Number of atoms Probe standard/crystal
SiO2 30.39 1.03 Quartz
CaO 32.63 1.19 Anortite
MnO 27.74 0.77 Rodhonite
MgO 0.01 0.00 MgO
FeO 0.04 0.01 Siderite
H2O 8.87 1.96 Stoichimetry
Total 99.02 4.96
Fig. 3.Thermogravimetric and derivative thermogravimetric analysis of olmiite.
Fig. 4.(a) Raman spectrum of olmiite over the 4000–100 cm1spectral range and (b) Infrared spectrum of olmiite over the 4000–500 cm1spectral range.
The Raman spectra over the 300–700 cm1spectral range and
over the 100–300 cm1spectral range are presented inFig. 6.
Ra-man bands are noted at (a) 484 and 513 cm1, (b) 400, 420 and
436 cm1and (c) at 335 cm1. The first two sets of bands are
as-signed to OSiO bending modes. The band at 335 cm1is assigned
to CaO stretching vibrations. Dowty calculated the band position of these bending modes for different siloxane units [3]. Dowty
demonstrated the band position of the bending modes for SiO3
units at around 650 cm1. This calculated value is in harmony with
the higher wavenumber band observed at 663 cm1. According to
Adams et al. [4]the band at 432 cm1is due to the coincidence
of both the B2gand Egmodes. Raman bands are observed in the
Fig. 5.(a) Raman spectrum of olmiite over the 1000–700 cm1spectral range and (b) Infrared spectrum of olmiite over the 1100–600 cm1spectral range.
Fig. 6.(a) Raman spectrum of olmiite over the 700–300 cm1spectral range and (b) Raman spectrum of olmiite over the 300–100 cm1spectral range.
Fig. 7.(a) Raman spectrum of olmiite over the 3800–2600 cm1spectral range and (b) Infrared spectrum of olmiite over the 3800–3000 cm1spectral range.
Fig. 8. Infrared spectrum of olmiite (lower spectrum) in the 1500–1100 cm1 spectral range.
far low wavenumber region at 111, 149, 296, 235 and 291 cm1.
These bands are simply described as lattice vibrations.
The Raman spectrum of olmiite over the 2600–3800 cm1
spec-tral range is reported inFig. 7a. Two prominent peaks are observed
at 3511 and 3550 cm1. These bands are assigned to the OH
stretching vibration of the SiO3(OH) units. The observation of
mul-tiple bands proves that the OHs are not equivalent in the olmiite structure. The infrared spectrum of olmiite over the 3000– 3800 cm1spectral range is shown inFig. 7b. Infrared bands are
found at 3500 and 3539 cm1 with a broad shoulder at
3435 cm1. The infrared bands support the concept of the
non-equivalence of the OH units in the olmiite structure. The broad fea-ture may be ascribed to water stretching modes; however, no water bending mode was observed in the infrared spectrum in the 1500–1800 cm1spectral range. Some infrared bands were
ob-served in the 1100 to 1500 cm1spectral range (Fig. 8). Two
infra-red bands are observed at 1293 and 1328 cm1 with lower
intensity bands observed at 1177, 1276 and 1436 cm1. These
bands are all related to SiO vibrations.
5. Conclusions
We have studied the mineral olmiite CaMn[SiO3(OH)](OH)
which forms a continuous series with its calcium analogue pold-ervaartite CaCa[SiO3(OH)](OH) using a combination of electron
microscopy with EDX analysis, thermogravimetric analysis, infra-red and Raman spectroscopy. This mineral occurs as a product of hydrothermal alteration of primary sedimentary and low-grade metamorphic ores in a temperature range from 250°C to 400°C.
These temperatures are well below the thermal decomposition of olmiite of 502°C.
Raman spectroscopy identifies a peak at 853 cm1assigned to
the SiO stretching vibration of the SiO3(OH) units. Strong infrared
bands observed at 860 and 970 cm1are assigned to this vibration.
Two prominent Raman peaks observed at 3511 and 3550 cm1are
assigned to the OH stretching vibration of the SiO3(OH) units. The
equivalent infrared bands found at 3500 and 3539 cm1supports
the concept of the non-equivalence of the OH units in the olmiite structure. Vibrational spectroscopy enables a detailed assessment of the molecular structure of olmiite to be attained.
Acknowledgments
The financial and infra-structure support of the Discipline of Nanotechnology and Molecular Science, Science and Engineering Faculty of the Queensland University of Technology, is gratefully acknowledged. The Australian Research Council (ARC) is thanked for funding the instrumentation. The authors would like to acknowledge the Center of Microscopy at the Universidade Federal de Minas Gerais (http://www.microscopia.ufmg.br) for providing the equipment and technical support for experiments involving electron microscopy. R. Scholz thanks to CNPq – Conselho Nacional de Desenvolvimento Científico e Tecnológico (Grant No. 306287/ 2012-9). Zˇ. Zˇigovecˇki Gobac thanks to Ministry of Science, Educa-tion and Sports of the Republic of Croatia, under Grant No. 119-0000000-1158.
References
[1]R. Pagano, A. Guastoni, F. Pezzotta, Min. Rec. 39 (2008) 373–381. [2]Y. Dai, G.E. Harlow, A.R. McGhie, Am. Min. 78 (1993) 1082–1087. [3]E. Dowty, Phys. Chem. Min. 14 (1987) 80–93.
[4]D.M. Adams, R.S. Armstrong, S.P. Best, Inorg. Chem. 20 (1981) 1771–1776.