i
Predicting Fraud Behaviour in Online Betting
Margarida de Sousa Tedim
A Data Mining approach
Project Work presented as partial requirement for obtaining
the Master’s degree in Statistics and Information
Management
iii
NOVA Information Management School
Instituto Superior de Estatística e Gestão de Informação
Universidade Nova de LisboaPREDICTING FRAUD BEHAVIOUR IN ONLINE BETTING
by
Margarida de Sousa Tedim
Project Work presented as partial requirement for obtaining the Master’s degree in Statistics and Information Management, with a specialization in Information Analysis and Management.
Advisor / Co Advisor: Prof. Roberto Henriques, PhD
iv
DEDICATION
To my Grandmother, for all her love, kindness and dedication.
She’ll live in me forever.
v
ACKNOWLEDGMENTS
First, a special thanks to my parents. To my Mother for always being there, supporting all my pains celebrating all my successes and never leaving my side even when far away from me. To my Father for being my inspiration, my role model and an example during all my life. For trusting in me, encouraging me to go further and always give my best. Thank you.
To my sister, Filipa, for always being there to remember me that I’m beautiful, I’m intelligent and I can do anything that I wish for.
To Ricardo, there are not enough words to thank for the unconditional support, love and dedication during all this project. For being my best friend in all the moments. For always being the calm during the storm. For listen to all my doubts and celebrate even the smallest achievement. For always believing in me even when I didn’t. For everything, thank you.
To my advisor, Professor Roberto Henriques, for having followed me through all the project, giving me guidance and support. To my co-advisor Professor Cristina Marreiros for the constant availability and all the initial guidelines.
To all my company and co-workers that made this project possible. In special to José for showing interest in this work even when it was only a draft and for keeping on believing on it during all its development. An even more special thanks to Raquel, for everything she taught me and for always having my back. For having the perfect words in all the situations. Thank you.
To my best friends, Inês, Linda and César. For always being by my side even being all far away from me. For the constant support, helping me and giving me courage to overcome every situation. Thank you.
To all my friends that directly or indirectly help me through this challenge, in special, my oldest friends.
For all the strength and wise advices, and for always being there to listen, a special thanks to Dra. Mafalda.
vi
ABSTRACT
Fraud isn’t a new issue, there are discussions about this matter since the beginning of commerce. With the advance of the Internet this technique gained strain and became a billion-dollar business. There are many different types of online financial fraud: account takeover; identity theft; chargeback; credit card transactions; etc. Online betting is one of the markets where fraud is increasing every day. In Portugal, the regulation of gambling and online betting was approved in April 2015. In one hand, this legislation made possible the exploration of this business in a controlled and regulated environment, but on the other hand it encouraged customers to develop new ways of fraud. Traditional data analysis used to detect fraud involved different domains such as economics, finance and law. The complexity of these investigations soon became obsolete. Being fraud an adaptive crime, different areas such as Data Mining and Machine Learning were developed to identify and prevent fraud.
The main goal of this Project is to develop a predicting model, using a data mining approach and machine learning methods, able to identify and prevent online financial fraud on the Portuguese Betting Market, a new but already strong business.
KEYWORDS
vii
INDEX
1.
Introduction ... 12
1.1.
Background and problem identification ... 12
1.2.
Study objectives ... 13
2.
Study relevance and importance ... 14
3.
Literature review ... 15
3.1.
Data Mining ... 15
3.2.
Data Mining and Fraud ... 17
3.3.
Data mining in Banking, Money Laundering and Insurance Fraud... 19
3.3.1.
Financial Fraud ... 19
3.3.2.
Money Laundering ... 20
3.3.3.
Insurance Fraud... 21
3.4.
Data Mining and Online Gambling ... 22
4.
Methodology ... 25
4.1.
Business Introduction ... 25
4.2.
Sample ... 27
4.2.1.
Data ... 27
4.2.2.
Variables ... 28
4.3.
Explore ... 30
4.3.1.
Interval Variables ... 30
4.3.2.
Class Variables ... 32
4.3.3.
Data Partition ... 33
4.4.
Modify ... 35
4.4.1.
Missing Values ... 35
4.4.2.
Outliers ... 36
4.4.3.
Dimensionality Reduction ... 38
4.4.4.
Metadata ... 47
4.5.
Model ... 49
4.5.1.
Regression ... 49
4.5.2.
Neural Networks ... 50
4.5.3.
Decision Trees ... 51
4.5.4.
Ensemble ... 52
4.6.
Access ... 54
4.6.1.
Confusion Matrix ... 54
viii
4.6.2.
ROC Curve ... 55
4.6.3.
Lift Chart ... 56
4.6.4.
Mean Square Error (MSE) ... 56
5.
Results and Discussion ... 57
5.1.
Keeping outliers ... 57
5.2.
Removing outliers ... 58
6.
Conclusions ... 59
7.
Limitations and Recommendations for Future Works... 60
8.
Bibliography ... 61
9.
Annexes ... 68
9.1.
Variable Worth output considering ‘Frozen Date’ and ‘Level’ variables ... 68
9.2.
Interval variables output ... 68
9.3.
Class variables output ... 70
9.4.
Variable Worth Output after modify phase ... 74
9.5.
Removing Outliers – Variable Selection output ... 75
9.6.
Keeping Outliers – Spearman Correlation ... 77
ix
LIST OF FIGURES
Fig. 1 – Steps to Create a Predictive Model ...13
Fig. 2 – The Data Mining overview ...15
Fig. 3 – General approach to modelling ...16
Fig. 4 - Hierarchy chart of fraudsters: firm-level and community-level perspectives ...18
Fig. 5 – SAS Code Transformation ...32
Fig. 6 – Class Variables - Missing Values ...32
Fig. 7 – Gender Frequency Count ...32
Fig. 8 – Sports or Casino Frequency Count ...33
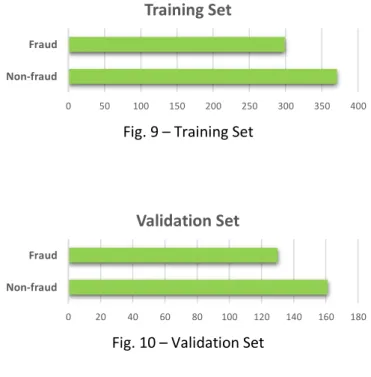
Fig. 9 – Training Set ...34
Fig. 10 – Validation Set ...34
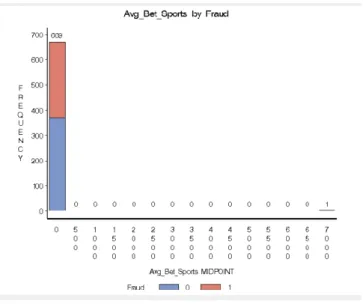
Fig. 11 – MultiPlot Output – Avg_Bet_Sports ...37
Fig. 12 - MultiPlot Output – TO_Single ...37
Fig. 13 – MultiPlot Output – Nr_Bets_Low_leagues ...37
Fig. 14 – Keeping Outliers - Variable Worth ...39
Fig. 15 – Monotonic Function ...40
Fig. 16 – SAS Code Spearman Correlation ...40
Fig. 17 – Removing Outliers - Variable Worth Output ...42
Fig. 18 – MLP Neural Network representation with one Hidden Layer ...51
Fig. 19 – Decision Tree model representation ...52
x
LIST OF TABLES
Table 1 - Database ...27
Table 2 - Variables ...28
Table 3 – Variables Role and Level Distribution...30
Table 4 – Statistics of Interval Variables ...31
Table 5 – Class Variables - Chi-Square Test ...33
Table 6 – Outliers Filtered Variables ...38
Table 8 – Keeping Outliers - Transformed Class Variables – Chi-Square Test ...41
Table 9 – Removing ouliers - Joint Analysis Correlations and Variable Worth...43
Table 10 – Keeping Outliers - Variable Selection Output ...44
Table 11 – Removing Outliers – Rejected Variables ...46
Table 12 – Keeping Outliers - Metadata ...47
Table 13 – Removing Outliers – Metadata ...48
Table 14 – Keeping Outliers – Final Results ...57
Table 15 –Keeping Outliers - Confusion Matrix - Ensemble ...58
xi
LIST OF ABBREVIATIONS AND ACRONYMS
FF Financial Fraud DM Data Mining
AI Artificial Intelligence ML Machine Learning SVM Support Vector Machine
TO Turnover
GGR Gross Gambling Revenue NGR Net Gambling Revenue KPI Key Performance Indicator
WD Withdrawal
EDA Exploratory Data Analysis MAE Maximum Absolute Error MEA Mean Square Error MLP Multilayer Perceptron AML Anti-Money Laundering
12
1. INTRODUCTION
1.1. B
ACKGROUND AND PROBLEM IDENTIFICATIONOnline Betting became legal in Portugal in April 2015. During 2016, there were made available 2 licenses for Sports Betting and 4 licenses for Casino. Currently 4 more sports betting licenses and 3 more casino licenses are already in operation. Analyzing the Serviço de Regulação e Inspeção de Jogos
– Gambling Regulation and Inspection Service (SRIJ) Report of the 2nd quarter of 2018 we can conclude
that this is a business that is growing every year. The volume of gross revenue increased about 46% when considering the 2nd quarter of 2017 and the 2nd quarter of 2018. Besides this, the number of new
registrations also increased in each period. During the analyzed period, and considering all the 8 exploration entities, about 103 thousand players made their registration, more than 40 thousand new registrations when compared with the same quarter in 2017 (SRIJ, 2018).
Having this in mind, we can understand that financial fraud (FF) and match fixing is a matter that is concerning all the institutions with this type of business (Banks, 2012). Being this a field where money is in constant motion and isn’t strictly controlled, fraudulent practices become more susceptible to occur. For example, we consider dishonest behaviors when players have more than one account registered in the same website or when they suddenly deposit or withdraw big amounts of money, contrarily to their normal behavior, or when they use a false identity to register. Also, money laundering (AML) is a way of crime that can be combined with fraud and can occur in online betting. In a website, if a player deposits big amounts of money and withdraws it without ever playing it, it can be considered as an AML suspicious situation. This type of cases has already occurred in the overall Betting Market. The principal problem is that the techniques used for controlling and monitoring fraud are mainly manual and outdated. This leads to most fraud cases never being identified or being identified only after they have occurred.
In this context, the development of a model capable of identifying and preventing, on an early stage, fraudulent behaviors using statistical and machine learning (ML) methods has become essential. Data Mining (DM) approaches developed nowadays use frequently Logistic Regression and Artificial Neural Networks models to detect FF (Albashrawi & Lowell, 2016; Sahin & Duman, 2011). Knowing that in Online Betting there are different types of fraud and that this field can suffer changes, other DM supervised logarithms such as: Decision Trees; Support Vector Machine (SVM); Bayesian learning; Discriminant Analysis and Random forests could also be analyzed (Bhowmik, 2008). In another perspective, some authors defend that it is better to use non-supervised algorithms to predict fraud (Xu, Sung, & Liu, 2007). This is an approach that can also be considered having in mind that we are analyzing a very recent business, with just over two years of operation in Portugal, with not such a big fraud database (Kordon, 2010).
The literature that is currently available on this topic is mainly concentrated in explaining and constructing predicting models for financial types of fraud that occur in the banking and health insurance industries. Understanding that Online Betting is a field that is growing every day, generating big amounts of revenue, studying and monitoring fraud has become truly necessary. Furthermore, considering that there is a lack of investigations of this matter in the Portuguese business and also that the techniques used to prevent it are becoming obsolete, the main goal of this project is to create an efficient model capable of predicting dishonest behaviors and diminish the cases of financial fraud.
13
1.2. S
TUDY OBJECTIVESAs explained before, the core goal of this project is to implement a predictive model in a Betting Industry in order to improve fraud detection and diminish the cases of dishonest behaviors. The creation of it will involve the traditional five different steps of a data mining process: 1. Collecting the data; 2. Data Preparation; 3. Selecting and Transforming Variables; 4. Processing and evaluating the Model; 5. Test and Validate the Model (Fig.1).
Having this in mind, the main objectives of this project were settled in order to understand and clarify different topics such as:
Understand if the risk variables are properly established and coherent with the environment that we are studying;
Clarify how the company should react when in presence of different types of fraud; Conclude on which are the best algorithms to predict fraud;
Realize whether it is correct to exclude outliers during the modify phase or whether it is better to keep outliers that may contain valuable information considering that we’re dealing with potential fraudulent customers;
Identify which are the indicators that better describe fraudulent behaviors;
Perceive if it is correct to use the same procedures when dealing with different fraudulent cases.
Fig. 1 – Steps to Create a Predictive Model Collecting the data Data Preparation Selecting and Transforming the Variables Processing and Evaluating the Model Test and Validate the Model Predictive Model
14
2. STUDY RELEVANCE AND IMPORTANCE
The project described in this proposal is important, not only for the organization where the model will be implemented but to economic and social areas as well.
Looking first to the organization perspective, this model is relevant, understanding that fraudulent behaviors can lead to large profit losses, state penalizations and overall disturbance of the company. Besides this, knowing that the techniques used until now in this organization are outdated, leading to slow and complex processes, this model would improve the operation of the business and allow the departments involved in this process to have more accurate and faster results. This is a gain having in mind that releasing the human resources of the traditional techniques will allow them to lose less time in identifying fraud cases and concentrate more in understanding and preventing this type of behaviors. Furthermore, knowing that this is the first time that machine learning is implemented on a betting market to predict fraud, the organization will also benefit by being one step ahead of the competition.
Thinking now in an economic and social perspective, this model can also conceive benefits. When dealing with fraud we can realize that we are handling people with criminal intentions, which in our case are associated to a betting market but can also be expanded to other businesses. According to the Kroll Global Fraud Report, “the number of businesses suffering a financial loss as a result of fraud has also increased from 64% in the previous survey period to 69% this year.” (Dajani, 2015) The facility of committing this type of crime, which gains strength with the advancement of the technology, can explain this growth on the fraud cases. In this context, the model proposed by this project would be directly related with diminishing fraud, specifically in the online betting market but having the possibility of reaching other markets too. This is an improvement thinking that we are dealing with criminal behaviors and the faster we stop them the less damage they make to the economy.
15
3. LITERATURE REVIEW
3.1. D
ATAM
ININGData Mining is defined as the process of searching useful similar patterns in the data, with the main goal of finding unknown relations that can improve the business. It combines different algorithms that are associated to specialized computational methods that derived from the fields of statistics, artificial intelligence and machine learning. The use of these advanced analytics is what differentiates data mining from the remaining traditional statistics methods (Kotu & Deshpande, 2014).
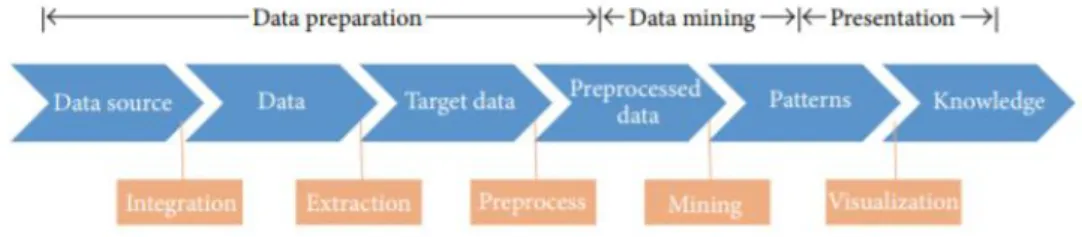
The standard process of finding similarities and relationships on data is defined by the following phases: (1) data preparation, (2) data mining and (3) data presentation (Fig.2) (F. Chen et al., 2015). Over the years, different methodological frameworks were developed to characterize this process: CRISP-DM, SEMMA, KDD, DMAIC, etc (Shafique & Qaiser, 2014). All these methodologies have similar characteristics that, in a more or less complete way, have as purpose to build a successful data mining solution (Mariscal, Marbán, & Fernández, 2010).
Knowing that in the past decade more data has been created than in the entire previous history and also that the prediction for 2020 is that more than 5,200 gigabytes will be created for every human being, it has become crucial to develop methods capable of extracting and interpreting knowledge as quick as possible (Gantz, Reinsel, & Shadows, 2012). The origin of Data Mining is directly related to this exponential growth of data normally named as Big Data (H. Chen, Chiang, & Storey, 2012). Big data is a term used to describe large and complex data sets that, due to their size and due to being in constant change, have made traditional methods of data processing slow and obsolete (Dean, 2014). Having this in mind, the solution started by implementing models that are based in data, called Data-Driven models. “The importance of Data Mining arises from the fact that the modern world is a data-driven
world.” (Kantardzic, 2011). These models are focused on computational intelligence and machine
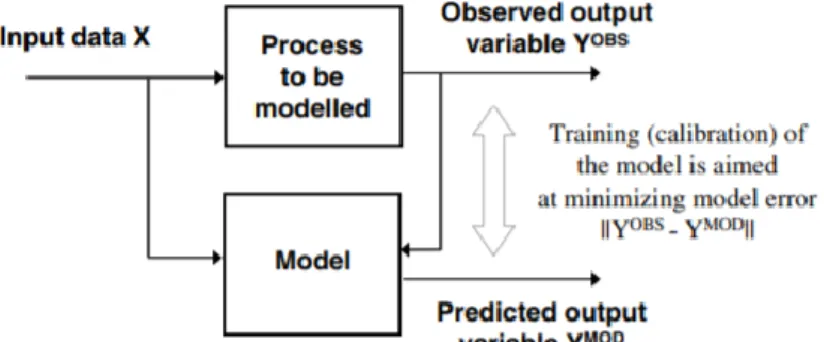
learning methods: using a training data set that is representative of all the system’s behavior, an algorithm is ran to find unknown but valuable relations between inputs and outputs (Fig. 3) (Solomatine, See, & Abrahart, 2008).
Fig. 2 – The Data Mining overview (Feng Chen, 2015)
16 In the past years, data mining has developed different functionalities such as: classification and regression, clustering, association analysis, time series analysis and outlier analysis. In general, all these tasks can be classified into two categories: descriptive and predictive (Kantardzic, 2011). Descriptive modeling has as aim to produce new and valuable information using the available dataset. It finds patterns or tendencies on the data and uses them to help on decision making. On another hand, the goal of predictive modelling is to produce a representative model, based on historical or current facts, that is able to predict unknown or future values (Kotu & Deshpande, 2014). It is necessary that all the training set has input and output attributes. The target variable, the variable to be predicted, is given for each observation (Han, Kamber, & Pei, 2012).
All data mining tasks use machine learning algorithms to either describe or predict relevant information from a training set. Logistic regression, neural networks, k-means and decision trees are some examples of these algorithms that enable computers to collect, transform and learn in order to achieve the optimal data mining solution. The recent market changes have forced the optimization of processes, both human and technological. There is an urgent need for decision making to follow the evolution of data. The solution has become to make systems autonomous and intelligent to the extent that they are capable of replacing Man.
There are two principal methods of learning that can be related to data mining: supervised and non-supervised learning. The main difference between them is that the first approach has a target variable or class label and the second approach does not (Dean, 2014). Supervised data mining uses a set of input variables to find and understand the quality of the output variables. It constructs a model based on known input and output variables by generalizing the similarities between them. Then these relations are used to predict for the data set where the output variables are unknown. The more labeled records there are, the better performance the model will have. On the contrary, in non-supervised learning there are no output variables to predict. It is a technique that discovers hidden patterns in unlabeled data (Kononenko & Kukar, 2007).
Unsupervised learning is sometimes associated with describing the data and supervised learning with predicting it. To construct a data mining project, you can either choose one approach or use both. For example: if you have a large and complex dataset you can use clustering, unsupervised learning, to
Fig. 3 – General approach to modelling (Solomatine et al., 2008)
17 understand in which group each record belongs. Then you can use regression or classification, supervised learning, on these clusters and predict valuable output variables (Witten, Frank, & Hall, 2011).
To conclude, data mining being directly related with data is a process that can be implemented in many working environments. It is frequently associated with economic businesses but it is not limited to this area. In the last decades, DM has been heavily used in: the medical field, helping to identify the best practices in advance by making records of the patients’ diagnoses; political issues, like identification of potential voters or detection of terrorists and criminals; security and quality control (F. Chen et al., 2015). In addition, it has been used in fraud detection by banks, health insurance and telecommunication companies. In this project, we will focus on studying and creating a data mining solution for fraud on the online betting market.
3.2. D
ATAM
INING ANDF
RAUDFraud is an issue that has always been present in the overall business environments but that has gained importance with the development of technology. The Internet of things has brought a plethora of new challenges to explore and it has also triggered new ways of harming companies by creating new techniques of fraud. According to the latest report to the nations of the Association of Certified Fraud Examiners (ACFE), the enterprises in their study estimated a loss of 5% of revenue in a year as a result of fraud. This equates to a loss of more than $6.3 billion, resulting in an average of $2.7 million per case study (ACFE Report, 2016).
The successive growth of the number of fraud cases has led enterprises to focus more on creating processes and building systems able to predict and prevent further fraudulent attacks. In 2014, the EY Forensic Data Analytics Survey reported that 65% of the studied enterprises used spreadsheet tools like Microsoft Excel to do Forensic Data Analytics (FDA) (EY, 2014). Although these tools are important for any FDA program when describing, grouping and filtering, they are not sufficient when identifying and preventing. The same report in 2016 shows that certain developments have been made regarding FDA. Companies are gradually becoming more concerned about reducing the fraud attacks, as the 2016 EY Forensic Data Analytics Survey shows that 74% of the high level executives that answered the survey agree that they need to use better FDA tools in order to improve their current anti-fraud procedures (EY, 2016). Despite this major effort to reduce fraud cases, there are many companies that still do not invest enough resources in this problem either because there is no budget for it or because they have not yet become aware of the losses that this phenomenon can cause.
In general, fraud can be defined as the criminal act of misleading others with the purpose of damaging them or their businesses, in order to get something of worth for their own advantage (Mukherjee, Mukherjee, & Nath, 2016). Normally fraud involves direct legal consequences but in certain cases it can be solved internally. In this project, the term fraud will be referred to in overall, considering cases in which legal consequences can be applied and cases where they are not necessary (Phua, Lee, Smith, & Gayler, 2010).
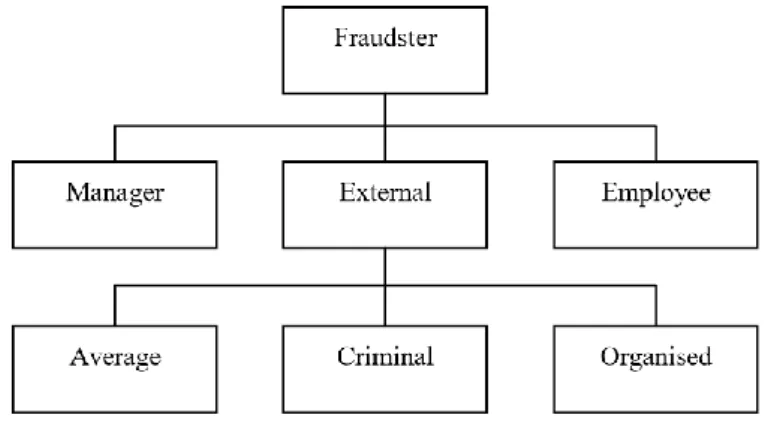
Nowadays, companies have to be prepared not only to deal with external fraud but also with the possibility of internal fraud (Fig. 4). Firm-level fraud can be committed either by managers, considered high-risk fraud, or by employees, low-risk fraud. Community-level fraud or external fraud can be divided into three main profiles: the average offender; the criminal offender and the organized crime
18 offender (Phua et al., 2010). These two last profiles described are those that usually concern and affect businesses the most because they usually commit successive fraud attacks in order to find gaps in the detection systems that enable them to profit more and more from companies.
In order to identify the fraudsters illustrated in Figure 4, usually either internal or external audit controls are made. Although these controls are important, they normally only identify that a transaction was fraudulent after it has already been made. Having this in mind, the solution would be to consolidate these controls with data analytics. This union would return better results when identifying and preventing fraud. The implementation of data mining tools would allow businesses to improve in different levels: (1) improve efficiency by automating the processes; (2) repeatable tests that would allow enterprises to control fraud at any time; (3) wider coverage by using all the database instead of controlling only alarming situations; and (4) early detection by using systems that enable the company to quickly detect a fraud transaction (Mukherjee et al., 2016).
The systems and software which enabled the creation of an antifraud control evolved from different research areas such as artificial intelligence, auditing, database, econometrics, expert systems, algorithms, machine learning, statistics, computing, visualization and others (Phua et al., 2010). It is curious to notice that this new technologies are at the same time creating weakness, which enable fraud to be more accessible to new fraudsters, and producing tools that can be used to provide smarter fraud detection and investigation techniques (Hipgrave, 2013).
In 2014, the ACFE report concluded that one of the most effective tools when reducing fraud losses and fraud scheme duration is proactive data monitoring and analysis. It is very important for antifraud control as it reduces and prevents fraud attacks (Bănărescu, 2015). Regarding the study made in 2014, organizations that used proactive data monitoring/analysis registered a near 60% of reduction in median loss to fraud and faced an approximately 50% reduction in median duration of fraud scheme compared to those that did not use this tool (EY, 2014).
The use of big data intelligence to deal with fraud allows businesses to earlier identify fraud risk and easily find trends and patterns in different types of data, both structured and unstructured, and as a result they can not only solve investigations but also prevent crime (Hipgrave, 2013).
Fig. 4 - Hierarchy chart of fraudsters: firm-level and community-level perspectives
19
3.3. D
ATA MINING INB
ANKING,
M
ONEYL
AUNDERING ANDI
NSURANCEF
RAUDOver the last decades, many articles were published concerning data mining techniques when identifying and preventing fraud. These researches can be categorized into three main financial contexts: internal, banking and insurance (Albashrawi & Lowell, 2016). These businesses are the ones that usually are more sensitive to fraud attacks, probably because they deal with large amounts of money, different technologies and many human situations.
3.3.1. Financial Fraud
Financial fraud disclosed a large amount of cases in the past years and therefore has caused major economic losses. Having this in mind, it has led to many of the papers written about antifraud control being related to this type of crime (West & Bhattacharya, 2016). When referring financial fraud, this includes a set of fraud techniques such as: financial statement fraud; automobile insurance fraud; corporate insurance fraud; money laundering; health insurance fraud; credit card fraud; occupational financial fraud and others. For each of these crimes different data mining methods were used and therefore different algorithms were tested, some performed better in one fraud type and others in another fraud type (West & Bhattacharya, 2015). “For example, the logistic model can help in detecting
financial fraud in automobile insurance, corporate insurance and credit card but it can be considered the best-performing method in the context of corporate insurance fraud”. (Albashrawi & Lowell, 2016)
Regarding fraudulent financial statements, Kotsiantis et al. used different data mining algorithms such as Decision Trees, Neural Networks (NN), Bayesian network, Support Vector Machine (SVM) and nearest neighbor in a sample of 164 Greek firms where 41 committed fraud and 123 didn’t. In terms of accuracy, decision trees achieved the best performance managing to correctly classify 91.2% of the total validation set. Besides using individual classifiers they’ve also tested the database using an ensemble classifier. They’ve concluded that combining the previous tested algorithms using a stacking variant methodology was the best approach in terms of performance, being able to correctly classify 93.9% of the total validation sets (Kotsiantis, Koumanakos, Tzelepis, & Tampakas, 2006). In 2009, Deng and Mei used an unsupervised learning approach to construct a model able to predict fraudulent financial statements. They’ve combined both Self-Organization Map (SOM) and K-means clustering algorithms into a clustering model V-KSOM that they applied to a dataset of 100 Chinese firms. As performance measure they have used the Silhouett Index, which is a method that validates the consistency within the clusters. It ranges between -1 and 1 and a high value indicates that the data is well grouped to its own cluster. In the Deng & Mei study, the highest value of Silhouett index was 0.2707 with an accuracy of 89%, proving that unsupervised algorithms can also achieve good results when predicting fraud (Deng & Mei, 2009). Having still in consideration financial statement fraud, in 2008, Liou compared three popular algorithms when building two models: one able to predict business failure (BFP) and other able to detect fraudulent financial reporting (FRD). He tested Neural Networks, logistic regression and decision trees algorithms and concluded that, in both models, logistic regression was the algorithm that exhibits the best results, registering an average accuracy of 99.05% on FRD model and 96.5% on BFP model. These results led this author to conclude that logistic regression is an appropriate methodology for detecting fraudulent reporting and predicting firm failures (Liou, 2008). Nowadays, financial fraud can also be associated with credit card fraudulent transactions. Yeh & Lien compared six different and popular data mining algorithms in order to study the probability of default of credit card clients. They used a database with 25,000 payments observations where 5,529 were
20 targeted as cardholders with default payment (fraud). Their main idea was to find the optimal data mining algorithm that could be used to represent the real probability of credit card default. They have compared the quality of the six algorithms, K-nearest neighbour, Logistic Regression, Discriminant analysis, Naïve Bayesian, Neural Networks and Classification trees, using different quality measures: to measure classification accuracy they used lift curves; to estimate the real probability of default they used the Sorting Smoothing Model, by comparing each model with the predicted probability. Neural Networks was the model that performed better in both classification accuracy and predictive accuracy of probability of default, registering a coefficient of determination (R^2) equal to 0.9647 (1); a regression intercept of 0.0145 (0) and a regression coefficient of 0.9971 (1) (Yeh & Lien, 2009). More recently, Dharwa JN & Patel AR proposed a hybrid approach for fraud detection of online financial transactions. They used a database of online shopping transactions to create a model that incorporates data mining techniques, statistics and artificial intelligence in a single platform. This model can be defined as a transaction risk generation model that contains five major components: density-based clustering; linear equation; rules; data warehouse and Bayes theorem. The use of an unsupervised data mining technique is an advantage when thinking that new fraud techniques may also be detected. Flexibility is also guaranteed by the facility of adding new rules or changing old ones to the model. In addition, the Bayes theorem phase allows the model to adapt to changing behaviours of the genuine customer as well as the fraudster (Prof, 2011). In 2014, Olszewski proposed a fraud detection model based on the user accounts visualisation and threshold-type detection. The approach applies the Self-organization map as a technique to visualise the user accounts but using a method of matrices visualization and not the standard vector visualization. After, the fraudulent accounts were identified using the threshold-type binary classification algorithm. This model was tested in three different fraud detection areas: telecommunications; credit card and computer network. In order to measure the quality of the model, ROC curves were employed in the three datasets. They compared the performance of the proposed model with three other reference fraud detection approaches and, in the three examinations, the proposed model registered better accuracy, being able to classify correctly 87.50% in telecommunications and computer network database and 100% in credit card database. These differences on the performances may be justified by the fraudster-specific behaviour - a credit card thief may choose to charge a stolen or cloned card excessively at once but a telecommunication fraudster would be interested in benefiting from the stolen account for a long period (Olszewski, 2014).
3.3.2. Money Laundering
Money laundering can be defined as the process of making illegal income appear legal, by using a legal intermediate such as large investment funds hosted in investment banks. This criminal act is becoming more sophisticated and complex every day. Le Khac & Kechadi developed an efficient solution for anti-money laundering (AML) by constructing a data mining-based approach testing multi algorithms, such as clustering, neural network, genetics algorithm and heuristic algorithm. They applied these techniques together and concluded that their approach would be able to improve the process of detecting ML cases within the investment activities, in particular in terms of running time (Le Khac & Kechadi, 2010). In 2016, Khalaf & El Khamesy tested different neural network types in a bank database with the purpose of creating an AML optimal solution. Although the comparison of the classification results by the different neural networks algorithms showed that the multi-layer perception was the technique that performed better, the Linear Neural Network registered a high performance when training, selecting and testing the data and also recorded the lowest error. For all these reasons, the
21 authors considered this model as the champion model and agreed that he could be applied in other financial transactions (Khalaf Ahmed Allam El-Din & El Khamesy, 2016).
3.3.3. Insurance Fraud
In what concerns insurance fraud, different studies were already made and can be categorized into two main areas: automobile and health insurance. Viaene, Dedene & Derrig used a database with 1,399 closed personal injury protection (PIP) automobile insurance claims to create a model able to predict fraud. They have explored the explicative capabilities of a Neural Network classifier and reported the findings of applying this classifier on PIP. They have also compared the performance of the NN algorithm with different popular data mining algorithms, such as decision trees and logistic regression (Viaene, Dedene, & Derrig, 2005). In 2014, Rodrigues & Omar also developed a model for antifraud in automobile insurance by using a multi classifier system. They gathered a dataset with 15,421 cases of suspected automobile cases of fraud. Their main objective was to find an algorithm that would allow companies to reduce costs with fraud. Having this in mind, first they created a cost model to fraud detection that allowed them, in the end of the process, to compare the performance of each algorithm. In a second phase, they tested Naïve Bayes, SVM, C4.5 and others individually and also using an ensemble method with average vote function decision. They have concluded that the combination of the classifiers would allow companies to save a higher amount of money concerning fraud than if they were used individually (Rodrigues & Omar, 2014). To conclude on automobile fraud detection, Pinquet et al. applied a bivariate probit model with censoring on a Spanish database with 2,567 suspicious claims. Their main goal was to eliminate the selection bias that is created with traditional auditing policies by using a pure random auditing strategy. This controlled experiment provided an estimated fraud probability for new claims which are not exposed to selection bias. Their results showed that random auditing enables the insurance company to reduce their costs with fraud when compared to the classical audit strategy (Pinquet, Ayuso, & Guill??n, 2007). Healthcare insurance is an area that has also been target of fraudulent attacks. In 2006, Yang & Hwang constructed a model based on process mining able to detect fraud and abuse in healthcare insurance companies. They gathered a dataset with 1,812 medical cases and divided it in fraud and normal cases. First, they used the structure pattern discovery algorithm in order to find patterns in the data, then translated them as features and, finally, they filtered by the feature subset selection algorithm. To evaluate the quality of their detection model, they used specificity and sensitivity measures. Their conclusions were that a structured detection model would be more efficient when detecting fraudulent and abusive cases than a manually constructed detection model (Yang & Hwang, 2006). More recently, Thiprungsri & Vasarhelyi introduced an unsupervised learning model using K-mean algorithm with eight clusters, which was applied in the accounting domain, in particular in the field of audit. Their sample contained 40,080 group life insurance claims of a major US insurance company. After dividing the dataset into eight clusters, they analyzed in detail the ones that were less populated and discovered some unusual characteristics among them. Using cluster-based outlier technique and evaluating which observations had less than 0.6 probabilities of belonging to the cluster, they concluded that 568 claims could be considered as anomalies. The authors consider cluster analysis as a good candidate for fraud and anomaly detection because this unsupervised learning technique surpasses the need to have a structured sample with fraud and non-fraud cases (Thiprungsri & Vasarhelyi, 2011).
22
3.4. D
ATAM
INING ANDO
NLINEG
AMBLINGIn the field of online gambling, data mining techniques are still starting to be explored. Even though this industry is old if you consider it by the physical space (casinos, poker and sports betting on field), it was only legally released online in 1996 in Caribbean and Central America countries (Wood & Williams, 2009). Over the last twenty years, this business has expanded globally and technologically and has allowed customers to play 24 hours a day, seven days a week from home, work or public spaces. This explosive growth created a plethora of new data to explore: wagers; withdrawals; deposits; open rates and even mouse clicks. All this KPI’s can be applied in data mining creating a world of possibilities to study (Philander, 2014).
One of the subjects that concern more online gambling companies is to guarantee a responsible gaming. Among other areas, this concept is competent of protecting vulnerable customers; prohibiting underage players and delivering a fair game experience in overall. In 2014, Philander proposed a model able to detect high-risk online gamblers by comparing nine different supervised learning algorithms. Random forest was the algorithm that performed better when classifying likely problem gamblers in training data, but in what concerns hold-out testing samples, neural networks appeared to be the most useful classification method. Despite these results, the main conclusion of the author was that there is a clear need for hold-out testing in this type of data mining research. The available variables in his dataset were considered to be insufficient to reasonably predict high-risk customers (Philander, 2014). Adami et al. used a previous study conducted in live action sports bettors of bwin platform and improved it by increasing the set of behavioral markers. Their main goal was to better segment and identify problematic gambles. In order to achieve these better results, they have proposed to add to the original study two indicators that would be able to reveal unsustainable gambling behaviors. This new set of indicators included not only variability of bet size, intensity and frequency of betting and trend of wagered money, but also two important markers: one able to highlight fluctuations between intervals of increasing wager size followed by rapid drops and another able to account the total number of different games played per day by the same gambler. To achieve results, they have divided their dataset into five clusters using k-means algorithm. Although the authors believe they have made an advance on studying gambles behavioral, introducing the possibility of identifying medium-risk customers, they concluded that in order to get even better results physiological studies, using questionnaires, should be integrated in the study (Adami et al., 2013).
In online gambling, more specifically in sports betting, the settlement of the probability of an outcome was always a subject that triggered interest among the bettors. Since the creation of this business, people have questioned how odds are determined. The process beyond the creation of the odds is mainly based in statistics and predictions of what is more likely to happen. Having this in mind a research was developed, using real information made available by different online bookmarkers, to improve the real probability estimation for a given sportive match outcome. The authors used an Adaboost algorithm and constructed a virtual bookmarker following three main steps: first they’ve explored prospective weak classifiers, then they’ve drafted them in order to give a weight to their contribution in the end. For further work, the authors concluded that the implementation of a classification algorithm would improve the study, mainly because it would allow to consider as data for the scouting and drafting process both the final results and their statistical confidence (Torre & Malfanti, n.d.).
23 Another major concern of the online betting companies is to identify and prevent fraudulent attacks. In this area, it’s possible to identify several types of crimes that can be committed, two of the most frequent being: match fixing that happens when the fraudster manipulates the result of an event by buying the referee, the coach or even the players; and financial fraud, that can include identity theft, duplication of accounts, money laundering and others. The last Gaming and Gambling cybercrime report made available by the ThreatMetrix in 2017, identified that one in every 20 new accounts and one in every 23 payment transactions is fraudulent (Digital & Network, 2017). Having in mind that fraudulent attacks are directly related to large losses of revenue, data mining solutions are starting to be employed in order to diminish the number of fraud cases in this industry. Until now, the research made on this subject is mainly related with unsupervised learning techniques such as clustering, anomaly and outlier detection.
In what concerns outlier detection and online gambling, in 2008, Manikas presented a model where the main purpose was to detect fraudulent behaviours and addictive gambling by finding and using an optimal method. The database used in this study contains several transactions derived from different online gambling platforms. After doing a detailed explanation of the anomaly detection method, the author chooses to apply a Principal Component Analysis (PCA) base model to the dataset. Having in consideration the dimension of the data and the number of variables existing in the studied dataset, by following this approach the author was able to transform the data into new compressed axes and at the same time keep their variability. The next step was to divide the new data into two different subspaces: normal and anomalous. In order to detect different behaviours in the data, an anomaly threshold was defined using the Q-static method. In order to evaluate the method, two data analyses were considered: time-vertical analysis, in which the datasets capture the activity of all the users within a specific amount of time, and user-based analysis, in which each user is tested for any suspicious behaviour. Both these methods were scanned for outliers. The results of the first analysis were after compared to the results given by the company’s traditional method of fraud detection and the outliers encountered in the second analysis were also evaluated. Although the results of the work could not state that the method presented was the most efficient when detecting fraudulent behaviours in this specific type of data, they could prove to be better than the current method applied into the database studied (Manikas, 2008). In 2015, a project was developed in which the ultimate scope was to detect and dissuade money laundering in the gambling industry. The author started by creating, selecting and grouping money laundering indicators by applying statistics into the dataset. In a second phase, he created a profile of the gambling venues and of the beneficiaries in order to better identify anomalies. The profiles were created using pre-defined groups where a mean clustering algorithm was applied in order to identify clusters that are at high risk level. The final phase included the evaluation of the created process by testing potential fraud cases. The precision of the model was settled on 89% and the accuracy on 93% by the test set. The potential cases that registered an anomaly score higher or equal to 90% were considered as fraud. To conclude, the author identified triggers like frequency of gain, amount of small gains, number of gambling venues visited by the player and number of gains as high crucial variables. Outlier detection joined with visualization techniques proved to be extremely suitable for detecting anomalies in the data (Robert, 2015).
Besides the papers presented above concerning data mining and online gambling, in the last years online enterprises specialized only in detecting and preventing fraud and addictive gaming were created. The main goal of this companies is to help online gambling platforms in diminishing the number of fraudulent cases and at the same time reduce the profit losses caused by this matter. Their
24 techniques of fraud detection are not made available to the public but have as base data mining and machine learning approaches. 1
Considering that there is not much available literature on fraud detection in online gambling and also that it is mainly concentrated in unsupervised learning algorithms, the project proposed in this report would be a way of starting to compensate the gap that exists in this concern.
1https://www.threatmetrix.com/cyber-security-solutions/gaming/
25
4. METHODOLOGY
Data Mining (DM) analysis is usually conducted by a general process. There are different standard methodologies made available by this approach, three of which are used more frequently: Knowledge Discovery in Databases (KDD), Sample, Explore Modify Model and Acess (SEMMA) and Cross Industry Standard Process for DM (DM). Comparing them it is possible to notice that SEMMA and CRISP-DM can be seen as an implementation of KDD (Azevedo & Santos, 2008).
Understanding that in order to achieve the optimal output the DM projects need an ordered structure, in this project we used SEMMA bases to create the predicting model. This methodology was developed by SAS Institute. The acronym SEMMA stands for Sample, Explore, Modify, Model and Assess. The model presented in this paper will mainly be guided by these different steps and will be developed using SAS Enterprise Miner tool. SAS Enterprise miner is a program that uses data mining process to create highly accurate predictive and descriptive models aggregating big amounts of data from across an enterprise.
In order to obtain a data mining process using SAS Enterprise Miner, first you have to create a process flow diagram that is built by dragging nodes from a toolbar, organized by SEMMA categories, and dropping them into a diagram workplace.
Among others, SAS Enterprise Miner is a powerful tool when performing data management, data analysis and reporting. The main benefits of using this program are: it supports the entire data mining process having available a large set of tools; it builds models in a faster way having an easy-to-use approach; the innovative algorithms improve the stability and accuracy of predictions; and it allows the analysts to promote business information and efficiently share results using a single easy-to-interpret framework (SAS, 2016).
4.1. B
USINESSI
NTRODUCTIONIn order to describe the methodology that will be used in the project, first we need to clarify the different variables available in an online betting market. This is a particular business that has its own key performance indicators (KPIs). We will focus on explaining the ones that collect the most important information of the company’s business (“Understand your Online Gambling Business with Key Performance Indicators - EveryMatrix,” n.d.).
Turnover (TO): describes the overall amount wagered.
Gross Gambling Revenue (GGR) = 𝑇𝑂 − 𝑊𝑖𝑛𝑠 𝑟𝑒𝑡𝑢𝑟𝑛𝑒𝑑 𝑡𝑜 𝑝𝑙𝑎𝑦𝑒𝑟𝑠. It measures the true economic value of gambling.
Net Gambling Revenue (NGR) = 𝐺𝐺𝑅 − 𝑇𝑎𝑥 − 𝐵𝑜𝑛𝑢𝑠 𝐶𝑜𝑠𝑡𝑠. It represents the true economic value of gambling discounting Taxes and Bonus supported by the company.
Margin = 𝐺𝐺𝑅𝑇𝑂
.
Values above zero mean that the company is profiting. Values below zero mean that the players are winning. Average Revenue per User (ARPU) = 𝐺𝐺𝑅
𝑁º 𝑃𝑙𝑎𝑦𝑒𝑟𝑠
.
It characterizes the average revenue generated per user in a period of time. Churn Rate: refers to the proportion of customers that did not place a bet on a certain period of time, they abandoned the website.
26 These are some of the most important metrics when analyzing a betting environment. To build the predictive model, we will take into consideration both these variables together with others such as: number of deposits/withdraws; amount of deposits/withdraws; total of bets settled; number of registrations, etc.
There are already certain approaches used to perceive if a customer is a risk customer. Using the variables mentioned above we can identify different situations which should then be analyzed with attention and precaution:
If usually the Avg. Bet2 of a customer is below 10€ and suddenly grows to 1,000€;
If the volume of transactions, in lifetime, is higher than €4,500 and lower than €5,000 per player;
When there is an amount of single deposit higher than €5,000 per player;
If a customer frequently deposits big amounts of money and hardly ever bets it: suspected money laundering;
When only one customer deposits with different accounts or with different credit cards; If there are many large bets in an event that is not much publicized: it tends to happen more
in lower leagues;
If there is an event where there are no bets settled on the day before and two or three hours before the game a large number of bets is settled: this can show that the players were waiting to know the formation of the game;
If the player doesn’t collaborate on completing identity details and financial details.
In order to reach the final goal of creating a Predictive Model for Fraud in Portuguese Online betting different steps were settled:
1. Gather the available data and organize fraud and non-fraud customers;
2. Study the different available literature and understand more about machine learning, data mining algorithms and fraud;
3. Select the best approach to construct the model: supervised or non-supervised models; 4. Choose the existing variables in the business that contribute the most to improve the model
and use them to create and transform new variables; 5. Make a 2nd overview to the model:
5.1 Analyze the descriptive statistics and the visual tools;
5.2 Decide how to do the partition of the data into: Train, Validate and Test;
5.3 Realize if all the chosen variables are necessary to the model looking to their variable worth and understanding the correlations among them;
6. Test different data mining predicting algorithms;
7. Make a model comparison and conclude on which is the most accurate model;
8. Evaluate the results using the validation set and implementing the model to new available data.
2 Avg. Bet = TO/Nº Bets
27
4.2. S
AMPLEIn order to be able to work with the data, first we needed to organize and understand the database structure. The main goal was to identify the data that would be necessary to build the predicting model, verify its quality following imposed standards, and obtain the variables that would be relevant for all the process.
4.2.1. Data
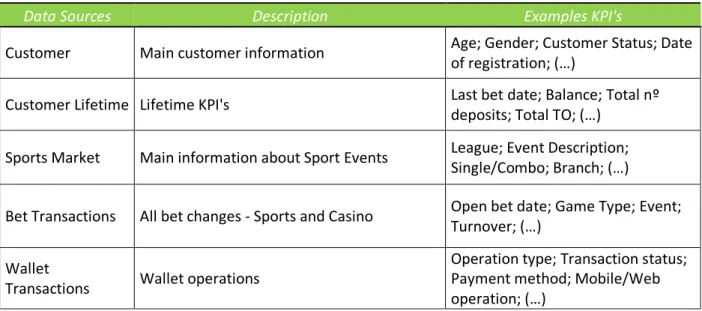
The project database is composed by different data sources and each of them contains different information about the business. The most important ones are described in the table below (Table 1). Customer data source contains all the characteristics of the customer such as: gender; date of birth; first bet date (casino and sports); customer status (active – accounts that are able to bet; frozen – accounts closed for a particular reason; self-excluded – customers who asked not to be able to access the account again); etc. The remaining data sources contain all the customer transaction information such as: number and value of deposits or withdrawals; payment methods; turnover; odds and stakes; game type; etc.
Table 1 - Database
Having in consideration that each customer can generate millions of billions of transactions and that each of these transactions represent a line on the database, it was necessary to transform the attributes into aggregate, average or temporal variables. The main core was to reconstruct the database in order to obtain only one line for each customer containing all the relevant information. The database used to build the predictive model contained both earlier identified as fraud customers and regular customers. The first phase of the data preparation involved gathering all the customers that were already identified as fraudsters by the studied enterprise. The company’s policy in situations of suspected fraud is to freeze the customer’s account, investigate and understand if the suspicions are true or false. When the conclusions are false, it reactivates the customer’s account and when they are true, depending on the level of gravity, it keeps the account frozen, contacts the person under investigation and, in last case, reaches the authorities.
The database that was after imported to SAS Enterprise Miner had 429 customers targeted as “Fraud” and 532 customers targeted as “No Fraud”. The frozen customers report made available by
Data Sources Description Examples KPI's
Customer Main customer information Age; Gender; Customer Status; Date of registration; (…)
Customer Lifetime Lifetime KPI's Last bet date; Balance; Total nº deposits; Total TO; (…)
Sports Market Main information about Sport Events League; Event Description; Single/Combo; Branch; (…)
Bet Transactions All bet changes - Sports and Casino Open bet date; Game Type; Event; Turnover; (…)
Wallet
Transactions Wallet operations
Operation type; Transaction status; Payment method; Mobile/Web operation; (…)
28 the studied company was the base used to collect the fraudulent accounts. Having in consideration that not all the frozen reasons are related to fraud, the report was first cleaned and reorganized so that, in the end, we would only have fraud frozen accounts. The no fraud customers base was randomly selected from the business database, filtering only active customers that already had activity on the platform. In order to differentiate both types of customers, we defined a variable
“Fraud” which only took the values 0 and 1: 0 for non-fraud customers and 1 for fraud customers.
This variable will be used as the target variable, dependent variable, in the model. Taking into consideration that we’re developing a supervised learning model, where the main goal is to predict correctly as many observations as possible, the pre-defined target variable contributes to better measures and assessments of the model quality (Dean, 2014).
4.2.2. Variables
The project database is administrated and developed in SQL Management Studio 17 for SQL Server (Database & Solutions, 2015). Having this in consideration, in order to collect all the relevant information about the selected customers, distinct queries were created using the different data sources explained above (Table 1). Considering that we could only have one line for each customer, all the information was transformed in either total, average or maximum/minimum variables.
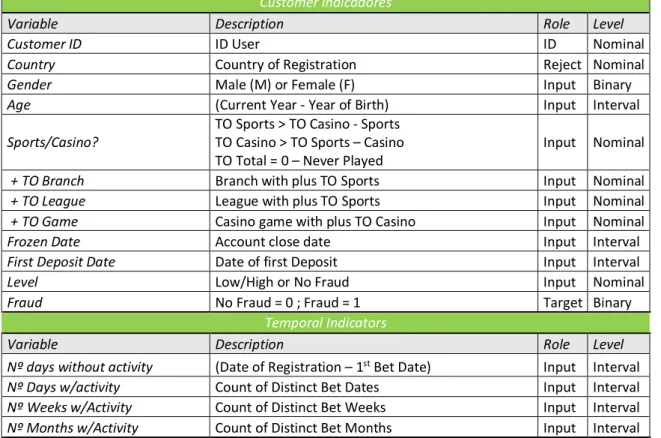
In order to choose the relevant variables used in the model, different aspects such as wallet operations, betting transactions and customer activity were taken into account. Both the Financial/Validation and Compliance teams were consulted in order to agree in which variables we should use as indicators of fraud behavior. These variables could be grouped into three main categories: demographic indicators; temporal indicators and business indicators (Table 2).
Table 2 - Variables
Customer Indicadores
Variable Description Role Level
Customer ID ID User ID Nominal
Country Country of Registration Reject Nominal
Gender Male (M) or Female (F) Input Binary
Age (Current Year - Year of Birth) Input Interval
Sports/Casino?
TO Sports > TO Casino - Sports TO Casino > TO Sports – Casino
TO Total = 0 – Never Played
Input Nominal
+ TO Branch Branch with plus TO Sports Input Nominal
+ TO League League with plus TO Sports Input Nominal
+ TO Game Casino game with plus TO Casino Input Nominal
Frozen Date Account close date Input Interval
First Deposit Date Date of first Deposit Input Interval
Level Low/High or No Fraud Input Nominal
Fraud No Fraud = 0 ; Fraud = 1 Target Binary
Temporal Indicators
Variable Description Role Level
Nº days without activity (Date of Registration – 1st Bet Date) Input Interval
Nº Days w/activity Count of Distinct Bet Dates Input Interval
Nº Weeks w/Activity Count of Distinct Bet Weeks Input Interval
29 Business Indicators
Variable Description Role Level
TO Sports TO with Sports betting Input Interval
Total Nº Bets Sports Count Nº Bets Sports Input Interval
Average Bet Sports (TO Sports/Total Nº Bets Sports) Input Interval
GGR Sports GGR with Sports betting Input Interval
Average GGR Sports (GGR Sports/Total Nº Bets Sports) Input Interval
% TO Single (TO Single Bets/TO Sports) Input Interval
% TO Combo (TO Combo Bets/TO Sports) Input Interval
TO Low Leagues3 Total TO Low Leagues – Portugal Overview Input Interval
Nº Bets Low Leagues Count Nº Low Leagues - Portugal Overview Input Interval
Avg Bet Low Leagues (TO Low Leagues/Nº Bets Low Leagues) Input Interval
GGR Low Leagues Total GGR Low Leagues - Portugal Input Interval
Avg GGR Low Leagues (GGR Low Leagues/Nº Bets Low Leagues) Input Interval
TO Casino TO with Casino betting Input Interval
Nr Bets Casino Count Nº Bets Casino Input Interval
Average Bet Casino (TO Casino/Total Nº Bets Casino) Input Interval
GGR Casino GGR with Casino betting Input Interval
Average GGR Casino (GGR Casino/Total Nº Bets Casino) Input Interval
Nr Distinct Payment Methods Count Distinct Payment Methods Input Interval
Total Approved Deposits Value of Total Deposits Approved Input Interval
Nº Deposits Approved Nº Total Deposits Approved Input Interval
Average Nº Deposits per Day (Nº Deposits Approved/Nº Days w/ activity) Input Interval
Average Deposits Approved
(Value Total Deposits Approved/Nº Total Deposits
Approved) Input Interval
Total Rejected Deposits Value of Total Deposits Rejected Input Interval
Nº Deposits Rejected Nº Total Deposits Rejected Input Interval
Average Deposits Rejected
(Total Deposits Rejected /Nº Total Deposits
Rejected) Input Interval
Total Pending Deposits Value of Total Deposits Pending Input Interval
Nº Deposits Pending Nº Total Deposits Pending Input Interval
Average Deposits Pending (Total Deposits Pending /Nº Total Deposits Pending) Input Interval
Total Approved Withdrawals Value of Total Withdrawals Approved Input Interval
Nº Withdrawals Approved Nº Total Withdrawals Approved Input Interval
Average Nr Withdrawal per day (Nº Withdrawals Approved/Nº Days w/ activity) Input Interval
Average Withdrawal Approved
(Total Withdrawals App./Nº Total Withdrawals
App.) Input Interval
Total Rejected Withdrawals Value of Total Withdrawals Rejected Input Interval
Nº Withdrawals Rejected Nº Total Withdrawals Rejected Input Interval
Average Withdrawal Rejected
(Total Withdrawals Rejected/Nº Total Withdrawals
Rejected) Input Interval
Total Pending Withdrawals Value of Total Withdrawals Pending Input Interval
Nº Withdrawals Pending Nº Total Withdrawals Pending Input Interval
Average Withdrawal Pending
(Total Withdrawals Pending/Nº Total Withdrawals
Pending) Input Interval
After having all the database organized, we imported the data into the project and defined roles and levels for each of the selected variables. As referred above, we defined the metric ‘Fraud’ as target variable, with a binary level where 1 represents fraud customers and 0 non-fraud customers. Besides
30 this, we designated ‘Customer ID’ with the ID role and the remaining ones as Input variables. The levels were identified considering if the variables were binary, interval or nominal. We also decided to reject the variable ‘Country’ because it only had different values for 4 customers. This difference was caused by a momentary error on the website, in which users could put their nationality on the country field instead of their residence country. In the end, we collected 54 variables, distributed as shown in the figure below (Table 3).
Table 3 – Variables Role and Level Distribution
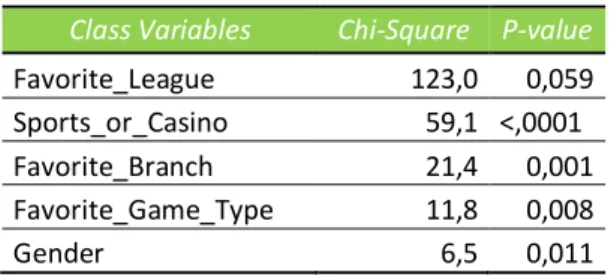
4.3. E
XPLOREThe second phase of the SEMMA methodology is directly related with making an exploratory data analysis (EDA). The main goal is to characterize the descriptive statistics of the data: identify missing values, determine outliers and understand the value of each variable. The original database is constituted by 51 input variables, where 44 are interval variables and 7 are class variables. Considering this, we analyzed each of these groups of variables separately.
Since we made a predictive modulation, with a supervised learning approach, the results of the target variable were considered for both analysis.
After running the Stat Explore node, we noticed that the variables ‘Frozen Date’ and ‘Level’ had a too high variable worth value, approximately 0.5, when compared to the other variables. This can be explained by the fact that both of them have a particular field for fraud customers and a unique value for fraud customers. For example, fraud customers can only have ‘low’ and ‘high’ as level and non-fraud customers can only have ‘no non-fraud’ as level. Considering this, we decided to reject these variables, with the purpose of being able to increase the performance of the remaining ones.
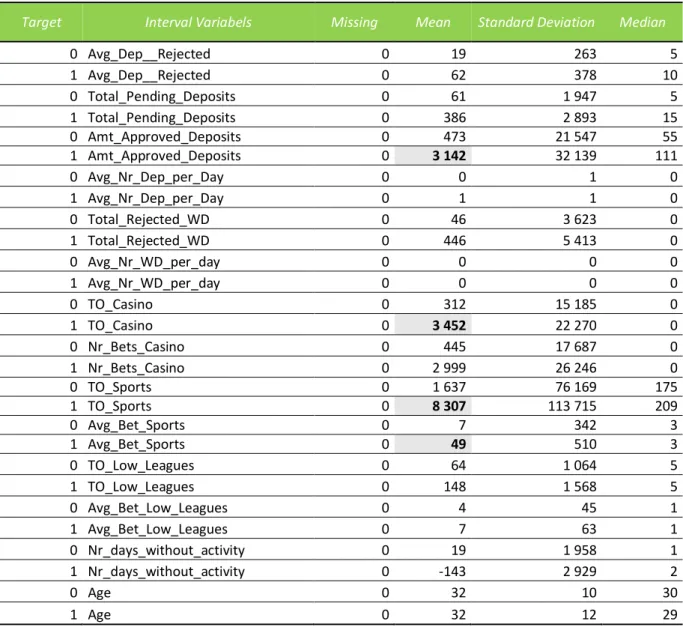
4.3.1. Interval Variables
Analyzing the Interval variables output (Table 4), the first thing we can conclude is that there are no missing values in the dataset. Looking to the descriptive statistics, another conclusion that we can take is that there might be potential outliers in some variables. The distance between the mean and maximum values supports this conclusion. For example, the variable “Total_Pending_Deposits”, for fraud customers, has a mean value approximately 48x bigger than the maximum value and the variable “Amt_Approved_Deposits”, for fraud customers, has a mean value approximately 201x greater than the maximum value. The presence of outliers in the dataset can be justified by the fact that we’re dealing with potential fraudulent customers, who normally have an irregular behavior.
In addition to these conclusions, when analyzing the descriptive statistics, we can also start to understand some variables’ behavior with the target variable. The mean value of both casino and sports turnover for fraud customers is approximately 6x greater than the value registered for non-fraud customers. This may show that clients with non-fraudulent behavior tend to bet higher values than non-fraudulent customers. Besides these, the “Low Leagues” variables behavior also caught our
Role Nº Variables Level Nº Variables
ID 1 Nominal 7
Reject 1 Binary 2
Input 51 Interval 45
31 attention. For fraud customers, the Turnover and the Average Bet registered a maximum value higher than normal and distanced from the mean value. Knowing that we’re considering only small leagues, which by themselves are not very appealing to bets, the fact that these values are so high reveal already a certain peculiar behavior.
Table 4 – Statistics of Interval Variables
Target Interval Variabels Missing Mean Standard Deviation Median
0 Avg_Dep__Rejected 0 19 263 5 1 Avg_Dep__Rejected 0 62 378 10 0 Total_Pending_Deposits 0 61 1 947 5 1 Total_Pending_Deposits 0 386 2 893 15 0 Amt_Approved_Deposits 0 473 21 547 55 1 Amt_Approved_Deposits 0 3 142 32 139 111 0 Avg_Nr_Dep_per_Day 0 0 1 0 1 Avg_Nr_Dep_per_Day 0 1 1 0 0 Total_Rejected_WD 0 46 3 623 0 1 Total_Rejected_WD 0 446 5 413 0 0 Avg_Nr_WD_per_day 0 0 0 0 1 Avg_Nr_WD_per_day 0 0 0 0 0 TO_Casino 0 312 15 185 0 1 TO_Casino 0 3 452 22 270 0 0 Nr_Bets_Casino 0 445 17 687 0 1 Nr_Bets_Casino 0 2 999 26 246 0 0 TO_Sports 0 1 637 76 169 175 1 TO_Sports 0 8 307 113 715 209 0 Avg_Bet_Sports 0 7 342 3 1 Avg_Bet_Sports 0 49 510 3 0 TO_Low_Leagues 0 64 1 064 5 1 TO_Low_Leagues 0 148 1 568 5 0 Avg_Bet_Low_Leagues 0 4 45 1 1 Avg_Bet_Low_Leagues 0 7 63 1 0 Nr_days_without_activity 0 19 1 958 1 1 Nr_days_without_activity 0 -143 2 929 2 0 Age 0 32 10 30 1 Age 0 32 12 29
Lastly, the variable “Nr_Days_without_activity” has a minimum value of -42,848. Considering that this variable represents the number of days that passed between the customer registration and the customer first activity on the website, it cannot have negative values and the minimum value should be 0. The customers that registered this value are customers that never had activity on the website. Knowing this, we decided to replace the -42,848 values by 0 using the SAS Code represented below.