International Journal of Engineering and Technology Volume 2 No. 10, October, 2012
ISSN: 2049-3444 © 2012 – IJET Publications UK. All rights reserved.
1657
Modeling Tractive Force Requirements of Wheel Tractors for Disc
Ridging in Loamy Sand Soil
S O Nkakini, I. Fubara-Manuel
Department of Agricultural and Environmental Engineering,
Rivers State University of Science and Technology, Port Harcourt, NigeriaABSTRACT
The efficiency with which a soil can transmit energy from a traction device on a tractor to the drawbar has been called the tractive efficiency of soil. Experiments were conducted for disc ridging operations in a loamy sand soil, at tillage speeds of 1.94m/s, 2.22m/s and 2.5m/s, using trace tractor techniques. Tractive force models at different tillage speeds were developed using dimensional analysis, describing the tractors tyre - soil interaction. The measured independent variables such as drawbar pull force, rolling (motion) resistance, wheel slip, moisture content, cone index, wheel numeric, contact pressure, speed, width of ridge and height of ridge were used in the developed models. Values of the measured dependent variable (Tractive force) were compared with computed values. High coefficients of determination R2 = 0.996, 0.996 and 0.986, percentage (%) errors of -0.122620038 and 0.11606597,-0.126307491 and 0.215127604 ,-0.603425382 and 0.372951166 at minimum and maximum values, for disc ridging at tillage speeds of 1.94m/s, 2.22m/s and 2.5m/s were obtained respectively. Analysis of variance between measured and predicted tractive force values indicated standard errors of 11.15346, 10.15346 and 8.24219, while correlation coefficients of R2 = 0.996, 0.768 and 0.9674 were obtained for disc ridging at tillage speeds of 1.94m/s, 2.22m/s, and 2.5m/s respectively . These results are clear evidence of the test of goodness of fit of the models between the measured and predicted tractive forces for disc ridging at the various tillage speeds. Disc ridging speed of 2.5m/s illustrated the lowest coefficient of determination R2 = 0.986. The developed models were validated by comparing the predicted with the measured tractive forces, and shown to closely followed the experimental results.
Keywords: Tractive force, disc ridging, loamy, sand, soil, modelling,soil moisture
1.
INTRODUCTION
In the early twentieth century, agricultural engineers were concerned with efficiency in tractive force agricultural production especially in tillage operations. Tractive force in tillage operations has been a long term problem in farming activities. With advancement in improved agricultural production, the use of tractor in tillage has become inevitable. Agricultural tractor, especially for tillage operation is to perform drawbar pull work. Tillage is the manipulation or alteration of the soil to provide a condition favourable for crop growth and development (Adetayo, et al.,2004 ASAE standards, 2002). According to Onwualu et al., (2006), tillage is soil manipulation in order to provide conditions necessary for crop growth. Energy requirements for tillage varies with draught force, wheel slip, depth of cut ,width of cut, height of ridge and soil moisture, which must be considered in a true perspective of the activities. Energy efficiency is now an important consideration in agricultural production in quest for cleaner environment.
Over the years, different kinds of tillage operations and implements have evolved in order to give the soil the best tilt for crop production. Tillage is an inevitable part of soil management and crop production. A good tillage
operation should provide a suitable soil pulverisation. Ridging is a tillage operation intended for heaping up of tilled soil from two sides to form long stripes of mounds having furrows in between. Mechanised ridging is always done after ploughing and harrowing operations(Nkakini et al.,2008). This tillage operation is accomplished with the aid of tillage implement called disc ridger. Until recently, one of the challenges in design of agricultural field tractor had been to equip it with a tractive device that can develop effective traction with minimum soil damage(Hassan and Broughton, 1975). Over time, the choice of tractive elements used for off-road vehicles to generate tractive force was mainly restricted to pneumatic tyres(Yu,2006).
ISSN: 2049-3444 © 2012 – IJET Publications UK. All rights reserved.
1658
been used over the years to model traction. However, there is still room for improvement. Hence, there is the need to improve on the efficiency of tillage operations to save time, money and increase productivity in mechanized agriculture. Researchers have shown that poor tractive performance in tillage operations is not cost effective. Optimizing the performance of agricultural tractors could, therefore help to minimize energy waste(Sefa and Kazim, 2004). Energy loss by the pneumatic tyre is therefore of concern to search for improved traction efficiency(Wong, 1993). This model determines the appropriate tractive force for tillage operations, which in turn gives the tractor operators proper condition for their fieldwork.
The objective of this study is to develop mathematical model for predicting the tractive force requirements of disc ridging using dimensional analysis and to validate the models by comparison of the computed results from model with field results.
2.
MATERALS AND METHODS
2.1
Description
Experiments were conducted in the field(in-situ)using trace tractor technique . It was conducted at National Root Crops Research Institute(NRCRI) experimental farm, in Umudike, Umuahia, Abia State of Nigeria. Umudike is under the derived tropical humid ecological zone of Nigeria, and is 122m above sea level and lies on latitude 050 291N and longitude 070 331E.
2.2
Experimental Procedure
The instruments and implements used in measuring the tractive forces and other parameters are two tractors of the Massey Ferguson 435 model of 72 horse power, cone penetrometer, dynamometer, measuring tape, disc ridger, auger, stop watch and instrument for measuring weight of tractor (static hydraulic press). All field tests were conducted in a loamy sand soil for which the physical properties were determined. Before the field experiment started, experimental layout area of 90m by 90m was designed with three different blocks of 90m x 27m each. Each block was divided into 9(nine) strips of 90m by 2m wide with a space of 3m between each strip. Disc ridging operation was carried out on each of the blocks. Each day of the experiment were three replications of disc ridging operations. This continued until the last day of minimal moisture levels. Hence, the total treatments were 9 x 20 days of the operations. Day 1, the tillage operations started with disc ridging on Block 1, Strip 1; Block 2, Strip 1; and Blocks 3, Strip 1. Day 2, disc ridging on Block 1, Strip 2; Block 2 Strip 2 and Block 3 Strip 2. Day 3, disc ridging on Block 1 Strip 3; Block 2 Strip 3 and Block 3, Strip 3. This pattern was followed for the remaining days up to the last day when minimum
moisture content was achieved. Soil data were collected to the depths of 50mm, 150mm and 200mm respectively using soil auger, core sampler and a hand- operated soil cone penetrometer having an enclosed angle of 300, with a base area of 323mm2 mounted on a shaft of 2.03mm for the determination of moisture content, bulk density and soil resistance before tillage operation. During the sampling process, cone penetrometer was positioned between the operator’s two legs and pressed down the soil until the marked point on the shaft was reached, before readings were taken. The bulk density was measured using core sampler. Soil moisture content was determined using gravimetric method (oven dry method). The towing force and drawbar-pull forces were determined using trace- tractor technique. Two Massey Ferguson 435 model tractors of 72- horse power(hp) were used. The tractor carrying the implement with its engine disengaged(neutral gear) was coupled to another tractor which towed it with the dynamometer in between them. The first tractor pulled the second tractor coupled to the implement(disc ridger).The dynamometer reading was taken to determine the towing force. The drawbar-pull force was the difference between the towing force in neutral gear without implements in tillage operation and towing force when the implement was engaged in tillage operations. Height and width of ridges were measured with a steel tape. The speeds of operations were obtained by setting the tractor at a suitable gears of a gear reduction unit for targeted speed of 1.94m/s,2.22m/s and 2.5m/s. Simultaneously, the time taken to cover a fixed distance of 90m was recorded using a stopwatch to calculate the operating speed of the tractor and implement combination. Plate 1, shows the tractor –dynamometer- tractor-implement combination in action.
Plate 1. A photograph depicting tractor- dynamometer, implement mounted position during ridging operations
3.
MODEL DERIVATION
ISSN: 2049-3444 © 2012 – IJET Publications UK. All rights reserved.
1659
predictive models. Dimensional analysis was used to develop the prediction models for traction forces of wheel tractor in tillage operation. Buckingham’s theory(Murph, 1950, Langhaar, 1951,Kasprazak et al., 1990) is based on the knowledge that if there are n basic dimensions and m variables, then there are n-m dimensionless parameters. This can be expressed as:
S = n - b (1)
where, S = the number of Pi terms ,n = the total number of variables and b = the number of basic dimensions. Basic dimensions are mass (M), length (L) and time (T)
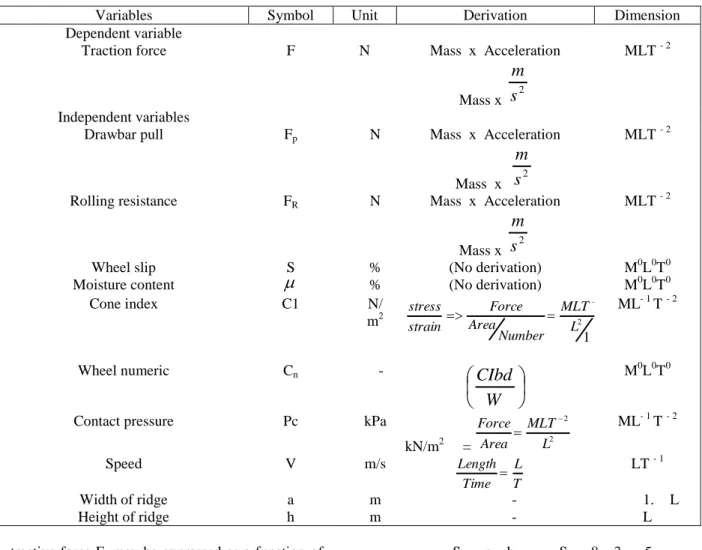
The pertinent variables that affect the traction performance of the wheel tractor in loamy sand soil during tillage are eleven variables, (Table 1) with their corresponding dimensions. However, wheel slip(s), moisture content (
), and wheel numeric (Cn) are dimensionless parametersTable 1: Variables affecting traction requirement
Variables Symbol Unit Derivation Dimension
Dependent variable
Traction force F N Mass x Acceleration
Mass x
s
2m
MLT - 2
Independent variables
Drawbar pull Fp N Mass x Acceleration
Mass x
s
2m
MLT - 2
Rolling resistance FR N Mass x Acceleration
Mass x
s
2m
MLT - 2
Wheel slip S % (No derivation) M0L0T0
Moisture content
% (No derivation) M0L0T0Cone index C1 N/
m2
1 2 L MLT
Number Area
Force strain
stress ML- 1 T - 2
Wheel numeric Cn -
W
CIbd
M0L0T0Contact pressure Pc kPa
kN/m2 = 2 2
L MLT Area
Force
ML
- 1 T - 2
Speed V m/s
T L Time
Length LT - 1
Width of ridge a m - 1. L
Height of ridge h m - L
Thus, tractive force F, may be expressed as a function of the other seven variables, after the dimensionless parameters are being taken away.
F
F
CI
Pc
V
a
h
f
F
p,
R,
,
,
,
,
(2)where, f is functional notation for tractive force
This equation may be re-written as
F
,
F
F
,
CI
,
Pc
,
V
,
a
,
h
0
f
p R (3)Therefore, the number of variables are, n = 8, but since the basic dimensions are MLT, = 3, then, number of dimensionless - terms are
S = n – b , S = 8 – 3 = 5
Hence, five
i - terms say, 1, 2, 3, 4 and 5 weregenerated. Thus,
F = f (1, 2, 3, 4, 5) (4)
Therefore, equation (4) may be re-written as
f1 (1, 2, 3, 4, 5) = 0 (5)
where, f1 is functional notation for -terms
From equation (5) above, five -terms (1, 2, 3, 4 and
ISSN: 2049-3444 © 2012 – IJET Publications UK. All rights reserved.
1660
for tractive force of wheel tractor tillage operation (harrowing) on loamy sand soil.
In the dimensionless terms determination exercise, the three dimensionless terms; wheel slip,(s), moisture
content,(
), and wheel numeric, (Cn) are excluded, but have to be added when the other dimensionless terms are to be formed. Also, the chosen repeating variables: cone index (CI), tractor speed (V) and width of plough(a) should not form a dimensionless term and no dimensionless group is formed by them (Barenblat,1987, Upadhyaya ,2003 ).The repeating variables are:
2 1
T
ML
CI
,V
LT
1,a
L
When -terms are formed based on the principle of dimensional homogeneity, the dimensionless -terms obtained are:
, ,
, ,
, 2 2 3 2 4 5
2 1 a h CI P CIa F CIa F CIa
F p R c
Already determined dimensionless -terms are:
Cn
S
7 86
,
,
A new set of Pi terms are generated by multiplying and/ or dividing present Pi terms with each other. In addition, a present Pi terms can be reversed to make a new Pi terms, while maintaining independency condition. Some new Pi terms groups obtained after transformations are:
1 1
=
P P PF
F
x
F
F
F
CIa
x
CIa
F
x
1
1
2 2 3 2 1
PF
F
1 (6)
2 2 4 3 1 2
a
P
F
P
CI
x
CIa
F
C R C R
x a P h F x a h x a P F x x C R C R 3 3 2 3 5 1 22
3 2
a
P
h
F
C R
(7)
3
(8)After eliminating some existing -terms the dimensionless Pi terms obtained are as follows:
n c R p SC a P h F F
F
2 3 3
1 , , (ridging operation) (9)
The traction force required is contained only in 1- term.
Thus, 1 is related to the other two -terms as follows:
1 = (2, 3) (10)
Thus,
pF
F
SCn
a
P
h
F
C R,
3 (11)
for ridging at tillage speeds of 1.94m/s,2.22m/s ,2.5m/s
Substituting the dimensionless parameters (Pi terms) gives:
1 = constant 2 ± constant33 ±constant4 ± constant (C)
4 3 3 2
C
SCn
C
a
P
h
F
C
F
F
C R P
for ridging (12)
The Least-square method was then used to determine the constants of the polynomials, expressed as
3 2
dx
cx
bx
a
Y
(13)The least-square formulation for the polynomials is
i i i i i i yi i i i i i i i i i i i i i i iy
x
y
x
y
x
d
c
b
a
x
x
x
x
x
x
x
x
x
x
x
x
x
x
x
n
3 \ 2 6 5 4 3 5 4 3 2 4 3 2 3 2ISSN: 2049-3444 © 2012 – IJET Publications UK. All rights reserved.
1661
wheel slip, cone index, width of harrow, moisture content and rolling resistance.
Estimation Equation:
3 2 4 3
2
1
C
F
pC
F
p
C
F
p
C
F
(14)
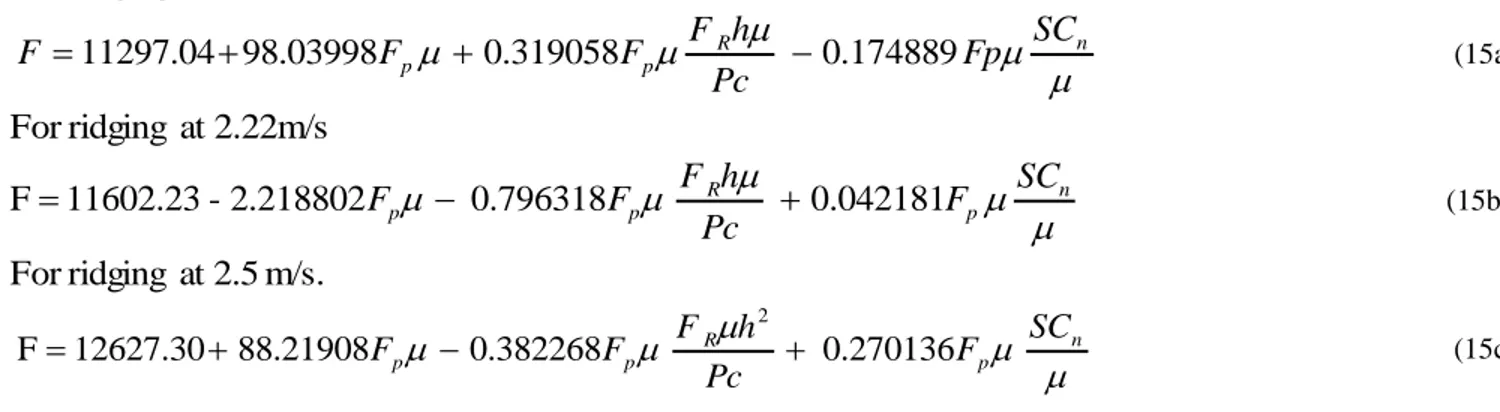
The developed models for ridging with different tillage speeds after substituting the coefficients are:
1.94m/s
at
ridging
For
174889
.
0
319058
.
0
03998
.
98
04
.
11297
R np p
SC
Fp
Pc
h
F
F
F
F
(15a)2.22m/s
at
ridging
For
042181
.
0
796318
.
0
218802
.
2
-11602.23
F
np R
p p
SC
F
Pc
h
F
F
F
(15b)m/s.
2.5
at
ridging
For
np R
p p
SC
F
Pc
h
F
F
F
0
.
382268
0
.
270136
21908
.
88
12627.30
F
2
(15c)4.
RESULTS AND DISCUSSION
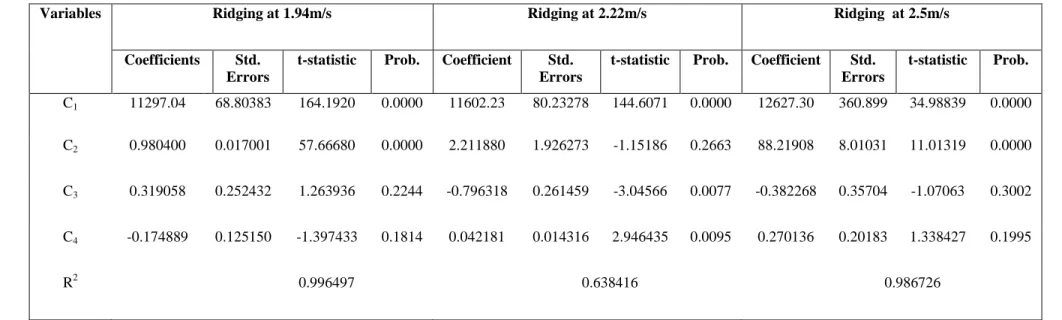
The values of coefficients for constants a, b, c and d as required to determine the predicted equations of 15a, 15b and 15c are shown in Table 2.
The analysis in Table 3 shows the summaries of the residuals and percentage errors of predicted and measured tractive force values. In ridging operations the residuals analysis depict the difference between measured
experimental results and predicted models which ranged from between –18.613 and 17.7697, percentage (%) error from -0.122620038 and 0.11606597, -21.2792 and 24.7827, percentage (%) error from -0.126307491 and 0.215127604 and -102.703 and 63.4651, percentage (%) of -0.603425382 and 0.372951166. The results of residual analyses and percentage (%) errors for ridging operations at all the tillage speeds showed no significance differences.
Table 3: Shows the residuals and percentage errors for ridging at various tillage speeds
ISSN: 2049-3444 © 2012 – IJET Publications UK. All rights reserved.
1662
Figures 1,2 and 3 illustrated graphical comparison between the measured and predicted values of tractive force for disc ridging at tillage speeds of 1.94m/s ,2.22m/s and 2.5m/s respectively. The values were plotted to find out if there are acceptable agreements between the measured and predicted tractive force values. The results showed positives linear relationships between the predicted and measured values of tractive force. These confirmed good agreement between measured and predicted values of tractive force with coefficients of determination R2= 0.996, 0.996 and 0.986 for the disc ridging speed of 1.94m/s, 2.22m/s and 2.5m/s respectively.
Figure 1: A plot of relationship between Measured and Predicted Tractive Force, at tillage speed of 1.94m/s,
ridging operation
Figure 2 : A plot of relationship between Measure Predicted Tractive Force at tillage speed of 2.22m/s, ridging operation
Analysis of variance (ANOVA) was used to show significance differences between the predicted and measured tractive force values for disc ridging operations at the various tillage speeds (Tables 4, 5 and 6 ). The analysis indicated that there are no significance differences(p≥0.05) between the measured and predicted dependent variables (tractive forces). The correlation coefficients of R2 = 0.9964, 0.7680, 0.9867 for disc
ridging, at 1.94m/s,2.22m/s and 2.5m/s respectively are clear evidence of the test of goodness of fits. These analyses revealed standard errors of 11.1534, 10.153, and 8.2421for disc ridging at 1.94m/s, 2.22m/s and 2.5m/s respectively. The values obtained are negligible and agree with the fact that the smaller the standard error values between measured and predicted results, the better the models. These high correlations and no significance difference between measured and predicted values, indicated that the developed models are good. These agree with the findings of Alder and Roessler, (1977) which state that the smaller the root mean square error (RMSE) values between measured and predicted results, the better the models.
Figure 3: A plot of relationship between Measured and Predicted Tractive Force, at tillage speed of 2.5m/s,
ridging operation
5.
CONCLUSION
The investigations on the tractive force efficiency of wheel tractors on agricultural soil during disc ridging operations were carried out. As a result, mathematical models for wheel tractor tyre-soil interactions using dimensional analysis were developed and validated by comparison with experimental data from agricultural field tests and computational results. These equations produced sufficiently accurate results for predicting the tractive force requirements of disc ridging in loamy sand soil at the reference tillage speeds. In this tillage operation, the highest coefficient of determination R2=0.996 was observed at speed of 1.94m/s. Their residual analyses and percentage (%) errors showed no significant difference (P > 0.05) and were ineligible values. The relative values of 11.1534,10.1535 and 8.24219 are the standard error values respectively. These are negligible and agree with the fact that the smaller the standard error values between measured and predicted results, the better the models.
ISSN: 2049-3444 © 2012 – IJET Publications UK. All rights reserved.
1663
Table 4: Analysis of variance between measured and predicted tractive force values at ridging speed of 1.94m/sdf SS MS F Significance F
Regress on Residual Total
1 18 19
635999.2 2239.193 638238.4
635999.2 124.3996
-8.6E-05 0.2439 NS
N.S: No significant different (P > 0.05) Regression Statistics: Multiple R 0.998244, R Square 0.996492, Adjusted R Square 0.996297, Standard Error 11.15346, Observations 20
Table 5: Analysis of variance between measured and predicted tractive force values at ridging speed of 2.22m/s
Source df SS MS F Significance F
Regression Residual Total
1 18 19
26305724 94800.09 95000.09
26305724 526.008
0.049965 0.825641 NS
N.S: No significant different (P > 0.05) Regression Statistics: Multiple R 0.052613 ,R Square 0.7680, Adjusted R Square 0.7520, Standard Error 10.15346, Observations 20
Table 6: Analysis of variance between measured and predicted tractive force values at ridging speed of 2.5m/s
Source df SS MS F Significance F
Regress on Residual Total
1 18 19
1959868 26324.37 1986192
19598868 1462.465
0.0009 1.0524 NS
N.S: No significant different (P > 0.05) Regression Statistics: Multiple R 0.993351 ,R Square 0.986746, Adjusted R Square 0.98601, Standard Error 8.24219, Observations 20
REFERENCES
[1] Adetayo, A.O; F.S Ogundare and O.K Ogundero(2004) Effect of Harrow passes on growth and yield of Soybean (Glycine max). Proceedings of The 5th International Conference and 26th Annual General meeting of the Nigerian Institution of Agricultural Engineers Vol. 26,2004.
[2] Alder, H.L and Roessler, E.B(1977).Introduction to Probability and Statistics. 6th Edition Dover Publication Inc USA. pp 373.
[3] ASAE Standard (2002). Terminology and definition for Agricultural tillage Implements ASAE S414, pp. 303.
[4] Barenblatt, G. I. (1987). Dimensional Analysis 2nd Ed. New York: Cordon an Breach Science Publishers.
[5] Hassan, A.E and R.S. Broughton (1975) Soil moisture criteria for Tractability. Can. Agricultural Engineering.Vol.17,pp 124-129.
[6] Kasprzak, W, Lysik and Rybaczuk, M(1990) Dimensional Analysis in The Identification of Mathematical models. World Scientific Publishing Co. Plc. Ltd. Singapore, 1990.
[7] Langhaar, H.L(1951) Dimensional Analysis and Theory of Models, John Wiley & Sons. Inc., New York, 1951
[8] Murphy, G (1950) Similitude in Engineering. The Ronald Press Company, New York.
[9] Nkakini, S.O; A.J Akor; I.J.Fila and J. Chukwumati (2008) Investigation of soil Physical property and Okra emergence rate potential in sandy loam soil for three tillage practices. Journal of Agricultural Engineering and Technology (JAET),Vol.16 (No.2) December, 2008.
[10]Onwualu A. P; Akubua C. D. and Ahaeku I.E. (2006) Fundamentals of Engineering Agriculture. Immaculate Publications Limited, 1st Published 2006 Enugu-Nigeria, pp. 79 – 127.
[11]Sefa,T and Kazim, C (2004) Modeling the Torque and Power Requirements of Traction Tires of Horticultural Tractors Using Dimensional Analysis. Mathematical and Computational Application, Vol. 9, No. 3, pp. 427-434, 2004. Association for Scientific Research.
[12]Upadhyaya S. K. (2003). Dimensional analysis and Similitude applied to soil-machine systems. Transaction of the ASAE 39(2): 377-384.
[13]Wong, J.Y (1993) Theory of Ground Vehicles.2nd Edition. John Wiley & Sons, New York, 1978.
ISSN: 2049-3444 © 2012 – IJET Publications UK. All rights reserved.
1664
submitted in partial fulfillment of the requirement for the Degree of philosophy in the Faculty of Engineering. Built Environment and Information
Technology, University of Prestoria Pretoris, Oct. 2005.
APPENDIX AH 1: Measured and Predicted Tractive Force Values at various Harrowing Speeds
Ploughing at 1.94m/s Ploughing at 2.2m/s Ploughing at 2.5m/s Measured Predicted Measured Predicted Measured Predicted
16745.7 16750.2 17225 17323.6 17670 17653
16770 16727.6 17320 17348.8 17665 17660.7
16725 16734.5 17325 17303.9 17670 17640.3
16649 16788 17375.3 17401.7 17720 17712.5
16710.3 16725.4 17270.7 17278 17615 17623.9
17758.3 17709.6 18318 18314.7 18663 18640.1
17062 17065.3 17222 17263.9 17567 17583.6
17025 17028.1 17210 17230.4 17555 17566.9
17250 17232.6 17363.3 17406.3 17708 17694.4
17150 17130.8 17332 17373.1 17672 17669.5
17080 17090.4 17230 17298.4 17575 17605.1
17079.7 17084.3 17730 17278.5 17575 17594.5
16672 16670.4 17232 17274.1 17577 17595.2
16575 16605.3 17135 17146 17480 17512.7
16485 16456.2 17045 17001.4 17390 17364.8
16270 16252.2 16850 16839.3 17195 17162.5
16190 16150.4 16725 16750.9 17070 17060.7
16500 16525.6 17060 17095.1 17405 17438.4
16075 16048.8 16635 16649.3 16980 16960.6
ISSN: 2049-3444 © 2012 – IJET Publications UK. All rights reserved.
1665
Table 2: Results of Least Square Method on Coefficients of Multivariable Regression Equations for Harrowing at Different Tillage Speeds
Variables Ridging at 1.94m/s Ridging at 2.22m/s Ridging at 2.5m/s
Coefficients Std. Errors
t-statistic Prob. Coefficient Std. Errors
t-statistic Prob. Coefficient Std. Errors
t-statistic Prob.
C1 11297.04 68.80383 164.1920 0.0000 11602.23 80.23278 144.6071 0.0000 12627.30 360.899 34.98839 0.0000
C2 0.980400 0.017001 57.66680 0.0000 2.211880 1.926273 -1.15186 0.2663 88.21908 8.01031 11.01319 0.0000
C3 0.319058 0.252432 1.263936 0.2244 -0.796318 0.261459 -3.04566 0.0077 -0.382268 0.35704 -1.07063 0.3002
C4 -0.174889 0.125150 -1.397433 0.1814 0.042181 0.014316 2.946435 0.0095 0.270136 0.20183 1.338427 0.1995