Introduction
The real estate market is of vital importance to market economies on both provisional rent and investment levels. For example, the housing market is one of the most important markets in the United States (Carrillo 2013). Real estate is the first source of bank loan guarantees and a lifelong family investment, thereby contributing to social wellbeing. Gat (1994) points out that the housing market has a unique characteristic in that the owner of the asset normally occupies the property and acts simultaneously as an investor and consumer of the real estate asset. In certain markets as in Hong Kong there are large proportions of owner investors as opposed to owner occupiers (Xiao et al. 2007, Wood and Ong 2013). However, in this article the housing market is going to be understood in a wider context and it is not going to be analysed in either owner occupier or owner investor perspective.
Various property evaluation methods are commonly used: the comparative method, which is the most frequently used (Rebelo 2002, Alcázar Molina 2003, Pagourtzi et al. 2003, Nebreda et al. 2006), the cost method (Barlowe 1986), and the income method (Alcázar Molina 2003, Trojanek 2010). In the real estate appraisal, the income method evaluates lease agreements (Alcázar Molina 2003) and it verifies the configuration of rents, vacancy rates and the lease duration (Deng et al. 2003). This method also considers the application of a corresponding capitalisation rate (cap rate)1) (Ghysels et al. 2007, Baum et al. 2011).
Abstract: The goal of this article is to analyse the relationship between rental
income and capitalisation rates when real estate value is assessed in parishes of the Lisbon and Porto municipalities. Based on housing market values in euros per square metre during the 2006-2009 period, the income approach was used to compare the two main types of apartments (i.e. B2, or two-bedroom, and B1, or one-bedroom) in Lisbon and Porto. We used the capital asset pricing model to calculate the risk measure. The cluster analysis was used to group the Lisbon and Porto parishes according to their rental income and capitalisation rates. Regressions were used to model both geographical markets. Clear differences were found between Porto and Lisbon, the results being more robust for the Porto municipality in regard to B2 apartments. Moreover, rental income is inversely proportional to capitalisation rates for B1 apartments for Porto parishes, which means that there is an initial overinvestment.
Key Words: real estate appraisal, income approach, cap rates, real estate investor, cluster analysis, Lisbon, Porto.
RENTAL INCOME AND CAP RATES:
A COMPARISON OF THE LISBON AND PORTO
HOUSING MARKETS
António C. MOREIRA*, Fernando O. TAVARES**, Elisabeth T. PEREIRA* *DEGEIT, GOVCOPP, Aveiro University, Portugal
**ESTGA, Aveiro University, Portugal
1) The capitalisation rate represents the annual return on an investment before mortgage payments and income tax. To find the Cap Rate, it is possible to use the following formula: Cap Rate = (Net Sales Value / Market Value) x 100. The Cap Rate in real estate is used as an income measure. The higher the Cap Rate the better the investment.
Using the income method in the real estate appraisal requires the knowledge of techniques to estimate future rent projections and to update these as needed. Appraisers must understand the quality and duration of contracts, the costs related to the property (i.e. pertinent physical, functional and technological downgrades) and, naturally, the discount rate (Kwong and Leung 2000, Shimizu and Nishimura 2007). These elements serve the purpose of determining the market value of the real estate property.
In the real estate market, the price formation process is subject to frequent non-rational behaviour (Scheinkman and Xiong 2003, Hong et al. 2006, Hayunga and Lung 2011). As a result, market prices often experience large short-term changes, although, in the long run, prices tend to fluctuate around properties’ fundamental value, thus representing the prices that truly matter to investors (Gordon and Shapiro 1956, Fu and Ng 2001, Grimes and Aitken 2010). The classical finance theory asserts that the law of financial risk and return is universal, as assets are normally traded in frictionless markets in which the investor sentiment is set aside (Markowitz 1952, Gat 1994). In this approach, property is seen as a productive asset capable of generating rent at a particular level of revenue. This perspective is applicable to both real estate and stock markets. The market value based on actual income is interpreted as the maximum sum that a knowledgeable investor is willing to pay for the acquisition of an asset, particularly related to its present occupancy rate and rental income (Ruback 1995). However, as Clayton et al. (2009) posit, this present standard value model has been unable to explain crashes in real estate asset prices. This clearly indicates that real estate market investors live in, and take advantage of, information asymmetry. For example, Tavares et al. (2013) conclude that real estate market brokers tend to give potential buyers information on positive externalities and tend to hold information on less positive characteristics of the quality of the dwelling or potential negative externalities.
Therefore, clear differences exist between real estate and stock markets as investor sentiment is not set aside in the former (Gat 1994, Hayunga and Lung 2011). Moreover, owners in real estate markets are simultaneously investors and consumers of the asset (Gat 1994). The particularities of household finance are also important as household behaviour is difficult to measure as there are differences in the diversification of financing tools as well as in the mortgage refinancing tools among household investors (Campbell 2006). It is also important to refer that expected returns and expected return growth in rents behave differently among commercial real estate, industrial properties and apartments (Plazzi et al. 2010).
For example, in real estate appraisal, investors must know the average capitalisation rates (hereafter cap rates) of the different areas and/or market segments, as these are grouped by financial, economic, and geographic traits. Therefore, knowledge of cap rates is important, as it is verifying the possibility of geographical or financial arbitrage, naturally returning to fundamental risk and profitability considerations. Moreover, location plays a key role in property evaluation (Laakso 1992, Yiu and Tam 2004, Osland et al. 2007).
There are several studies analysing properties and real estate markets with some of them using cap rates (Das 2015, Peng 2016) and others (Van Ommeren and Koopman 2011, Stewart 2012) using rental income. However, both methods are seldom used simultaneously. Based on the income approach and the aforementioned differences between real estate and stock markets, the main objective of the present study is to compare the relationship between cap rates and rental income in the two principal urban residential markets in Portugal – Porto and Lisbon. In terms of a recent historical and geographical perspective, the housing markets of Lisbon and Porto are relevant cases of study, either by the reconstruction of old buildings and their rehabilitation and reconversion, or by the construction of new houses, offices and commercial buildings.
These cities were selected because they are the two largest ones in Portugal and differences were expected not only between the two cities but also within them (Moreira et al. 2014). Moreover, there are studies characterizing those two markets, Lisbon being one of the most expensive cities in Europe (Lourenço and Rodrigues 2014, Moreira et al. 2014) while Porto lies in the Portuguese region with the lowest prices, despite being the nation’s second largest city (Couto et al. 2006, Afonso and Melão 2007, Ferreira 2010, Moreira et al. 2014). As most of the studies of residential markets cover both houses and apartments, or real estate more generally, including residential and commercial properties, this article only analyses a specific segment of the housing market, namely apartments. It also assesses the relationship between cap rates and market value.
The paper is divided into six sections. After the introduction, section two surveys the relevant literature. The third section briefly describes the Portuguese housing market, while section four focuses on methodology and research data. Section five analyses Lisbon and Porto’s housing market values based on rental income and cap rates for B12) and B2 apartments from 2006 to 2009. The last section presents the main conclusions of the study.
Review of the literature
The volatility and (in)efficiency of the real estate market compared with the financial market has been acknowledged in the literature for some time (Gat 1994, Fu and Ng 2001). This has led real estate researchers to seek to explain differences not only between the two markets but also within the real estate market.
After analysing the Hong Kong real estate market, Fu and Ng (2001) argue that real estate returns have an abnormally low coefficient of variation relative to other risky assets, which can be attributed to the appraisal smoothing problems due to the prolonged price adjustment to market news in real estate markets. Differences between the low and high-rent ends of residential market segments can be explained by the strong (low) rental pressure associated with low (high) quality, high (low) risk neighbourhoods demanding high (low) rates of return (Gat 1994). After examining the relationship between risk and return in residential spatial markets, Gat (1994) found that residential markets may not mimic financial markets in terms of risk and return due to two important variables: the location of residential assets and the quality of housing products.
As Gat (1994) claims, the nature of residential markets is influenced by the presence of owners who are simultaneously investors in, and consumers of, assets. According to the resale option and overconfidence theories (Scheinkman and Xiong 2003, Hong et al. 2006), current buyers of commercial property tend to take a short-term perspective and believe they can and/or will sell their property to a future purchaser who will pay a higher price. This, not unexpectedly, makes commercial property prices more volatile than residential property prices (Kwong and Leung 2000).
In related research, Grimes and Aitken (2010) studied the regional housing market of 73 regions in New Zealand. Their results demonstrate the importance of housing supply elasticity in sustaining the short-run price spikes and regional price dynamics. The dynamics of urban
2) Data of the property analysed is based on the following description normally used in secondary market data available in Portugal: Bn stands for an apartment with the number of bedrooms (n), plus a living/dining room and a separate kitchen. As such B1, B2, B3, B4 and B5 represent the number of bedrooms of the residential properties analysed (plus a living/dining room and a separate kitchen). It is important to refer that the B0 typology (known as studios or single dwellings) also exits in Portugal. In this typology the bedroom is not separated from the living/dining room. However, in the database analysed in this study, B0 apartments were included in the B1 category. As such they were analysed as one-bedroom apartments.
residential property prices were also examined by Wang (2004), who concluded that the lack of transaction information may not be the source of market efficiency.
When investors or households appraise how much to pay for residential property there is a large number of considerations: quality, size and amenity of accommodation; neighbourhood conditions – social, environmental, etc.; age of construction; design issues; relative location with respect to jobs, schools, shopping centres, cultural facilities; transport systems; interest rates and so on, that reflect end-user preferences (Shimizu and Nishimura 2007). These issues vary hugely between city suburbs. Moreover, real estate brokers possess information about the behaviour of market prices that are not available to potential buyers, which makes housing/real estate market data costly.
The income method identifies the market value of a real estate property by its capacity to produce rental income (Rebelo 2002, Alcázar Molina 2003, Baum et al. 2011). This value is given as the quotient of the net periodic income divided by its respective update rate. This method has the advantage of verifying the compatibility between market prices and property values (Hendershott 1998, Gallin 2006). This aspect offers benefits to financial entities, namely, those that manage real estate funds, in which rental income is a key component (Alcázar Molina 2003).
Alcázar Molina (2003) argues that the economic value of an asset is proportional to the economic income it generates so that this type of evaluation requires an analysis of lease contracts. The income method, thus, must verify the configuration of rents, vacancy rates and lease duration (Deng et al. 2003). Hendershott (1998) pioneered the estimation of risk premiums for the different classes of real estate property. In addition, this author’s work explains the adjustments of long- and short-term housing prices. Black et al. (2006), in turn, state that the income method examines the relationship between fundamental values, market prices and speculative bubbles in the housing market.
The net present value model has been extensively used in real estate markets. For example, Campbell (1987) applied it while studying consumption and permanent income. Campbell and Schiller (1987) used a linear function to test and validate the current discounted values. Meese and Wallace (1993) also employed this approach when they examined the short- and long-term house prices in the residential market of northern California.
Jud and Winkler (1995) used a model based on real estate cap rates and concluded that capitalisation rates respond to changes in capital market spreads. Ghysels et al. (2007) found that the use of cap rates in the prediction of returns is economically significant. In addition, they estimate the market value of real estate property as the value of its current and future incomes. French (2004) also asserts that, for most common types of properties, their market value is based on their potential income as these are seen as an investment. In this context, Grenadier (2005) and Tabner (2007) state that the income method verifies the fundamental values and it compares them to market values.
Wang and Zhou (2000) demonstrated that developers supply more units than the housing market can absorb. Nevertheless, developers tend to avoid lowering prices or rental rates in order to eliminate vacancy rates, which impact cap rates. Other studies relate cap rates to rental income. Froland (1987), after analysing data from 1970 to 1986, concluded that a strong correlation exists between cap rates of property specific investments (residential, retail, office and industrial property) and the return from capital markets (property-specific mortgages and treasury bonds). Gallin (2006) relates housing prices to incomes, verifying that, when prices are high in comparison to the rental income, modifications occur in real incomes that are larger than normal, and vice-versa. Gallin (2006) concludes that the ratio of rental income to price is
an indicator of the potential valorisation of the real estate market. Hungria-Garcia et al. (2004) discuss various studies that applied cap rate models to diverse countries with the objective of obtaining a better model for determining properties’ income that allows evaluations and analyses.
It is clear that is a huge debate regarding the importance of property investments as their rates/ returns are subject to a large number of independent variables (positive/negative externalities, intrinsic characteristics of properties, shifts of domestic public policy, infrastructure investment, demographic trends, major economic shocks, among many others), with complex feedback loops, that make housing/real estate appraisal really complex. The length of anticipated investment, as well as risk/reward considerations, add to the complex of appraising property investments as political interference/decision-making may strongly influence cap rates/returns of property investment. Moreover, fiscal structures might also influence the type of investment, which is not the case in Portugal as capital gain taxes from property investment have the same fiscal treatment as capital gains from the stock market.
Aspects of the Portuguese real estate market
Porto and Lisbon residential markets have been historically influenced by the public policy. They are the largest cities in Portugal. Lisbon and Porto have populations around 500 000 and 240 000 inhabitants, respectively. The greater Lisbon area hosts around 2 million inhabitants whereas the greater Porto area hosts 1.3 million inhabitants (INE 2015).
Geographically, both cities are nearly 300 km apart. Porto, being the capital of the northern part of the country, has an important historical heritage. Lisbon has also an historical heritage but it has been influenced by such important events as being declared the European Capital of Culture in 1994 and holding the 1998 Lisbon World Exposition. The latter led to several massive infrastructure investments such as the Vasco da Gama Bridge (then the largest in Europe), a new line for the Lisbon Metro, and a new central multi-modal terminal featuring trains, metro, buses and taxis. All these spurred real estate investments in the recent past. In 1996, UNESCO recognised the historic importance of Porto when its historic centre, with its exceptional cultural, patrimonial and land scape value, was added to its World Heritage List. Such events impacted the evolution of property markets in the 2000s differently in the two cities. Real estate investments in Lisbon expanded rapidly, whereas Porto’s real estate market was conditioned by the urban rehabilitation policies.
Urban rehabilitation in Portugal started, more generally, in the late 1960s as it was a latecomer to the industrial revolution and it did not suffer the devastating consequences of the Second World War (Pinho 2009). However, the priority of the Portuguese government at that time was to supply social housing as there were strong migratory currents to Porto and Lisbon (Madeira 2009), including the plan to improve the situation in Porto and to construct new houses in Lisbon (Silva 2012).
The 1970s saw new programs launched for the recovery of degraded urban areas (PRAUD) that targeted illegal neighbourhoods and run-down industrial areas (Madeira 2009). In the 1990s, new programs were launched to address the rehabilitation of Lisbon and Porto historical centres – RCRIA, REHABITA, RECRIPH, SOLARH – in which the State supported (a) conservation projects for certain important buildings while (b) municipal authorities financed the reconstruction of old urban buildings (Silva 2012). In 2004, urban rehabilitation societies were legally created (Law 104/2004) and given the power to acquire and rehabilitate property and redefine their uses. These societies normally worked closely with municipal authorities and strongly influenced local housing policies.
the nation’s capital and by the Portugal’s highly centralised territorial, industrial and political strategies, giving it stronger institutional weight. In contrast, Porto’s population has tended to stabilise or even to register a slight decline. However, both Lisbon and Porto have continued their territorial expansion by absorbing fringe settlements, although Lisbon’s metropolitan area is better consolidated than the one of Porto’s (Gato 2013).
The evolution of the Portuguese residential real estate market has been studied by Tavares et al. (2014), who claim that, after a boom period commencing in the early 1990s, Portugal went from a situation of housing shortage to a housing surplus in the 2000s. According to Tavares et al. (2014), one of the reasons for the large increase in the housing stock, especially from 1997 onwards, was that Portugal became a member of the European Union, which led to lower domestic interest rates. Eurozone membership then saw a large increase of the housing loans compared to other private loans and, simultaneously, a substantial rise of private indebtedness. Given the high levels of both private and public debt, the global financial crisis commencing in 2007 savagely impacted the Portuguese economy and especially the housing investments. The analysis of the housing market prices reveals that, between 2003 and 2009, Algarve was the region of Portugal with the highest prices, followed by the Lisbon region. The northern region, where Porto is located, had the lowest prices overall.
The annual growth rate of housing loans in Portugal has been steadily decreasing since 2001, while in Spain this decrease was noticeable from 2008 onwards as a consequence of the subprime crisis. However, the price of dwellings per square metre is larger in Portugal (and Lisbon) than in Spain (and Madrid), which makes Lisbon one of the most expensive capitals of Europe. Moreover, Portugal has a price-to-income ratio3) of 105, only behind Germany in the European Union (Lourenço and Rodrigues 2014).The worrying construction confidence index was similar to the consumer confidence index even before the global financial crisis. Both indices have recorded substantially lower values since 2002, and they represent one of the reasons for the rate fall of new home construction. Tavares et al. (2014) refer that the doubtful loans to construction companies have quintupled in the previous six years. Another interconnected negative impact of the global financial crisis is the rise in the youth unemployment rate, which reduces the potential demand for new homes and, in turn, raises job losses.
Before the early 2000s, Portugal’s housing market had met rising demand and shortages through mass construction, but supply proved excessive and resulted in a saturated market while real estate construction subsequently decreased. The Portuguese residential market has been characterized by the purchase of a home, where the owner investor plays a fundamental role, but this market has been extremely influenced in recent years by the nation’s unfavourable economic performance. Finance for house purchase became expensive and less accessible to the majority of the Portuguese, leading to a significant reduction in the activity of this market (Tavares et al. 2014). However, from the end of 2013, a recovery of this sector began to be visible, particularly in the cities of Lisbon and Porto. Foreign investment, which was traditionally directed to Algarve because of its tourism attractiveness, kicked off this new momentum in the market, and to this end, programs to stimulate foreign investment, such as the ‘Golden Visa’ and the ‘Tax Regime of the Resident Status’, were created to allow foreign investment in real estate and to permit residence in Portugal to foreign citizens (Mesquita 2014).
3) The price-to-income ratio looks at the total cost/price of a home/property relative to median annual incomes. The higher the price-to-income ratio, the costlier the property is to acquire. At its most basic level, the price-to-income ratio is a benchmark for understanding how expensive houses/properties are.
The Portuguese housing market is characterised, as many markets are, by an insufficient transparency that results from, on the one hand, the asymmetrically distributed information and, on the other hand, the agents’ inability to exploit this information properly. Moreover, differences exist across geographic markets that need to be understood. For example, the lack of a long-term housing policy and prolonged rent-controlled leases imposed by the state have led to (Vilaça and Guerra 1994):
(1) The decapitalisation of proprietors,
(2) Lack of investment in new housing and maintenance, (3) Speculation regarding new leases.
Despite these negative trends, Ferreira (2010) describes how public housing strategies helped the Lisbon metropolitan area to build regional, social and economic interconnectedness. Pereira’s (2013) case study further refers to how urban housing plans supported the transformation of industrialised, low socioeconomic metropolitan areas into high-end, elite metropolitan areas. Finally, Afonso and Melão (2007) analysed the Porto municipality from a socioeconomic point of view, including this city’s central core and interrelatedness with nearby cities.
Since the beginning of the 2000s, researchers have observed that the economic cycles of the United States, Europe and Japan are coinciding and that they are at their lowest levels. More specifically, Portugal’s economic growth rates have been below the European Union average (Aubyn 2007). After the global financial crisis, the Portuguese economy went through extremely difficult times, requiring tough budgetary management to constrain public debt and the exercise of credit constraint, thereby lowering investment, with pervasive negative consequences for the real estate market, in which the average house prices, in terms of €/m2, follow a downward trend by both region and dwelling type (Tavares et al. 2014). Although Europe and Japan were still struggling, the US GDP, in contrast, rebounded quite strongly. Indeed, Portugal´s annual GDP growth rate turned strongly negative for much of 2012. Despite this, the Portuguese housing market has behaved differently to Spain’s, although there are several similarities between the two countries’ business cycles. During the last three decades, Portugal’s residential market experienced a lower volatility compared with Spain’s and none of the speculative bubbles (Lourenço and Rodrigues 2014).
At the end of the 20th century, most residential property transactions in Lisbon and Porto shifted geographically to the suburbs and especially to the urban fringe, where housing prices were cheaper while there was good transport accessibility (Fonseca et al. 2002, Meijers et al. 2012). According to Fonseca et al. (2002: 16): “The decrease in the number of inhabitants of
the city, which has mostly been due to the active young people moving to the suburbs, has been reinforced by the tertiarization of the central areas and by the exponential increase in the prices of land in the more central and ‘noble’/‘high social status’ areas”. Only in 2014, a
recovery in demand for inner city residential accommodation in Lisbon and Porto became visible, partly driven by a slump in the fringe new home construction as a result of the global financial crisis. But other factors were equally, if not more, important, including the successful programs to encourage foreign investment, new economic and fiscal policies, legislation to promote urban rehabilitation, city planning strategies, and increased in-bound tourism. Collectively, these processes triggered large investments residential accommodation and a near total renewal of those cities’ urban centers.
Using the income approach, Couto et al. (2006) found that the parishes in the historical centres of Porto and Lisbon generated very low market coefficients as defined by the average transaction value of each parish compared to a reference value for each Porto or Lisbon district. They claim that the main reason behind the low market coefficients is that they reflect long-held residential markets with a low turnover of properties, normally dominated by commercial uses, and with low demand from those searching for apartments. This study also
found that proximity to highways is very important in increasing the demand for residential property, and therefore its price, as such infrastructure enables good access to work, shopping, recreation, and education. Finally, Lisbon, Porto and Coimbra, with overall coefficients between 0.95 and 1.15, were found to be the main sought-after regional markets since they are the country’s main industrial development poles. Moreover, they include the important historical centres that led to the development of new industrial and residential areas.
Tavares et al. (2014) also analysed the Portuguese housing market over time. They concluded that differences in unit house prices (in Euros per square metre) exist not only among several regions, and especially between the metropolitan areas of Lisbon and Porto, but also among the different types of housing, in which B1 houses were the most expensive ones, followed by the B5, B4, B2 and, finally, B3 houses. Moreover, these differences remained stable over time. Finally, Moreira et al. (2014), using the income approach when analysing Portuguese municipalities, found that Lisbon, Cascais, Oeiras, Loures, Amadora, Almada and Porto were the municipalities recording the highest housing market rental incomes, for both B1 and B2, in terms of Euros per square metre.
As seen before, the real estate market is highly complex and potentially unstable, both in terms of processes and actors as there are: (1) a considerable variability in the operation of housing markets over time, influenced by the macro-economic conditions and domestic public policy responses; (2) important factors such as (un)employment, job security, demographic changes, land-use planning, infrastructure supply investment, among others, that influence the domestic housing market conditions; (3) quality governance issues that may influence Portugal’s attractiveness in front of other EU countries in relation to real estate investments; (4) changing responses of the construction companies / property developers to items 1-3 referred above; (5) changing preferences in residential accommodation over time; (6) potential differences in the way all these issues play out in different geographical / industrial environments.
Methodology
The present empirical study used the real estate Confidencial Imobiliário’s database of statistical series for 2006, 2007, 2008 and 2009, which are the only years currently available. Time series data regarding the market value, in € per square meter (€/m2), of the residential markets of the Lisbon and Porto metropolitan areas were used. The sample of apartments used in this study was restricted to the B1 and B2 categories because of the limited data on B3 and B4 apartments. Thus, two quarterly data series were constructed: one for B1 apartments and another for B2 apartments. In addition, the net present value of the properties in €/m2 was calculated for both categories.
Based on the analysis of the database and to eliminate severe outliers, the properties with the following characteristics were removed: monthly income greater than €25 000 and lower than €50; and areas greater than 500 m² and smaller than 10 m². Moreover, in order to smooth the information, properties with the following characteristics were removed: monthly income greater than €50/m2 and lower than €2/m2. In this way, a group of series were obtained for 10 parishes in the municipality of Porto and 37 parishes in the municipality of Lisbon. In order to evaluate the evidence of the income model to the reality of the Portuguese housing market, the perpetuity model referred to by Brown and Cliff (2005), Geltner et al. (2007) and Clayton et al. (2009) was used.
For Clayton et al. (2009), the equilibrium price of the property in period t, , should be equal to the current value of discounted Net Operating Income (NOI), assuming an adjusted, constant and unleveraged risk rate . That is,
where:
T is the expected period of exploitation in years; NSPT is the expected liquid sale of the product in year T; NOI represents the group of expected liquid revenue.
According to Geltner et al. (2007), it is possible to simplify the above formula at the moment t, given that the NOI foresees a constant growth rate , making a function of the expected growth of NOI and of the specific discount rate of property of the adjusted risk rate. That is:
where:
is the cap rate of equilibrium at t;
gt is the growth rate of NOI at moment t, and it is expected to be constant. Normally, the growth rate corresponds to the valorisation of the property.
(3)
In this study, the evaluation carried out through the income method was obtained through the discount rate calculated through the Capital Asset Pricing Model (CAPM). This model was developed by Sharpe (1964) and Mossin (1966) and based on the equation (4):
(4) where:
E(Ri) is the expected rate of return; Rf is the free risk interest rate; E(Rm) is the expected market return; βi is the beta for B1 and B2 types.
Beta was calculated by the equation:
(5) where:
Cov(Ri, Rm) represents the covariance between profitability of the analysed categories (B1 and
e t P t
r
t g e t P e t R(
)
e t t tR
r
g
( )
i f i( (
m)
f)
E R
R
B E R
R
( ,
)
(
)
i m i mCov R R
Var R
1 2 2 3 3 2 3(1
)
(1
)
(1
)
...
(1
)
(1
)
(1
)
(1
)
e T T T t T t t t tNOI
NOI
g
NOI
g
NOI
g
NSP
P
r
r
r
r
1 1 11
(
)
(
)
e e t t e t t t t tNOI
NOI
P
P
or
r
g
R
NOI
r
g
B2) and the market return profitability;
Var(Rm) represents the variance of the market profitability return.
The interest rate series of treasury bonds at a fixed rate, with a two-year period, was used as a proxy of Rf. The market profitability values were calculated by taking into account the average cap rate values for the corresponding quarter. These were calculated separately for B1 and B2 apartments.
Beta was calculated by the formula (5) for B1 and B2 apartments. The beta value for B1 housing is 1.055 and for B2, 1.036. As beta is a risk measure, it can be concluded that the risk of B1 apartments is higher than that of B2.
The cap rates for all parishes were also calculated for the values presented in the sample. Cap rate values are calculated by dividing the profitability value by the value of the supply price (Ling and Archer 2006). According to Laia (2007), the formula for the cap rate can be written in the following manner:
(6) where:
V0 is the value of the real estate property;
R1 is the foreseen return for the first year of exploitation; y1 is the initial cap rate.
By knowing a certain property and the market cap rate for similar properties, this formula can be used to calculate the property’s value. This is the formula for perpetuity without growth, which implies that the property’s profitability will remain constant in the future.
In the present study, the cluster analysis was used to aggregate the values of rental income and cap rates for the data series of Lisbon and Porto municipalities. Various hierarchical aggregation criteria were used to demonstrate that the differences between clusters are statistically significant (Marôco 2007). The cluster analysis is a multivariate technique that has a primary purpose grouping objects (parishes) based on characteristics (cap rates and rental income), such that the cluster exhibits high within-cluster homogeneity and high between-cluster heterogeneity. We used the single linkage between-clustering method for generating income rents for B1 and B2 apartments in Lisbon and Porto parishes. As we reached three clusters for the income rents, for both cities, we decided to use the number of generated clusters (three) for clustering the cap rate. The centroid linkage criterion was applied for clustering cap rates for B1 and B2 apartments both in Lisbon and Porto.
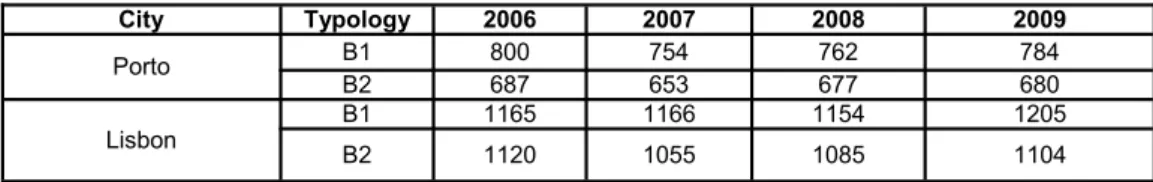
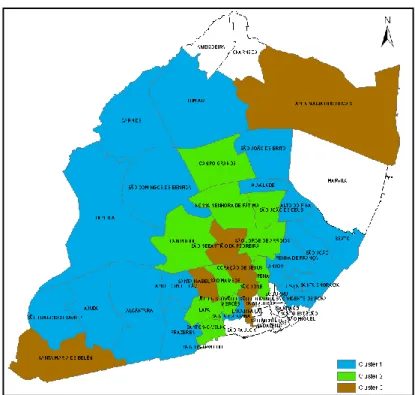
To facilitate the visual representation of the clusters, we represented them into figures – not to scale – for both Lisbon and Porto. The clusters in both cities are represented in different colours. There are certain parishes that are not included in the analysis as the data did not cover the threshold value of 30 transactions per parish per year to be included in the analysis. In those cases, the parishes were left in white (without colour). The total number of analysed properties are shown in Table 1.
To analyse the differences between the two selected markets, we decided to use the Pearson correlation – between values of rental income and the cap rates for each parish – for Porto and Lisbon parishes, for both B1 and B2 apartments.
1 0 1
R
V
y
Multiple linear regression analysis was used to model the functional relationship between several independent variables and the dependent variable. The average market value is the dependent variable. Initially, the model included the following variables: discount rate, gross national product (GDP), growth rate, cap rate clusters, population density and the evaluation of housing values (net present value). This composition was based on the model developed by Clayton et al. (2009). However, as the discount rate and the GDP growth rate were not statistically significant, they were removed from the model. The used discount rate is the one calculated through the capital asset pricing model (CAPM). Durbin-Watson and F statistics were used to guarantee that the data evaluated in the regressions did not present collinearity.
Results and Discussion
Analysis of the parishes of Lisbon. Table 2 presents the average rental income in €/m2 of Lisbon parishes for the three clusters found for B1 and B2 apartments, for the 2006-2009 period. It should be noted that, except for the parishes of Santa Isabel and S. Maria de Belém,
City Typology 2006 2007 2008 2009 Porto B1 800 754 762 784 B2 687 653 677 680 Lisbon B1 1165 1166 1154 1205 B2 1120 1055 1085 1104 Table 1
Total number of analysed properties
Fig. 1 – Representation of rental income clusters for B1 properties for the
the B1 category has superior rental income than B2 apartments have. Moreover, the average rental income of B1 housing is 15% larger than the rental income of the B2 category.
The cluster analysis of Lisbon parishes (Fig. 1, Fig. 2) resulted in a group of three clusters. The differences between Clusters 1, 2 and 3 are statistically significant with a confidence level of
Table 2
Average (€/m2) and standard deviation of rental income for the parishes of Lisbon
B1 B2
Parishes Aver-age Stand. Devia-tion Clus-ter Cluster Ave-rage Parishes Aver-age Stand. Devia-tion Clus ter Cluster Ave-rage S. Sebastião Pedreira 14.15 1.59 3 14.06 S. Sebastião Pedreira 12.74 1.17 3 12.08 Encarnação 13.97 2.51 Encarnação 12.59 1.89 Coração de Jesus 13.47 1.65 2 11.85 Santa Isabel 12.38 2.03
São João de Deus 13.40 1.25 S. Maria de Belém 11.91 0.73
São Mamede 13.18 1.89 S. Maria Olivais 11.82 0.84
Mercês 13.07 1.40 Coração de Jesus 11.63 1.30
Santa Maria
Olivais 13.05 0.91 São José 11.52 1.90
São José 12.94 2.22 Pena 11.27 0.69
2 10.73
Santa Catarina 12.74 1.61 São Mamede 11.22 0.55
Campolide 12.65 0.93 Campolide 11.16 1.38
N. Senhora Fátima 12.33 1.00 Mercês 11.02 1.46
Campo Grande 12.31 1.07 Lapa 10.74 0.80
Santa Isabel 12.05 1.22 Campo Grande 10.50 0.99
São Jorge Arroios 12.04 1.18 N. Senhora Fátima 10.47 0.81
Lapa 12.00 0.88 S. João de Deus 10.33 1.83
S. João de Brito 11.92 0.68 São Jorge de Arroios 10.29 1.20
Prazeres 11.88 1.00 Santos-o-Velho 10.29 1.10 S. Domingos Benfica 11.84 0.65 Alvalade 10.19 1.11 1 Pena 11.77 2.35 Prazeres 10.12 1.20 9.43 S. Francisco
Xavier 11.76 1.05 S. Francisco Xavier 10.03 0.85
Santo
Condestável 11.66 0.83 Santo Condestável 10.00 0.74
Alcântara 11.65 1.09 S. João de Brito 9.95 0.77
Carnide 11.59 0.86 Santa Catarina 9.91 1.42
São João 11.44 1.84 Graça 9.86 1.62
Graça 11.35 1.21 Alto do Pina 9.75 1.44
Alto do Pina 11.29 0.78 Carnide 9.53 0.80
S. Maria Belém 11.25 1.42 S. Domingos Benfica 9.44 0.48
Alvalade 11.24 1.11 Benfica 9.39 0.62
Lumiar 11.24 0.89 Lumiar 9.32 0.59
Penha de França 11.16 0.64 Santa Engrácia 9.22 0.80
Ajuda 11.14 1.73 Alcântara 9.20 0.71
Santos-o-Velho 10.95 1.31 S. Vicente de Fora 8.95 0.91
Anjos 10.90 1.40 Ajuda 8.91 0.75
Benfica 10.63 0.82 Beato 8.77 0.73
Santa Engrácia 10.56 1.29 Anjos 8.69 1.21
S. Vicente de Fora 10.54 2.34 Penha de França 8.67 1.19
Beato 9.43 1.24 1 9.43 S. João 8.67 0.64
95% for B1 apartments and of 99% for B2 apartments. As shown in Table 2, the rental income clusters for B2 housing are more homogenous than are those of B1.
Table 3 presents the average cap rates for Lisbon parishes, as well as for the three clusters encountered for both B1 and B2 apartments (Fig. 3, Fig. 4). Because this cluster analysis served as a basis for the construction of the regression models, the Lisbon parishes that presented standard deviations of the rental income larger than 1.5 were removed as the variability found amongst the standard deviations were abnormally large when compared with the average found. These parishes exerted an impact on the regression residuals that did not permit the presentation of well-adjusted models.
In Lisbon parishes, the average cap rates for B1 apartments (5.38%) are greater than the average cap rates for B2 housing (5.12%), as shown in Table 3. Notably, this difference in averages is reflected in the fact that 15 parishes have an average cap rate of B1 apartments greater than that of B2 housing. The parish of São Francisco Xavier is the only one that presents similar average cap rates for B1 and B2 apartments. In turn, only eight Lisbon parishes present greater average cap rates for B2 housing in comparison with B1 apartments. In regard to the standard deviation of cap rates for Lisbon parishes, the results verify that both B1 and B2 apartments present similar values of 0.49. Heterogeneity is high, given that 11 parishes have a standard deviation of the B1 cap rate larger than the standard deviation of the B2 cap rate, while 11 parishes have a standard deviation for the B2 cap rate greater than the B1 cap rate. Only two parishes, Santos-o-Velho and Carnide, present similar standard
Fig. 2 – Representation of rental income clusters for B2 properties for the
deviation values for B1 and B2 housing.
The agglomeration of average cap rates (Table 3) is more homogenous for B2 apartments than for B1 housing in the three clusters encountered. The differences between Clusters 1, 2 and 3 – for both B1 and B2 apartments – are statistically significant at a significance level of 1%. The Pearson correlation between the average values of the rental income and cap rates for Lisbon parishes for B1 housing is 0.288 and for the B2 category, 0.385. Table 4 presents the regressions for B1 and B2 apartments for Lisbon parishes. The regression models were studied for the values of €/m2 for B1 and B2 apartments.
Models for B1 and B2 are robust. For B1 apartments, it is possible to conclude that market values for clusters 2 and cluster 3 have a devaluation of €291.101 and €350.173 per m2, respectively, in relation to cluster 1, based on the different cap rates for those clusters. The Lisbon market behaves similarly for B2 apartments, although it is possible to conclude that the devaluation is lower for cluster 2 than for cluster 3, respectively of €155.632 and €357.468 per square metre.
Table 3
Average (%) and standard deviation of cap rates from the parishes of Lisbon
B1 B2
Parishes Ave-rage Stand. Devia-tion Clus-ter Clus-ter Ave-rage
Parishes Ave-rage Stand. Devia-tion Clus ter Clus ter Ave-rage S. Maria dos Olivais 6.01 0.47 3 5.86 S. M. Olivais 6.04 0.53 3 5.67 Mercês 5.85 0.71 S. M. Belém 5.73 0.37
Penha de França 5.81 0.33 Campolide 5.69 0.74
Prazeres 5.75 0.54 Beato 5.59 0.48
Campolide 5.66 0.52
2 5.44
Benfica 5.54 0.36
Benfica 5.60 0.44 Santa Engrácia 5.46 0.56
Lumiar 5.58 0.38 Mercês 5.34 0.74
2 5.11
Alcântara 5.56 0.57 Alto do Pina 5.25 0.73
Santo
Condestável 5.48 0.43 S. J. Arroios 5.25 0.61
S. D. de Benfica 5.47 0.31 Lumiar 5.18 0.36
Alto do Pina 5.44 0.38 Santos-o-Velho 4.98 0.52
S. Jorge de
Arroios 5.44 0.56 S. D. Benfica 4.98 0.25
Santa Engrácia 5.40 0.64 Anjos 4.96 0.67
Beato 5.34 0.73 S. J. Brito 4.90 0.35
Campo Grande 5.34 0.45 Carnide 4.89 0.39
1 4.80
Carnide 5.32 0.39 Prazeres 4.88 0.60
N. S. de Fátima 5.26 0.44 Santo
Condestável 4.88 0.49
S. Maria de Belém 5.26 0.68 N. S. Fátima 4.88 0.39
Anjos 5.23 0.64 1 4.90 Penha de França 4.87 0.69 Lapa 5.07 0.39 Lapa 4.79 0.35 Santos-o-Velho 4.87 0.52 S. F. Xavier 4.77 0.41
S. João de Brito 4.85 0.29 Alvalade 4.74 0.49
S. Francisco
Xavi-er 4.77 0.47 Campo Grande 4.71 0.44
Alvalade 4.63 0.46 Alcântara 4.64 0.32
Fig. 3 – Representation of cap rate clusters for B1 properties for the parishes of Lisbon
Analysis of the parishes of Porto. Table 5 presents the average values of rental income in €/m2, standard deviations, clusters and average rental income of clusters for Porto parishes that have data available for B1 and B2 apartments. As previously mentioned, a statistically significant difference exists between the average rental incomes of B1 apartments (8.03 €/m2) and B2 housing (6.45 €/m2). It is equally important to mention that, for all parishes, the average rental income of the B1 category is greater than for the B2 category.
As shown in Table 5, the agglomeration method resulted in the formation of three clusters for B1 and B2 apartments (Fig. 5, Fig. 6, Fig. 7, Fig. 8). A clear heterogeneity exists among parishes included in each cluster, indicating that the behaviour of rental income is different for each of the analysed categories. The differences for Clusters 1, 2 and 3 – for both types of apartments – are statistically significant at a significance level of 1%.
Table 4
Regression models for B1 and B2 apartments for Lisbon parishes
Model1 (B1) sig Model2 (B2) sig
Constant 2004.577 0.000 Constant 1715.144 0.000 EvaluB1 0.349 0.000 EvaluB2 0.368 0.000 Cluster2caprateB1 -291.101 0.000 Cluster2caprateB2 -155.632 0.000 Cluster3caprateB1 -350.173 0.000 Cluster3caprateB2 -357.468 0.000 PopulationDensity -0.004 0.004 PopulationDensity -0.007 0.000 R 0.710 R 0.768 R2 0.505 R2 0.590 Durbin-Watson 0.628 Durbin-Watson 0.780 F 96.529 0.000 F 136.344 0.000
Dependent variable: Market value of the supply in €/m2 for B1 and B2
EvaluB1: is the net present value of B1 apartments for all parishes analysed EvaluB2: is the net present value of B2 apartments for all parishes analysed
Cluster2caprateB1: is the cap rate of B1 apartments that belong to cluster 2 (in relation to cluster 1) Cluster2caprateB2: is the cap rate of B2 apartments that belong to cluster 2 (in relation to cluster 1) Cluster3caprateB1: is the cap rate of B1 apartments that belong to cluster 3 (in relation to cluster 1) Cluster3caprateB2: is the cap rate of B2 apartments that belong to cluster 2 (in relation to cluster 1) Population Density: is the population density of the Lisbon parishes under analysis
Table 5
Average (€/m2) and standard deviation of rental income for Porto parishes
B1 B2
Parishes Ave-rage Devia-Stand tion Clus-ter Cluster Ave-rage Parishes Ave-rage Stand Devia-tion Clus-ter Clus-ter Ave-rage
Nevogilde 9.94 1.27 3 9.62 Foz do Douro 8.35 0.60 3 8.31
Foz do Douro 9.29 0.75 Nevogilde 8.27 0.65
Aldoar 8.76 1.35 2 8.76 Aldoar 7.32 0.43
2 7.05
Lordelo Douro 8.15 0.56
1 7.48
Massarelos 6.97 0.57
Ramalde 7.88 0.64 Lordelo do Douro 6.86 0.51
Massarelos 7.84 0.56 Cedofeita 5.77 0.54
1 5.34
Cedofeita 7.58 0.56 Ramalde 5.74 0.46
Santo Ildefonso 7.16 0.56 Paranhos 5.20 0.39
Paranhos 7.10 0.64 Bonfim 5.06 0.84
Bonfim 6.63 0.88 Santo Ildefonso 4.94 0.48
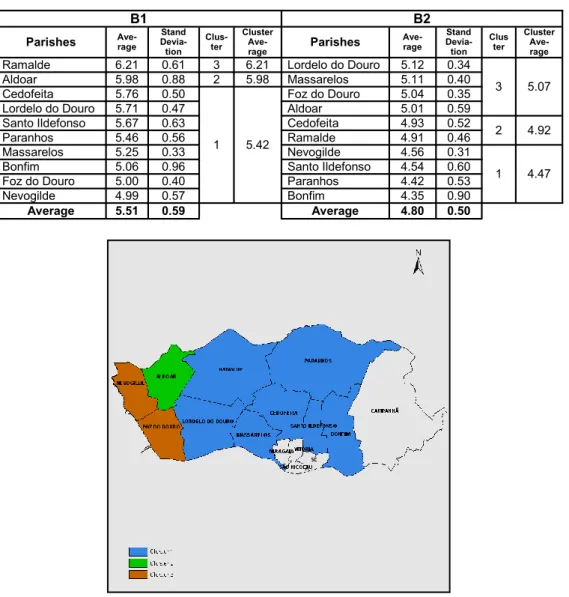
Table 6 presents the average values, standard deviations and cap rates of the clusters for Porto parishes, which resulted in three clusters for both B1 and B2 housing. As previously mentioned, the average cap rate values for B1 apartments are greater than for B2. Moreover, this is valid for all Porto parishes. The differences between the cap rate values for Clusters 1, 2 and 3 – for both types of housing – are statistically significant with a confidence level of 99%.
B1 B2
Parishes Ave-rage Devia-Stand tion Clus-ter
Cluster
Ave-rage Parishes Ave-rage
Stand
Devia-tion Cluster Cluster
Ave-rage
Ramalde 6.21 0.61 3 6.21 Lordelo do Douro 5.12 0.34
3 5.07
Aldoar 5.98 0.88 2 5.98 Massarelos 5.11 0.40
Cedofeita 5.76 0.50
1 5.42
Foz do Douro 5.04 0.35
Lordelo do Douro 5.71 0.47 Aldoar 5.01 0.59
Santo Ildefonso 5.67 0.63 Cedofeita 4.93 0.52
2 4.92
Paranhos 5.46 0.56 Ramalde 4.91 0.46
Massarelos 5.25 0.33 Nevogilde 4.56 0.31
1 4.47
Bonfim 5.06 0.96 Santo Ildefonso 4.54 0.60
Foz do Douro 5.00 0.40 Paranhos 4.42 0.53
Nevogilde 4.99 0.57 Bonfim 4.35 0.90
Average 5.51 0.59 Average 4.80 0.50
Table 6
Average (%) and standard deviation of cap rates for Porto parishes
Fig. 5 – Representation of rental income clusters for B1 properties for the
Fig. 6 – Representation of
rental income clusters for B2 properties for the
parishes of Porto
Fig. 7 – Representation of
cap rate clusters for B1 properties for the parishes of Porto
The Pearson correlation between the average values of the rental income and cap rates for Porto parishes for B1 apartments is -0.226 and for B2 housing, 0.528, which are clearly different to the values previously encountered for the Lisbon municipality. A strong association exists between the rental income and the cap rates for B2 apartments and a negative association between these values for B1 apartments.
The results for the regression concerning B1 and B2 apartments in Porto are presented in Table 7. Similar to what occurred in Lisbon, both models are robust for B1 and B2. However, the devaluation is lower for the B1 and B2 in the market in Porto than in Lisbon, which reflects the higher prices of apartments in Lisbon when compared to the prices of apartments in Porto. The model 1 for B1 housing is robust, given that the dummy variables Cluster2caprateB1 and Cluster3caprateB1 are based on Cluster 1 of B1 cap rates. In this manner, compared with Cluster 1, Cluster 2 has a devaluation of €145.928 and Cluster 3 has a devaluation of €247.105. In the model2 for B2 housing, the dummy variables Cluster2caprateB2 and Cluster3caprateB2 are based on Cluster 1 of B2 cap rates. Thus, compared with Cluster 1, Cluster 2 has a devaluation of €107.212 and Cluster 3 has a devaluation of €117.420
.
When comparing to determination coefficients for Porto and Lisbon, one can conclude that they are higher for Porto (r2=0.748, for B1; r2=0.814, for B2) than for Lisbon (r2=0.505, for B1; r2=0.590, for B2). This means that both markets are not only different but also there are unobserved variables for Lisbon that need to be accounted for in future research.
Conclusions
The results yield clear conclusions. The Lisbon and Porto housing markets are relatively volatile, and a clear difference between these markets exists not only on a spatial level but also between the studied housing categories. Moreover, the model of frictionless markets in which the investor sentiment is set aside is far from applicable in the Portuguese housing market. B1 and B2 apartments have different behaviours. While, for B2 housing, rental income and cap rates are positively correlated in Porto (0.528) and Lisbon (0.385), rental income and cap rates for B1 apartments are positively correlated in Lisbon (0.288) but negatively correlated in Porto (-0.226). The correlation for B2 apartments for Porto is clearly almost 40% larger than the correlation found for Lisbon, which indicates that the Porto’s B2 market is much more appealing to investors than the Lisbon’s B2 market is. In contrast, Porto’s B1 apartment market can be considered overvalued when compared with Lisbon’s B1 market.
Both the correlation and determination coefficients obtained from the regression models are lower for Lisbon than for Porto. Similarly, the coefficients are lower for B1 housing as compared with B2 apartments. The conclusion can be drawn that the B2 market is much more homogeneous than the B1 market both in Lisbon and Porto, clearly indicating that they are different markets in regard to both housing categories and areas.
These differences between Lisbon and Porto can be explained by two different aspects. The first is based on a geographic perspective. While Lisbon has experienced an expanding development from the core to the outer districts, underpinned by important events that brought massive investments to the city, Porto has remained relatively homogeneous, with important rehabilitation policies, with a set of complementary small cities having developed nearby, as reported by Afonso and Melão (2007). This difference in geographic expansion has implications at a social level, as B2 apartments are highly sought after by young families. Thus, the B2 category could be associated with low-risk investments, given the demand from residents who are simultaneously investors and consumers looking to invest based on the resale option and overconfidence theories (Scheinkman and Xiong 2003, Hong et al. 2006), where B2 owners
Model1 (B1) sig Model2 (B2) sig
Constant 1601.046 0.000 Constant 1061.406 0.000 EvaluB1 0.409 0.000 EvaluB2 0.607 0.000 Cluster2caprateB1 -145.928 0.000 Cluster2caprateB2 -107.212 0.000 Cluster3caprateB1 -247.105 0.000 Cluster3caprateB2 -117.420 0.000 PopulationDensity -0.078 0.006 PopulationDensity -0.044 0.000 R 0.865 R 0.902 R2 0.748 R2 0.814 Durbin-Watson 0.687 Durbin-Watson 0.740 F 114.804 0.000 F 169.538 0.000 Table 7
Regression models for B1 and B2 apartments for Porto parishes
Dependent variable: Market value of the supply in €/m2 for B1 and B2
EvaluB1: is the net present value of B1 apartments for all parishes analysed EvaluB2: is the net present value of B2 apartments for all parishes analysed
Cluster2cap rateB1: is the cap rate of B1 apartments that belong to cluster 2 (in relation to cluster 1) Cluster2cap rateB2: is the cap rate of B2 apartments that belong to cluster 2 (in relation to cluster 1) Cluster3cap rateB1: is the cap rate of B1 apartments that belong to cluster 3 (in relation to cluster 1) Cluster3cap rateB2: is the cap rate of B2 apartments that belong to cluster 2 (in relation to cluster 1) Population Density: is the population density of the Porto parishes under analysis
believe that future dividends are going to increase and potential investors are expecting the financial crisis to settle in and buy at lower prices.
However, the differences obtained for B1 apartments in Lisbon and Porto might be better explained by two other arguments. First, B1 housing is sought by a relatively diverse group that involves young or financially-constrained individuals, and Lisbon has the largest single-parent family market in Portugal (Ferreira 2010). Together with the Lisbon Expo, this might have ignited the Lisbon housing market for B1 apartments. This implies that the demand variability (i.e. both high and low quality apartments) is passed on, affecting the variability of returns (i.e. both high and low rental income), which results in a negative correlation in Porto but a positive one in Lisbon.
Another explanation for the differences between Porto and Lisbon might be the fact that Lisbon has a larger historical centre than Porto that may negatively influence the cap rates for Lisbon as the historical centre is sought for commercial purposes, associated with a low risk investment (Couto et al. 2006).
In terms of B2-type apartments, the different results between Porto and Lisbon can be further explained by the social homogeneity of Porto, which has the predominance of more advantaged socioeconomic classes, with higher concentrations of highly-qualified individuals (Afonso and Melão 2007). This is not the case in Lisbon, where the problem of old deserted housing (Vilaça and Guerra 1994) has been addressed with new housing projects and strategies (Ferreira 2010, Pereira 2013). Thus, the high rental income of B1 housing in Porto has led to low cap rates, inverting the relationship between rental income and cap rates. This study’s limitation lies in the fact that values were only obtained for four years (2006–2009) – the only ones available for this research – all referring to the post-boom years of the Portuguese housing market, a period of economic volatility in which the global financial crisis strongly impacted the Portuguese economy with negative consequences for the housing market.
In addition, only the two principal Portuguese cities were studied, Lisbon and Porto, and only two categories were studied, B1 and B2 apartments. Including B3 housing could bring added value to future studies, as B3 potential owners, being, at present, a more mature segment, may display a much more stable behaviour given that they belong to the family investment segment. In regard to future research, interesting results could be attained by analysing these housing markets further by considering property age, as this would allow researchers to examine how this variable influences the market value of properties. In addition, future studies could find it worthwhile to analyse the degree to which positive and negative externalities play important roles in the housing evaluation and the ways that these factors differ between municipalities. Moreover, researchers could get significant results from separating social-oriented housing projects from privately owned properties to examine the differences in their economic behaviour.
References
AFONSO M., MELÃO N. (2007), Para uma tipologia socio-económica da área
metropolitana do Porto: uma análise estatística multivariada, Revista de Estudos Politécnicos 5
(8), 215-242.
ALCÁZAR MOLINA M. G. (2003), Valoración Inmobiliária, Montecorvo, Madrid.
AUBYN M. S. (2007), A evolução macroeconómica portuguesa e o consumo,
BARLOWE R. (1986), Land resource economics: the economics of real estate, Prentice Hall, Englewood Cliffs, NJ.
BAUM A., MACKMIN D., NUNNINGTON N. (2011), The income approach to property
valuation, EG Books, Oxford.
BLACK A., FRASER P., HOESLI M. (2006), House prices, fundamentals and bubbles, Journal of Business Finance & Accounting 33 (9-10), 1535-1555.
BROWN G. W., CLIFF M. T. (2005), Investor sentiment and asset valuation, The Journal of Business 78 (2), 405-440.
CAMPBELL J. Y. (1987), Does Saving Anticipate Declining Labor Income? An
alternative test of the permanent income hypothesis, Econometrica 55 (6), 1249-1273.
CAMPBELL J. Y. (2006), Household finance, The Journal of Finance 61 (4), 1553-1604. CAMPBELL J. Y., SHILLER R. J. (1987), Cointegration and tests of present value
models, Journal of Political Economy 95 (5), 1062-1088.
CARRILLO P. E. (2013), To sell or not to sell: measuring the heat of the housing
market, Real Estate Economics 41 (2), 310-346.
CLAYTON J., LING D. C., NARANJO A. (2009), Commercial real estate valuation:
fundamentals versus investor sentiment, The Journal of Real Estate Finance and Economics
38 (1), 5-37.
COUTO P., MANSO A., SOEIRO A. (2006), Análise Comparativa de Valores de
Mercado de Imóveis para Habitação, LNEC, Retrieved from: http://hdl.handle.net/10216/5473.
DAS P. (2015), Revisiting the hotel capitalization rate, International Journal of Hospitality Management 46, 151-160.
DENG Y., GABRIEL S. A., NOTHAFT F. E. (2003), Duration of residence in the rental
housing market, The Journal of Real Estate Finance and Economics 26 (2), 267-285.
FERREIRA M. J. (2010), O papel das dinâmicas e estratégias residenciais no
desenvolvimento territorial da área metropolitana de Lisboa, Revista Portuguesa de Estudos
Regionais 24, 88-106.
FONSECA M. L., MALHEIROS J., ESTEVES A., CALDEIRA M. J. (2002), Immigrants in
Lisbon: routes of integration, Estudos para o Planeamento Regional e Urbano 56, Centro de
Estudos Geográficos, University of Lisbon.
FRENCH N. (2004), The valuation of specialised property. A review of valuation
methods, Journal of Property Investment & Finance 22 (6), 533-541.
FROLAND C. (1987), What determines cap rates on real state? Journal of Portfolio Management 13 (4), 77-82.
FU Y., NG L. K. (2001), Market efficiency and return statistics: evidence from real estate
and stock markets using a present-value approach, Real Estate Economics 29 (2), 227-250.
GALLIN J. (2006), The long-run relationship between house prices and income:
evidence from local housing markets, Real Estate Economics 34 (3), 417-438.
GAT D. (1994), Risk and return in residential spatial markets: an empiric and theoretic
model, The Journal of Real Estate Finance and Economics 9 (1), 51-67.
GATO M. A. (2013), Dinâmicas Populacionais e Habitacionais na Área Metropolitana do
Porto, DINÂMIA’CET, Retrieved from: http://dinamiacet.iscte-iul.pt.
GELTNER D. M., MILLER N. G., CLAYTON J., EICHHOLTZ P. (2007), Commercial
Real Estate Analysis and Investments, South-Western Publishing, New York.
GHYSELS E., PLAZZI A., VALKANOV R. (2007), Valuation in the US commercial real
estate, European Financial Management 13 (3), 472-497.
GORDON M. J., SHAPIRO E. (1956), Capital equipment analysis: the required rate of
profit, Management Science 3 (1), 102-110.
GRENADIER S. R. (2005), An Equilibrium Analysis of Real Estate Leases, The Journal of Business 78 (4), 1173-1214.
GRIMES A., AITKEN A. (2010), Housing Supply, Land Costs and Price Adjustment, Real Estate Economics 38 (2), 325-353.
HAYUNGA D. K., LUNG P. P. (2011), Explaining asset mispricing using the resale
HENDERSHOTT P. (1998), Equilibrium models in real estate research: a survey, Journal of Real Estate Literature 6 (1), 13-25.
HONG H., SCHEINKMAN J., XIONG W. (2006), Asset float and speculative bubbles, The Journal of Finance 61 (3), 1073-1117.
HUNGRIA-GARCIA R., LIND H., KALSSON B. (2004), Property Yields as Tools for
Valuation and Analysis, Building & Real Estate Economics, Retrieved from: www.kth.se.
INE (2015), Estatisticas Demográficas 2014, Lisbon.
JUD G. D., WINKLER D. T. (1995), The capitalization rate of commercial properties and
market returns, The Journal of Real Estate Research 10 (5), 509-518.
KWONG S. K. S., LEUNG C. K. Y. (2000), Price volatility of commercial and residential
property, The Journal of Real Estate Finance and Economics 20 (1), 25-36.
LAAKSO S. (1992), Public transport investment and residential property values in
Helsinki, Scandinavian Housing and Planning Research 9 (4), 217-229.
LAIA A. N. (2007), Avaliação de imóveis pelo método da cap rate ou yield, Revista Confidencial Imobiliário April, 29-30.
LING D., ARCHER W. (2006), Real Estate Principles: A Value Approach, McGraw-Hill/ Irwin, New York.
LOURENÇO R. F, RODRIGUES P. M. M. (2014), The dynamics and contrast of house
prices in Portugal and Spain, Banco de Portugal Economic Bulletin December, 39-52.
MADEIRA C. A. C. L. (2009), A Reabilitação habitacional em Portugal: avaliação dos
programas RECRIA, REHABITA, RECRIPH e SOLARH, unpublished master dissertation,
Technical University of Lisbon, Retrieved from: www.repository.utl.pt.
MARKOWITZ H. (1952), Portfolio selection, The Journal of Finance 7 (1), 77-91. MARÔCO J. (2007), Análise Estatística com Utilização do SPSS, Sílabo, Lisbon. MEESE R., WALLACE N. (1993), Testing the present value relation for housing prices:
should I leave my house in San Francisco? Journal of Urban Economics 35 (3), 245-266.
MEIJERS E., HOLLANDER K. HOOGERBRUGGE M. (2012), Case study on
polycentric metropolitan areas in Porto, European Metropolitan Network Institute, Retrieved
from: www.emi-network.eu.
MESQUITA R. (2014), Portugal o novo “paraíso fiscal” para os estrangeiros – regime
fiscal dos residentes não habituais e os golden visas, Unpublished master dissertation,
Universidade Católica Portuguesa, Retrieved from: http://repositorio.ucp.pt/
handle/10400.14/16607.
MOREIRA A. C., TAVARES F., PEREIRA E. (2014), Valoración inmobiliaria. Aplicación
del método de rentas en los municipios portugueses, Revista Galega de Economía 23 (1),
187-202.
MOSSIN J. (1966), Equilibrium in a capital asset market, Econometrica 34 (4), 768-783. NEBREDA P. G., PADURA J. T., SÁNCHEZ E. V. (2006), La Valoración Inmobiliaria.
Teoría y Práctica, La Ley, Madrid.
OSLAND L., THORSEN I., GITLESEN J. P. (2007), Housing price gradients in a region
with one dominating center, Journal of Real Estate Research 29 (3), 321-346.
PAGOURTZI E., ASSIMAKOPOULOS V., HATZICHRISTOS T., FRENCH N. (2003),
Real estate appraisal: a review of valuation methods, Journal of Property Investment & Finance
21 (4), 383-401.
PENG L. (2016), The risk and return of commercial real estate: a property level
analysis, Real Estate Economics 44 (3), 555-583.
PEREIRA A. P. F. (2013), O Parque das Nações em Lisboa: Uma Montra da Metrópole
à Beira-Tejo, Unpublished Doctoral Thesis, New University of Lisbon, Retrieved from: https://
run.unl.pt/handle/10362/9761.
PINHO A. C. D. C. (2009), Conceitos e Políticas Europeias de Reabilitação Urbana -
Análise da experiência portuguesa dos Gabinetes Técnicos Locais, unpublished master
dissertation, Technical University of Lisbon, Retrieved from: http://www.repository.utl.pt. PLAZZI A., TOROUS W., VALKANOV R. (2010), Expected returns and expected growth