Dynamic Proteomic Characteristics and
Network Integration Revealing Key Proteins
for Two Kernel Tissue Developments in
Popcorn
Yongbin Dong1☯, Qilei Wang1☯, Long Zhang1☯, Chunguang Du2, Wenwei Xiong2,
Xinjian Chen3, Fei Deng1, Zhiyan Ma1, Dahe Qiao1, Chunhui Hu1, Yangliu Ren1, Yuling Li1*
1College of Agronomy, Henan Agricultural University, Collaborative Innovation Center of Henan Grain Crops, National Key Laboratory of Wheat and Maize Crop Science, 63 Nongye Rd, Zhengzhou, China,
2Deptment of Biology and Molecular Biology, Montclair State University, Montclair, NJ 07043, United States of America,3College of Life Sciences, Henan Agricultural University, 63 Nongye Rd, Zhengzhou, China
☯These authors contributed equally to this work. *[email protected]
Abstract
The formation and development of maize kernel is a complex dynamic physiological and biochemical process that involves the temporal and spatial expression of many proteins and the regulation of metabolic pathways. In this study, the protein profiles of the endo-sperm and pericarp at three important developmental stages were analyzed by isobaric tags for relative and absolute quantification (iTRAQ) labeling coupled with LC-MS/MS in popcorn inbred N04. Comparative quantitative proteomic analyses among developmental stages and between tissues were performed, and the protein networks were integrated. A total of 6,876 proteins were identified, of which 1,396 were nonredundant. Specific proteins and different expression patterns were observed across developmental stages and tissues. The functional annotation of the identified proteins revealed the importance of metabolic and cellular processes, and binding and catalytic activities for the development of the tis-sues. The whole, endosperm-specific and pericarp-specific protein networks integrated 125, 9 and 77 proteins, respectively, which were involved in 54 KEGG pathways and reflected their complex metabolic interactions. Confirmation for the iTRAQ endosperm pro-teins by two-dimensional gel electrophoresis showed that 44.44% propro-teins were commonly found. However, the concordance between mRNA level and the protein abundance varied across different proteins, stages, tissues and inbred lines, according to the gene cloning and expression analyses of four relevant proteins with important functions and different expression levels. But the result by western blot showed their same expression tendency for the four proteins as by iTRAQ. These results could provide new insights into the develop-mental mechanisms of endosperm and pericarp, and grain formation in maize.
OPEN ACCESS
Citation:Dong Y, Wang Q, Zhang L, Du C, Xiong W, Chen X, et al. (2015) Dynamic Proteomic Characteristics and Network Integration Revealing Key Proteins for Two Kernel Tissue Developments in Popcorn. PLoS ONE 10(11): e0143181. doi:10.1371/ journal.pone.0143181
Editor:Tai Wang, Institute of Botany, Chinese Academy of Sciences, CHINA
Received:January 21, 2015
Accepted:November 2, 2015
Published:November 20, 2015
Copyright:© 2015 Dong et al. This is an open access article distributed under the terms of the
Creative Commons Attribution License, which permits unrestricted use, distribution, and reproduction in any medium, provided the original author and source are credited.
Data Availability Statement:All relevant data are within the paper and its Supporting Information files.
Introduction
Maize (Zea maysL.), an important cereal grass, is widely grown as food, livestock fodder, and raw material for energy and other industrial uses in worldwide. Therefore, the characteristics of grain development have been widely studied to improve yield and nutritional quality [1–8]. Maize grain consists of the triploid endosperm, diploid embryo and maternal pericarp [9]. These three tissues develop coordinately and make up 70–90%, 10–12% and 5–6% of the grain dry weight, respectively [10–12].
The whole endosperm development in maize can be divided into five stages, the coenocytic phase, cellularization, differentiation, reserve synthesis and maturation [4,13]. The first stage begins immediately after pollination, during which the triploid endosperm nucleus undergoes synchronous division in the absence of cell division. The cellularization around the nuclei begins to form a cell wall until about 3–6 days after pollination (DAP). Next, cell division and endoreduplication in the endosperm occur within 10–15 DAP. The cells differentiate into dis-tinct tissue types, including transfer cells, aleurone, the embryo-surrounding region and star-chy endosperm [14]. After about 12 DAP, starch and storage proteins begin to accumulate, which involve several metabolic processes [4,5,13,15–17]. The quantity of dry-matter in the endosperm tissue is mainly synthesized at about 12–35 DAP [4,15]. At about 16 DAP, the star-chy endosperm cells begin to undergo programmed cell death (PCD) [14]. Cell division and grain filling are the important biological processes in grain development, which determine the dry matter content of mature grains and provide rich nutrients for the developing seed and ger-minating embryo [14,18–20]. After about 35 DAP, the dry-matter accumulation decrease in the endosperm, and the kernel start to dehydrate quickly [4,5].
The maternal pericarp tissue develops from the ovary wall in maize, which is mainly com-posed of carbohydrates, particularly corn fiber or cellulose. At about 10 DAP, the central cells in the pericarp start collapsing gradually from the crown, spreading down the sides of the ker-nel. The cells of inner pericarp collapse to accommodate the expanding endosperm at about 20 DAP. However, outer cells elongate with significant thickening cell walls to form a protective coat on the mature kernel [21]. In addition to being protection for the embryo and endosperm, pericarp thickness plays important roles in determining grain quality, especially for popcorn and sweet corn varieties. In fact, pericarp thickness and extensibility could restrict grain vol-ume development during grain filling, which finally affects the weight of mature grains [22–
23]. The differences in pericarp overall thickness were due to the width of individual pericarp cell walls and the number of pericarp cell layers [24]. During the grain maturity stage, the dry-ing rates were associated with pericarp thickness and permeability, not to metabolic processes within the mature grain [25–27].
Grain formation and development is a complicated physiological and biochemical process, which involves the temporal and spatial expression of many genes and the regulation of meta-bolic pathways [28]. Several complex and inter-related metameta-bolic processes are involved in maintaining normal metabolism during maize grain development [3,13,15–17,29]. With the development of biological technologies, gene and protein expression profiles can be identified [30–31]. Accordingly, a metabolic network reconstruction could uncover the molecular mech-anisms of a particular organism, which would help unravel the systemic biology of the meta-bolic pathways [32–33]. This could also contribute to the identification of genes or proteins that play important roles in the biological and chemical processes involved in the developmen-tal process [19]. By constructing and analyzing cDNA libraries, endosperm development was thoroughly characterized and some tissue-specific genes were obtained [1,2,5,7,8,30]. At least 5,000 different genes could be expressed during endosperm development. Moreover, the Competing Interests:The authors have declared
expression patterns of many imprinted genes, which were recognized by the deep sequencing of mRNAs from maize endosperm, were revealed [34–35].
However, a direct relationship between mRNA levels and protein abundance is difficult to be assessed [31,36]. From mRNA to protein, some factors influence the coordination between mRNA levels and protein abundance, such as posttranscriptional regulation and posttransla-tional modification, as well as differential protein and mRNA degradation rates [37–39]. The protein level might reflect the real function of genes in certain tissues or times, which would help uncover their functions. In recent years, some research techniques for comprehensive proteomic analyses have been improved greatly. Although two-dimensional gel electrophoresis (2DE) is an established technique for protein analysis, it has several disadvantages, including being less efficient in identifying low-abundant, extreme isoelectric and hydrophobic proteins, and poor reproducibility, which limits its extensive application [40–42]. The combination of high performance liquid chromatography (HPLC) and mass spectrometry (MS), and liquid chromatography coupled with tandem mass spectrometry (LC-MS/MS), can greatly improve the sensitivity and specificity of protein identification. Some quantitative proteomics tech-niques, such as isobaric tags for relative and absolute quantification (iTRAQ) labeling [43], two-dimensional difference gel electrophoresis (2D-DIGE) [44], isotope-coded affinity tags (ICATs) [28] and label-free techniques [45], have been widely applied in plants.
The major advantages of iTRAQ are its high sensitivity and accuracy in protein identifica-tion, and the simultaneous quantification [46]. Therefore, this technique has been used to obtain quantitative proteomic data for different organs and tissues in several plants. The pro-tein profile ofArabidopsisroots under conditions of Fe deficiency and excess Zinc were com-prehensively analyzed using iTRAQ [47–48]. Owiti et al. [49] analyzed the expression profiles of soluble and non-soluble cassava root proteins during a 96-h post-harvest time course, from which a comprehensive proteome map of the cassava root was established and the regulated proteins were identified. In maize, Silva-Sanchez et al. [50] performed a quantitative proteo-mics analysis of the maizeminiature1(mn1) mutant and its wild-typeMn1. Roy et al. [51] identified 64 differentially expressed protein spots and 140 proteins from the differential prote-ome of wild-type and mutant pericarps (unstable factor for orange1-1,Ufo1) using 2D-DIGE and iTRAQ, respectively. Until now, limited researches have been reported on the proteomic comparison between different kernel tissues in maize. The special protein network integration has not been reported yet [38].
Materials and Methods
Plant materials and sample collection
A popcorn inbred line N04 with a small-sized grain were planted at the Scientific Research and Education Center of Henan Agricultural University in Zhengzhou, Henan, China, in 2011. 30 rows of 4 m were planted with 0.67 m spacing between rows. Standard cultivation management practices were performed. All plants were self- or sib-pollinated when more than 80% of silks appeared.
Ears were harvested once every 2 DAP or 3 DAP. To increase the uniformity of the isolated grains, the upper half and about one-sixth from the bottom of the ears were cut and discarded. Grains were isolated from the remaining parts of the ears. Samples were collected from at least six ears and pooled at each time point for three biological replications. The two grain compo-nent parts, endosperm and pericarp, were manually separated after 10 DAP. Some of the col-lected samples were frozen in liquid nitrogen immediately and stored at–80°C, while others were used to measure fresh and dry weight.
Light microscopy and scanning electron microscopy
For light microscopy analysis, the kernels were prepared and observed as described by Takacs et al. [53], with some modifications. Briefly, kernels were fixed in formaldehyde-acetic acid solution that contained 10% formalin, 5% acetic acid and 50% ethanol. The fixed kernels were dehydrated in a graded ethanol series (50, 70, 85, 95 and 100% ethanol, each for 30 min), then cleared with xylene and paraffin wax infiltration. After clearing, the samples were embedded and sectioned at 8–10μm thickness under a Leica RM2235 Biocut. The sections were stained
with Safranin O and Fast Green, and photographed with a Leica DM4000B microscope. Cell counts were measured by ImageJ analysis software [54–55].
For the scanning electron microscopy (SEM) analysis, the kernels were prepared and observed as described by Lending and Larkins [56]. Dry mature kernels were rifted with a blade along the longitudinal axis and spray coated with gold in an E-100 ion sputter. Gold-coated samples were then examined using a S3400N microscope at 5 kV.
Protein isolation and digestion
For each sample, both endosperm and pericarp tissues (~0.5 g) were weighed and 10% polyvi-nyl polypyrrolidone was added. They were then separately ground in liquid nitrogen. The supernatants were transferred to other tubes, and five-fold 10% chilled tricarboxylic acid (TCA) acetone was added and kept at−20°C for 2 h. The precipitate was washed with chilled acetone for 30 min, and the supernatants were discarded after a 20,000 ×g centrifugation at 4°C for 20 min. This step was repeated three times. The pellets were air dried, and then dissolved in 500μl 0.5 M triethylammonium bicarbonate (TEAB) buffer and sonicated at 200 Watts for 15
min. The samples were centrifuged at 30,000 ×g at 4°C for 20 min, and the supernatants were obtained. The disulfide bonds were reduced using 10 mM DTT at 56°C for 1 h. The cysteine was blocked with 55 mM iodoacetamide in a dark room for 45 min, then 5× chilled acetone was added and the samples were kept at−20°C overnight. The pellets were air dried, dissolved in 400μl 0.5M TEAB and sonicated at 200 Watts for 15 min. The samples were centrifuged at
30,000 ×g at 4°C for 15 min. The supernatants were then collected. The protein concentration for each sample was measured using the 2-D Quant Kit according to the manufacturer’s proto-col (GE Healthcare, Little Chalfont, UK) and detected by SDS-PAGE.
reduce cysteine disulphide bonds. Then, 50 mM iodoacetamide was added and incubated for 1 h at room temperature in the dark. Subsequently, the samples were diluted by TEAB to reduce the urea concentration to ~1 M and 40μg of trypsin was added to the samples. Then, the
sam-ples were incubated at 37°C overnight. After digestion, the samsam-ples were stored at−20°C or immediately labeled for iTRAQ.
iTRAQ labeling
In total, 6 samples were included based on the characteristics of grain development for inbred N04. N1, N2 and N3 were from the pericarp and N4, N5 and N6 were from the endosperm at 10 DAP, 20 DAP and 33 DAP, respectively. The samples were divided into two groups based on the tissue. The pericarp group (Group 1) included N1–3 and the endosperm group (Group 2) included N4–6. For comparisons, N1 was also included in Group 2 and used as the control with reagent 113.
Proteins were labeled with the 8-plex iTRAQ reagents (Applied Biosystems) according to the manufacturer’s recommendations. The samples at 10 DAP, 20 DAP and 33 DAP were labeled with reagents 114, 115 and 116, respectively. The reactions were performed at room temperature for 1 h. All samples with equal fractions were collected and lyophilized using a SpeedVac, and then stored at−80°C.
Two-dimensional Gel Electrophoresis
The isoelectric focusing (IEF) of the proteins from N04 endosperm at the three developmental stages was analyzed with three technical replicates. For each sample, equal amounts of total protein extract (1 mg) were assayed using 24 cm immobilized pH gradient (IPG) dry strips (Immobiline Dry-Strips, Bio-Rad, Hercules, CA, USA) with a linear pH gradient from 3 to 10. An active rehydration was performed overnight at 50 V. IEF was performed with an Ettan III system (GE Healthcare, USA) by increasing step by step from 50 to 10,000 V. Equilibration of the strips was performed immediately for 15 min with a buffer containing 0.375 M Tris-HCl (pH 8.8), 6 M urea, 20% glycerol, 4% SDS and 2% DTT, and followed for 15 min with a buffer containing 0.375 M Tris-HCl (pH 8.8), 6 M urea, 20% glycerol, 4% SDS and 2.5% iodoaceta-mide. Proteins from the IPG gel strips were separated using 12.5% SDS-PAGE gels. The gels were silver stained and scanned using a laser scanner (AlphaImager HP, Alpha Innotech, Santa Clara, CA, USA). Digital images of the gels were compared using Quantity One or PDQUEST software (Bio-Rad). The differentially expressed proteins (over two fold quantitative variations) were selected for further analyses. Differential spots in stained 2-dimensional gels were manu-ally excised for protein digestion and LC-MS/MS analysis.
LC-MS/MS analysis
The labeled samples were dissolved in 100μl of strong cation exchange (SCX) chromatography
buffer A, which contained 10 mmol/L KH2PO4and 25% acetonitrile, pH 2.6. Each sample was
separated into 20 gradients by the SCX column according to the spike and time, and separated using a reversed-phase column. The LC-MS/MS analysis was performed on a LTQ-Orbitrap-Velos system after desalinization. The MS spectra were received.
Database search and protein identification
http://www.matrixscience.com) was used to identify and quantify proteins. Searches were per-formed against the maize protein database released in January 2012 (http://www.plantgdb.org/ ZmGDB/). The following search parameters were used: peptide mass tolerance ± 10 ppm, frag-ment mass tolerance ± 0.05 Da and maximum missed cleavages = 1. Trypsin was used as the enzyme with two missed cleavages. Fixed modifications were carbamidomethyl (C), iTRAQ8-plex (N-term) and iTRAQ8iTRAQ8-plex (K). Variable modifications were Gln->pyro-Glu (N-term
Q), oxidation (M) and iTRAQ8plex (Y). Mass values were set as monoisotopic, instrument type as default and protein mass as unrestricted. The filter parameters for proteins were set as false discovery rate (FDR)0.05, and for peptides, FDR0.05. For relative protein quantita-tive analyses, the mass-to-charge ratio (m/z) 113 was performed as the control sample accord-ing to the peak area integral of mass-to-charge ratio (m/z) 113, 114, 115, and 116 reporter ions. The significant threshold values of1.5 or0.67 were regarded as differential protein expression.
Function annotation and hierarchical cluster analysis of identified
proteins
The functions of identified proteins were analyzed by matching to NCBInr (http://www.ncbi. nlm.nih.gov/) and/or Swiss-Prot/UniProt (http://www.uniprot.org/) databases, and further analyzed using the Gene Ontology (GO,http://www.geneontology.org) and the Cluster of Orthologous Groups (COGs,http://www.ncbi.nlm.nih.gov/COG/) of proteins databases. The metabolic pathways and signal transduction pathways of the identified proteins were analyzed according to the KEGG public database [57]. Hierarchical clusters of protein expression between the samples were performed by Cluster 3.0 software (http://bonsai.hgc.jp/~mdehoon/ software/cluster/). The clustering results were viewed by TreeView software (http://bonsai.hgc. jp/~mdehoon/software/cluster/).
Integrated network analysis on proteome data from both tissues of
inbred N04
Because the expression intensities of proteins varied over time, protein candidates were filtered using expression intensity with the criterion of a fold change (absolute value) of no less than 5. Each protein was assigned a gene model from the MaizeGDB website. To annotate these pro-teins, a BLAST analysis was performed using the gene model sequences as query against the well-annotated maize orthology data of the KEGG database. Based on KEGG orthology, we linked the proteome data to KEGG pathways describing molecular interactions and reaction networks. Given a group of KEGG orthology entries, we used KEGG API (http://www.kegg.jp/ kegg/rest/keggapi.html) to retrieve their related pathways with a URL format ofhttp://rest. kegg.jp/link/pathway/K01778 +K02725.
Isolation of total RNA and mRNA
The samples were ground into powder and total RNA was isolated from the frozen samples using the hot phenol extraction method [58]. Reverse transcription was accomplished using the PrimeScript TM RT reagent Kit (Takara) to turn RNA to its complementary DNA (cDNA).
Gene cloning and quantitative RT-PCR analysis
(Actin-depolymerizing factor, 3.6 for ratio N2/N3), GRMZM2G147687 (Exoglucanase1 precursor, 3.0 for ratio N3/N2 and 2.6 for ratio N3/N6), GRMZM2G111143 (Glucan endo-1,3-beta-glucosi-dase precursor, 3.1 for ratio N3/N2) and GRMZM2G102499 (General regulatory factor, 3.2 for ratio N6/N5). Each protein was used as a query against the National Center for Biotechnology Information (NCBI) EST database in a BLAST search. By assembling the overlapping ESTs into contigs, the complete open reading frame (ORF) was obtained. The assembled result was confirmed using the online tool Softberry to acquire annotations for the whole genome. Spe-cific primers were designed using Primer 5.0 software to amplify the complete ORF. PCR was carried out using 1μl of the obtained cDNA, 2.5μl PCR buffer, 2.5μl dNTPs mixture (2.5 mM
each), 1μl of each primer (10μM), 0.125μl Takara La Taq, and sterilized double-steamed
water was added to a final volume of 25μl. The PCR conditions were 1 min at 94°C then 30
cycles of 40 s at 94°C, 40 s at 56°C and 2 min at 72°C, and a final extension of 7 min at 72°C. PCR products were separated on 1% agarose gels and the single specific PCR product band was cloned into the pGEM-T easy vector (Promega) for sequencing.
Real-time PCR (RT-PCR) was performed using a Bio-Rad real-time detection system. The reaction liquid consisted of 12.5μl 2× SYBR Premix Ex Taq II, 1μl PCR forward primer
(10μM), 1μl PCR reverse primer (10μM), 2μl of a 1/5 dilution of the cDNA as the template,
and 8.5μl sterilized distilled water. The total volume was 25μl. The amplification procedure
was as follows: 95°C for 3 min, then 40 cycles each of denaturation at 95°C for 10 s, annealing at 58°C for 20 s, and extension at 72°C for 30 s. Theβ-actin gene was used as the control, and each sample was repeated three times. Template cDNAs were obtained from the reverse tran-scription of the RNA extracted from collected samples. The area under the curve for the PCR product of each nucleotide was compared to that of its respective internal standard (Ct) to determine gene expression values [58]. The Ct values were the means of the three repeats. If the differences among them exceed 0.5 Ct, then they were discarded [59]. Relative expression volume (REV) was computed as 2(−ΔΔCt)according to the method by Ganeshan et al. [60], in whichΔΔCt =ΔCt–ΔCt (calibrator),ΔCt = Ct (sample)−Ct (reference gene).
Primers used for RT-PCR analysis included as follows:
GRMZM2G060702, 5'-CCCCGAGAATGACTGCCGATAC-3' and 5'-TTCACCTTGGCGGAGGATGG-3'; GRMZM2G147687, 5'- GCCGGCCGTCGACACATGTT-3' and
5'- TGGGCTCCGGTAGTGTCGCCT-3'; GRMZM2G111143, 5'-AGCGGAACTTCGGCATCTT-3' and
5'-CACGCACCACTTGCCTCC-3';
GRMZM2G102499, 5'-TGCTGTCTTGATTTCGGGTCG-3' and 5'-AGCGTCGCACCCAAGAAAC-3'.
Western blot analysis
The same four proteins analyzed by RT-PCR were chosen for Western blot analysis. Total pro-teins for all samples as in iTRAQ were extracted by a method combining the usage of Borax/ PVPP/Phe (BPP) as described by Wang et al. [61]. 5μg of the actin and the total sample
IgG-HRP, Abmart) at 1:5,000 dilution for 1.5 h at room temperature away from light. After three washings with TBST, signals were detected using an ECL Western Blotting Kit (Amer-sham) following the manufacturer’s instructions. The ratio of the validation proteins were compared to actin (#M20009, Abmart) and were densitometric measured by Image J software (NIH, Bethsda, MD).
Results
The dynamic developmental process of grain and its two components
After pollination, the weights for the whole grain from 3 to 43 DAP, and for the two compo-nent parts (endosperm and pericarp) from 10 to 43 DAP for inbred N04, were quantified respectively. The whole grain weight increased slowly before 10 DAP, followed a rapid increase during 10–26 DAP, and then increased slowly again (Fig 1A and 1B). The same pattern was observed for the two components. At 33 DAP, both the whole grain and endosperm weights reached the highest point, which were 8.36 g/100 grains and 7.29 g/100 grains, respectively.
Microstructures of the endosperm and pericarp at 10, 20 and 33 DAP showed that the cell sizes of the endosperm and pericarp changed in a similar manner at all comparable develop-mental stages (Fig 1C). Endosperms at 10 DAP were in the cell division stage, and then, the endosperm cells accumulated substances rapidly. At 20 DAP, endosperm cells were filled with starch grains.
Using light microscopy and SEM highly different characteristics were observed for starch granules in endosperm and pericarp at maturity (Fig 1C and 1D). The pericarp texture was rough. The starch granules in the endosperm were small polygonal, densely packed and filled with protein bodies. Simultaneously considering the development patterns and the structures of the whole grain, the endosperm and pericarp at 10, 20 and 33 DAP were chosen for further analyzing the differentially expressed proteins during grain development.
Quantitative protein identification of endosperm and pericarp using
iTRAQ
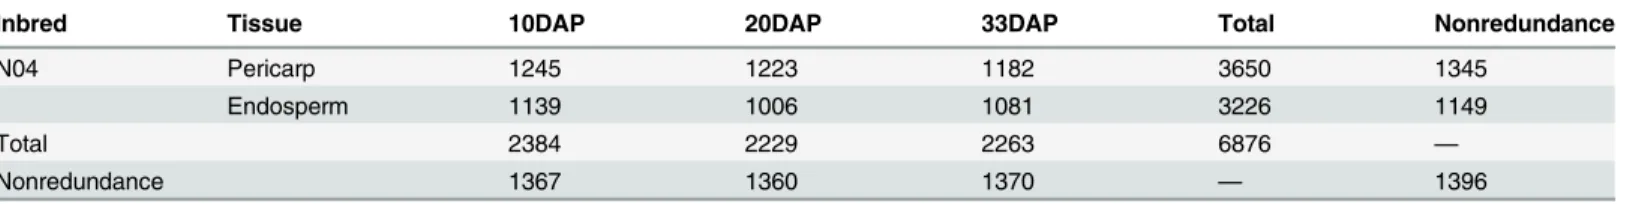
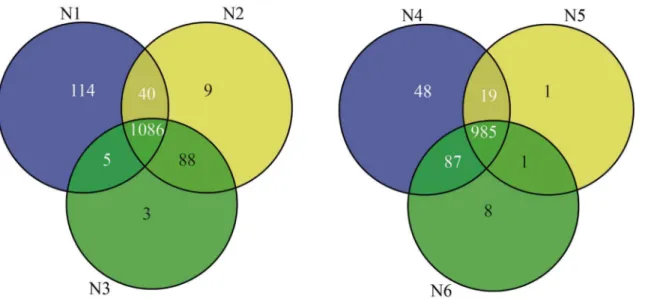
A total of 6,876 proteins were identified in all samples, 1,345 from pericarp and 1,149 from endosperm, among which 1,396 were nonredundant proteins (Table 1,Fig 2). The peptides and the quantitation information of identified proteins were listed inS1 File. There were 227 uniquely identified proteins from pericarp and 46 from endosperm (Table A inS2 File). For the pericarp, a total of 3,650 proteins were obtained, 1,245, 1,223, and 1,182 proteins were rec-ognized at the three stages, 10 DAP, 20 DAP and 33 DAP, respectively, of which 1,086 proteins were commonly found at all developmental stages, and 114, 9 and 3 proteins were stage spe-cific, respectively. For the endosperm, a total of 3,226 proteins were obtained, 1,139, 1,006 and 1,081 proteins were recognized at 10 DAP, 20 DAP and 33 DAP, respectively, of which 985 proteins were commonly found at all developmental stages, and 48, 1 and 8 proteins were stage specific, respectively.
Functional annotation of identified proteins using iTRAQ
Fig 1. The developmental pattern and the morphological and cytological characteristics of kernels from maize inbred line N04.A. The
developmental patterns of grain and its two component parts, the endosperm and pericarp. B. The exact appearance for complete kernel (Ke), endosperm (En), and pericarp (Pe) at 10, 20 and 33 DAP for N04. C. Microscopic section of pericarp (right) and endosperm (left) during kernel development. D. The characteristics of pericarp (the right) and starch granules in the endosperm (the left) for N04 middle maturity kernels by scanning electron microscopy. (B) bar = 8 cm, (C, D) for endosperm, bar = 50μm and for pericarp, bar = 100μm, respectively.
doi:10.1371/journal.pone.0143181.g001
Table 1. The information of proteins identified using iTRAQ.
Inbred Tissue 10DAP 20DAP 33DAP Total Nonredundance
N04 Pericarp 1245 1223 1182 3650 1345
Endosperm 1139 1006 1081 3226 1149
Total 2384 2229 2263 6876 —
Nonredundance 1367 1360 1370 — 1396
organismal process (3.05%). For the molecular function annotation, eight GO terms were enriched, mostly including binding (47.15%) and catalytic activity (41.46%). For the cellular component annotation, seven GO terms were enriched, which mostly included cell (28.23%), cell part (28.23%) and organelle (23.06%).
For pericarp proteins, 23 GO terms were enriched for biological processes. The largest seven functional categories were also associated with metabolic process (27.42%), cellar process (23.18%), stimulus response (14.25%), localization (4.59%), developmental process (4.48%), cellular component organization or biogenesis (4.35%) and establishment of localization (4.42%), as was seen for the endosperm. For molecular function, binding (45.87%) and catalytic actively (43.33%) were the most abundant. For cellular component, cell (28.56%), cell part (28.56%) and organelle (23.48%) made up the majority.
To more accurately annotate the functions of proteins in the pericarp and endosperm, all proteins were further aligned to the COG database for functional prediction and classification. For the endosperm proteins, 983 proteins were successfully functionally annotated, and they were involved in 22 metabolic processes (Fig A inS2 File). The majority of the abundant pro-teins for endosperm development were related to posttranslational modification, protein turn-over or chaperones (17.60%), translation, general function prediction only (14.04%), ribosomal structure and biogenesis (12.21%), followed by energy production and conversion (11.19%), carbohydrate transport and metabolism (10.48%), amino acid transport and metabolism (9.46%), and lipid transport and metabolism (3.46%). All key enzymes involved in the TCA cycle and glycolysis were identified, which played important roles in kernel development in plant.
In total, 1107 pericarp proteins were successfully functionally annotated and were involved in 22 metabolic processes. The majority of the abundant proteins for pericarp development were related to posttranslational modifications, protein turnover or chaperones (15.72%), gen-eral function prediction only (14.00%), energy production and conversion (11.74%), transla-tion, ribosomal structure and biogenesis (10.84%), carbohydrate transport and metabolism (10.57%), amino acid transport and metabolism (9.76%), followed by lipid transport and metabolism (4.52%), and cell wall/membrane/envelope biogenesis (2.98%). Cell cycle control, Fig 2. Quantities of differentially expressed proteins according to the developmental stages of the two tissues for the maize inbred line N04.Venn diagrams were used to identify proteins in the pericarp(left) and endosperm(right), respectively.
cell division and chromosome partitioning (0.63%), RNA processing and modification (0.18%) and nuclear structure (0.09%) were the smallest groups in pericarp and endosperm.
The differentially expressed proteins across different developmental
stages and tissues
Distinct differences in protein expression profiles were observed across different developmen-tal stages and tissues, especially between the two tissues (Fig 3, Table C inS2 File). For the dif-ferentially expressed proteins among developmental stages, the number of pericarp proteins with the ratios of increased/decreased expression levels were 168/226 and 352/378 for N2/N1 and N3/N2, respectively. For endosperm proteins, those ratios were 285/243 and 251/456 for N5/N4 and N6/N5, respectively. Over 300 proteins showed different expression levels between the two tissues at each developmental stage. The number of differentially expressed proteins between the two tissues having the ratios of increased/decreased expression levels were 442/ 486, 426/364 and 371/377 for N4/N1, N5/N2 and N6/N3, respectively.
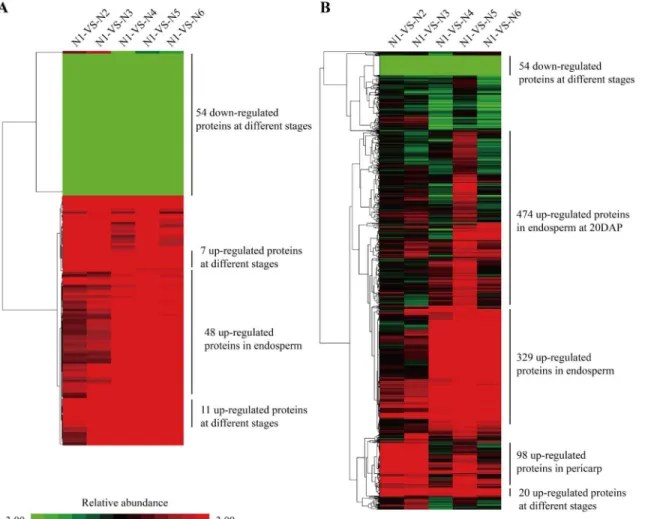
The main functions of the differentially expressed proteins were almost the same across all comparisons, relating to posttranslational modification, protein turnover and chaperones, gen-eral prediction function, carbohydrate transport and metabolism, amino acid transport and metabolism, energy production and conversion, and translation, and ribosomal structure and biogenesis. The differentially expressed proteins among different developmental stages showed that the proteins were mainly divided into two types, endosperm and pericarp, by intersection analysis (Fig 4A). For the two tissues, their protein expression profiles were obviously different. Most of the proteins were up-regulated at 10 DAP in pericarp, otherwise, a majority of proteins were up-regulated at 20 DAP in endosperm. Totally, 54 proteins with down-regulation and 18 proteins with up-regulation in both tissues at three developmental stages were observed. The functions for the 54 proteins with down-regulation were mainly involved in carbohydrate transport and metabolism, energy production and conversion and posttranslational modifica-tion, protein turnover, chaperones pathways, and the functions for the 11 proteins with up-reg-ulation were posttranslational modification, protein turnover, chaperones, translation,
ribosomal structure and biogenesis, and general function prediction only, and the functions for the seven proteins with up-regulation were cell wall/membrane/envelope biogenesis and mino acid transport and metabolism. In addition, 48 proteins were up-regulated only in endosperm, which were involved in cell wall/membrane/envelope biogenesis, amino acid transport and metabolism, translation, ribosomal structure, biogenesis and general function prediction.
Furthermore, similar result was obtained using a union analysis of differential expression proteins (Fig 4B). Fifty-four proteins were down-regulated, and 20 proteins were up-regulated in both tissues, which were involved in energy production and conversion, amino acid trans-port and metabolism, translation, ribosomal structure and biogenesis, posttranslational modifi-cation, protein turnover and chaperones. While, 474 proteins were up-regulated at 20 DAP in endosperm, for which their functions were energy production and conversion, amino acid transport and metabolism, posttranslational modification, protein turnover, chaperones and translation, ribosomal structure and biogenesis. In addition, 329 proteins up-regulated in endo-sperm with functions in energy production and conversion, amino acid transport and metabo-lism, carbohydrate transport and metabometabo-lism, lipid transport and metabometabo-lism, translation, Fig 3. Functional classification of the identified proteins at all developmental stages for both endosperm (above) and pericarp (below) of maize inbred line N04 according to GO annotations in biological process (A), molecular function (B) and cellular component (C).
ribosomal structure and biogenesis, posttranslational modification, protein turnover, and chaperones, and 98 proteins up-regulated in pericarp with functions in posttranslational modi-fication, protein turnover, chaperones, amino acid transport and metabolism, translation, ribo-somal structure and biogenesis, chromatin structure and dynamics, secondary metabolites biosynthesis, transport and catabolism, were observed at three developmental stages.
Protein network integration on obtained proteome data
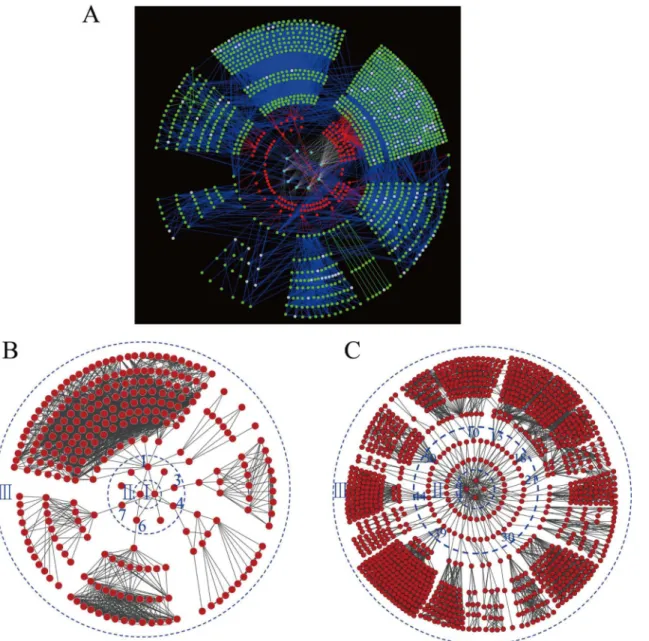
To obtain the specific proteins associated with kernel development, the biological networks of all identified proteins (Fig 5A), only the pericarp proteins (Fig 5B) and only the endosperm proteins (Fig 5C) were constructed based on protein interactions. Out of the 1,396 investigated proteins, 1,034 proteins were linked to KEGG orthology by constraining BLAST hits with an e-value1e-05. There were 125 proteins significantly expressed in 50 groups of comparisons between any two time-points with a criterion of fold change no less than five (Table 2). The gene model sequences of these proteins were run against KEGG orthology using BLAST to relate proteins to the functional pathway maps from the KEGG database.Fig 5Ashows a com-plex network of 125 proteins differentially expressed at the respective time points. Those differ-entially expressed proteins were involved in 54 KEGG pathways. All the network clusters were Fig 4. Hierarchical clustering analysis for the patterns of differentially expressed proteins in maize kernel development.A. intersection; B. Union.
related to the same biological processes. The top 10 pathways with the largest numbers of pro-teins were shown inTable 3, revealing their importance during the development of endosperm and pericarp in maize.
Of the two tissues, more differentially expressed proteins were integrated in the endosperm network (77) than in the pericarp network (9) (Fig 5B and 5C; Table D inS2 File). In the peri-carp protein network, 15 proteins with first-degree interactions and 255 proteins with second-degree interactions were found. For the endosperm network, 108 proteins with first-second-degree interactions and 1000 proteins with second-degree interactions were found. However, the Fig 5. A complex network of 125 proteins (A), proteins expressed in the pericarp only (B) and endosperm only (C) from two maize inbred lines at respective time points.In network A, the red nodes represent proteins from our experiments, while green nodes represent annotated orthologs or enzymes from the KEGG database. Gray nodes represent metabolites or compounds, green edges represent protein interactions, and red edges represent relations between our investigated proteins and entries from the KEGG database. In networks B and C, the red nodes in circles I, II and III indicate time points, differentially expressed proteins identified in this study, and interacting network proteins from the KEGG database.
functions of 4 proteins in the pericarp network and 44 proteins in the endosperm network were unknown.
Confirmation of proteins from iTRAQ by 2DE, relevant gene cloning and
expression analysis, and western blot
To verify the proteins identified by iTRAQ, the endosperm proteins at 10, 20 and 33 DAP for inbred N04 were separated by 2DE technology (Fig B inS2 File). In total, 47 protein spots with obvious differences were identified at a pH range from 3 to 10. They were digested with trypsin and analyzed by LC-MS/MS. By matching to the NCBInr database, 36 spots were processed successfully and their corresponding proteins were identified (Table E inS2 File). The majority of the proteins were related to posttranslational modification, carbohydrate transport and metabolism, amino acid transport and metabolism, and energy production and conversion. Compared with the quantitative endosperm proteins identified by iTRAQ, 16 proteins were commonly found, accounting for 44.44%.
To compare the expression patterns of iTRAQ proteins at the RNA level identified by iTRAQ were selected based on their expression differences among different samples and pre-dicted functions (Fig C inS2 File). The relevant genes were cloned and RT-PCR was per-formed. The results showed that the concordance between mRNA level and the protein abundance varied across different proteins, tissues and developmental stages (Fig C inS2 File). No complete concordance was found for any proteins.
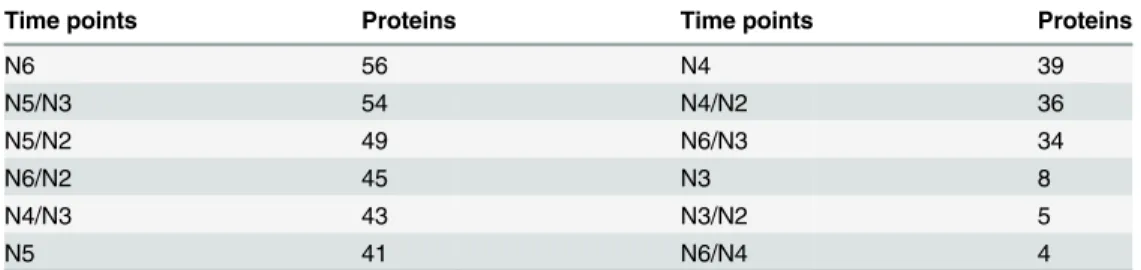
Table 2. Numbers of differentially expressed proteins at each time point.
Time points Proteins Time points Proteins
N6 56 N4 39
N5/N3 54 N4/N2 36
N5/N2 49 N6/N3 34
N6/N2 45 N3 8
N4/N3 43 N3/N2 5
N5 41 N6/N4 4
Note: At all single time points, the fold change of expression intensity were calculated by subtracting expression values at N1 from those time points. For example, at N6, there are 56 proteins with expression values at least 5 fold different from those at N1. At double time points, fold change is calculated as the difference between the two time points.
doi:10.1371/journal.pone.0143181.t002
Table 3. Top 10 pathways involving the most proteins.
Pathway ID Description Proteins
path:ko00290 Valine 16
path:ko00670 One carbon pool by folate 15
path:ko00500 Starch and sucrose metabolism 8
path:ko00410 beta-Alanine metabolism 7
path:ko00260 Glycine 7
path:ko00010 Glycolysis / Gluconeogenesis 7
path:ko00562 Inositol phosphate metabolism 7
path:ko04910 Insulin signaling pathway 7
path:ko00280 leucine and isoleucine degradation 7
path:ko03015 mRNA surveillance pathway 7
For the western blot, we characterized the four proteins from iTRAQ by using actin as con-trol (Fig C inS2 File). Comparison of the relative abundances of the four proteins between iTRAQ and western blot showed that all the same tendencies were observed. Although the expression level of protein GRMZM2G147687 was different in pericarp, but it was not signifi-cantly different between both methods.
Discussion
Maize kernel development was affected by multiple genes with dynamic expression levels through complex physiological and biological processes [3,4,6]. Proteome maps have become powerful tools for physiological studies of maize kernel development. In this research, the dynamic proteome of two kernel tissues, endosperm and pericarp, were analyzed by iTRAQ labeling in popcorn. The result by western blot for four proteins showed the same expression tendency as in iTRAQ. The protein regulation characteristics during the development of the endosperm and pericarp were uncovered.
Endosperm proteins involved in cell division and differentiation
Cell division, cell elongation and cell differentiation play critical roles in the kernel develop-mental process [20,63]. Hormones, tubulins, actins, dehydroascorbate reductase, ras-related proteins and heat shock proteins are all important in cell cycle control and cell proliferation during plant development [20,64–65]. In this study, 102 proteins directly involved in regulat-ing cell division, cell elongation and cell differentiation were identified at 10 DAP (Table F in S2 File). In addition, a polypeptide, cellular apoptosis susceptibility protein/chromosome-seg-regation protein (GRMZM5G881950), which is involved in chromosome segprotein/chromosome-seg-regation, control-ling cell proliferation and intracellular protein transport, was identified in the endosperm. This protein showed much higher expression level at 10 DAP than at 20 DAP in endosperm. Those proteins involved in cell division and differentiation showing obvious high expression levels at 10 DAP endosperm compared with that at 20 DAP endosperm, together with their specific proteins, might play important roles in resulting in the contrasting cell number and cell size of kernels.
Proteins involved in storage product accumulation during endosperm
development
The dry-matter of the maize endosperm mainly accumulated during 12–35 DAP, which was greatly different to the grain-filling periods of various inbreds/hybrids [4,15]. Generally, starch, which accounts for ~75% of the endosperm dry-matter, could be detected at 9–12 DAP and accumulated rapidly in the late stages [4,5]. In this study, the fast grain filling period was 10–26 DAP for popcorn inbred N04. Forty-five proteins directly involved in starch biosynthe-sis and metabolism were identified in the endosperm (Table G inS2 File). The protein expres-sion patterns in starch biosynthesis showed that 19 proteins having increased expresexpres-sion levels between 20 and 33 DAP in endosperm, reflecting the important role of this stage in determin-ing kernel weight.
The TCA cycle is not only a fundamental metabolic pathway for energy production, it also provides the substrates for amino acid synthesis or interconversion [66]. Certain amino acids can enter the TCA cycle [64–65]. Acetyl Coenzyme A (acetyl-CoA) is the important intermedi-ate metabolite of carbohydrintermedi-ates, lipids and amino acids that plays a key role in the TCA cycle [67–68]. In this study, 46 acetyl-CoA related enzymes were recognized, including acetyl-CoA acetyltransferase (2), acetyl-CoA carboxylase (2), acyl-CoA dehydrogenase (2), acyl-CoA syn-thetase (2) and acyl-CoA-binding protein (1), citrate synthase (3), aconitase (3), isocitrate dehydrogenase (6), oxoglutarate dehydrogenase complex (16), succinyl-CoA synthetase (2), succinate dehydrogenase (2) and malate dehydrogenase (5).
Proteins related to the formation and structure of the kernel pericarp
The pericarp plays two important roles during grain development, one is protecting the embryo and endosperm, and the other is the limiting grain expansion through extensibility and thickness [22]. A series of complex physiological and biochemical processes also takes place during the pericarp development.
The pericarp texture for the popcorn inbred N04 was very compact. Previous research had shown that popcorn varieties accumulate more extensin in the pericarp, which results in its tough texture. Additionally, the increase in extensin content paralleled the increase in whole kernel dry weight during kernel development [27]. In this study, 4 leucine-rich repeat exten-sin-like proteins were identified in the pericarp tissue (Table H inS2 File), which could modu-late cell morphogenesis by regulating cell wall formation and assembly. An increase in the expression of extensin-like proteins at late stages was beneficial for the formation of high exten-sion. Those specific proteins and highly expressed proteins in the pericarp might simulta-neously determine its special structure.
Protein functions and interactions revealed through their network
integration
Plant tissues undergo a series of dynamic physiological and biochemical processes to maintain its growth and development, which involve thousands of different proteins. Therefore, it is fairly difficult to reveal the possible relationships among these proteins. With the development of biological technologies, gene and protein expression profiles could be identified [30–31]. A metabolic network reconstruction could uncover the molecular mechanisms of a particular organism, which would be beneficial to unraveling the systems biology of metabolic pathways [32–33]. This would further contribute to the identification of key genes or proteins that play important roles in the biological and chemical processes during plant development [19].
In this research, the protein regulatory networks related to kernel development were con-structed based on the KEGG orthology system (Fig 5A). The functions of the differentially expressed proteins and their relationships were revealed. Also, the regulatory networks uncov-ered the differences between tissues, and the dynamic changes in protein expression level dur-ing kernel development. Of the 9 proteins in the pericarp protein network (Fig 5B), five proteins had first-degree interaction proteins. Three proteins each only had one first-degree interaction protein, one protein had two first-degree interaction proteins, and one protein had ten first-degree interaction proteins. The function for protein No.4 (GRMZM2G005633_P02) was uncharacterized protein contain chitin-binding domain type 3, which had two first-degree interaction proteins and took part in starch and sucrose metabolism. The gene to code this pro-tein was named asZmCHI-B, which regulated pericarp development [69].
9994), proteins No. 13 (GRMZM2G008714), proteins No. 18 (GRMZM2G097226) and pro-teins No. 44 (GRMZM2G001898), propro-teins No. 10 (GRMZM2G135283), propro-teins No. 21 (GRMZM2G154595), 30 (GRMZM2G090087) and 43 (GRMZM2G445905) had ten, eight, seven, six and five first-degree interaction proteins, respectively. Protein No. 50 (GRMZM2G 132903), which had the same function as protein No.1 (GRMZM2G339994) in the pericarp protein network, had the most of first-degree interaction proteins (23 proteins). The function for this protein was 3-hydroxyacyl-CoA dehydrogenase, which took part in alpha-linolenic acid metabolism and fatty acid metabolism [70–71]. The function for GRMZM2G339994_P01 was SDR dehydrogenases with different specificities (related to short-chain alcohol dehydroge-nases), which had 10 first-degree interaction proteins and took part in fatty acid biosynthesis and biotin metabolism [72]. Protein GRMZM2G090087_P02, with the function of delta 1-pyrroline-5-carboxylate dehydrogenase, had five first-degree interaction proteins and took part in alanine, aspartate, glutamate, arginine and proline metabolism [73–74]. In addition, 24 other proteins had three two and one first-degree interactions, respectively. Our future research would concentrate on the functional verification of these proteins and their interaction proteins.
Non-concordance of gene expression at RNA and protein levels
Proteins represent the end-products of the functional translations of genes. However, high lev-els of non-concordance between RNA and protein expression levlev-els have been observed in sev-eral previous studies [37–38,31,36]. In the endosperm of inbred B73, ~22% of the genes showed matching rank abundances between their mRNA and protein using MS and the Nim-bleGen microarray [31]. In the developmental maize leaf blade gradient, 13% of the genes detected by RNA-seq were identified at the protein level, whereas 99% of all detected proteins were identified at the mRNA level using label-free shotgun proteomics and transcript data based on RNA-seq [39]. In our present study, four proteins identified by iTRAQ were selected to reveal their expression tendency at the mRNA level. The results showed that no complete concordance was found for any proteins.
Several reasons might cause a high non-concordance between mRNA and protein levels, such as posttranscriptional regulation [37], posttranslational modification, and differential protein and mRNA degradation rates [38–39], codon bias, UTRs and length of mRNAs, and protein functions. Considering that the gene expression at protein level might reflect the real function of genes, temporal and spatial proteins should be extensively detected to thoroughly reveal the genes in influencing kernel development in maize.
Supporting Information
S1 File. Supplementary dataset.Sheet 1. The peptides of identified proteins using iTRAQ; Sheet 2. The quantitation of identified proteins in endosperm and pericarp using iTRAQ. (XLS)
differentiation at 3 developmental stages.Table G.The functions and expression differences of inbred line N04 for 45 endosperm proteins directly involved in starch biosynthesis and metab-olism at 3 developmental stages.Table H. The functions and expression differences of inbred line N04 for proteins directly related with the formation and structure of kernel pericarp.Fig A.Protein functional categories annotated for pericarp (A) and endosperm (B) of inbred line N04 according to assignments of cluster of orthologous groups (COG).Fig B.2-DE protein map of 20DAP endosperm for inbred line N04.Fig C.Real-time PCR and Western blot analy-sis of four proteins from iTRAQ in endosperm and pericarp at developmental stages for inbred line N04. (A) Relative abundance of the protein from iTRAQ, and all the groups were controled by pericarp at 10 DAP. (B) Real-time PCR for four proteins mRNA expression in IL N04 at 10 DAP, 20 DAP and 33 DAP. (C) Western blot analysis for the proteins after separation on SDS-PAGE, the proteins were controled by actin. VEPI, Validated the Expression of the Pro-teins by using iTRAQ. The results are presented as means+SEM pooled from three indepen-dent experiments in B and C.
(DOC)
Acknowledgments
This work was funded by the Plan for Fundamental and Forward Technology Research in Henan Province (121100910400), the Plan for Scientific Innovation Talent of Henan Province (124200510003), the Agricultural Science Creation in Henan Province, and the Earmarked Fund for Henan Agriculture Research System (S2010-02-G01).
Author Contributions
Conceived and designed the experiments: YL YD QW. Performed the experiments: QW ZM DQ CH YR. Analyzed the data: LZ YD WX CD FD XC. Wrote the paper: YL YD LZ WX.
References
1. Lai J, Dey N, Kim CS, Bharti AK, Rudd S, Mayer KF, et al. (2004) Characterization of the maize endo-sperm transcriptome and its comparison to the rice genome. Genome Research 14:1932–1937. PMID: 15466291
2. Liu YY, Li JZ, Li YL, Wei MG, Cui QX, Wang QL (2010) Identification of differentially expressed genes at two key endosperm development stages using two maize inbreds with large and small grain and inte-gration with detected QTL for grain weight. Theoretical and Applied Genetics 121:433–447. doi:10. 1007/s00122-010-1321-xPMID:20364377
3. Méchin V, Balliau T, Château-Joubert S, Davanture M, Langella O, Négroni L, et al. (2004) A two-dimensional proteome map of maize endosperm. Phytochemistry 65:1609–1618. PMID:15276456 4. Méchin V, Thévenot C, Le Guilloux M, Prioul JL, Damerval C (2007) Developmental analysis of maize
endosperm proteome suggests a pivotal role for pyruvate orthophosphate dikinase. Plant Physiology 143:1203–1219. PMID:17237188
5. Prioul JL, Méchin V, Lessard P, Thévenot C, Grimmer M, Chateau-Joubert S, et al. (2008) A joint tran-scriptomic, proteomic and metabolic analysis of maize endosperm development and starch filling. Plant Biotechnology Journal 6:855–869. PMID:19548342
6. Scanlon MJ, Takacs E (2009) Kernel biology. Bennetzen J, Hake S, eds. Handbook of Maize: Its Biology. pp121–143. New York: Springer.
7. Verza NC, E Silva TR, Neto GC, Nogueira FTS, Fisch PH, de Rosa VE, et al. (2005) Endosperm-pre-ferred expression of maize genes as revealed by transcriptome-wide analysis of expressed sequence tags. Plant Molecular Biology 59:363–374. PMID:16247562
8. Woo YM, Hu DW, Larkins BA, Jung R (2001) Genomics analysis of genes expressed in maize endo-sperm identifies novel seed proteins and clarifies patterns of zein gene expression. Plant Cell 13:2297–2317. PMID:11595803
10. Balconi C, Hartings H, Lauria M, Pirona R, Rossi V, Motto M (2007) Gene discovery to improve maize grain quality traits. Maydica 52:357–373.
11. Watson SA (1987) Structure and composition. In Watson SA, Ramstad PE, eds, Corn: Chemistry and Technology. PP 53–82. American Association of Cereal Chemists, St. Paul, MN.
12. Wolf WJ, Cull IM, Helm JL, Zuber MS (1969) Measuring thickness of excised mature corn pericarp. Agronomy Journal 61:777–779.
13. Olsen OA, Linnestad C, Nichols SE (1999) Developmental biology of the cereal endosperm. Trends in Plant Science 4:253–257. PMID:10407440
14. Sabelli PA, Larkins BA (2009) The development of endosperm in grasses. Plant Physiology 149, 14–
26. doi:10.1104/pp.108.129437PMID:19126691
15. Li L, Blanco M, Jay-lin J (2007) Physicochemical properties of endosperm and pericarp starches during maize development. Carbohydrate Polymers 67:630–639.
16. Olsen OA (2004) Nuclear endosperm development in cereals andArabidopsis thaliana. The Plant Cell Online 16:S214–S227.
17. Schweizer L, Yerk-Davis GL, Phillips RL, Srienc F, Jones RJ (1995) Dynamics of maize endosperm development and DNA endoreduplication. Proceedings of the National Academy of Sciences 92:7070–7074.
18. Motto M, Balconi C, Hartings H, Rossi V (2010) Gene discovery for improvement of kernel quality-related traits in maize. Genetika 42:23–56.
19. Motto M, Hartings H, Fracassetti M, Consonni G (2011) Grain quality-related traits in maize: gene identi-fication and exploitation. Maydica 56:291–314.
20. TakáčT, Pechan T, Samaj J (2011) Differential proteomics of plant development. Journal of Proteomics 74:577–88. doi:10.1016/j.jprot.2011.02.002PMID:21315196
21. Morohashi K, Casas MI, Falcone Ferreyra ML, Mejía-Guerra MK, Pourcel L, Yilmaz A, et al. (2012) A genome-wide regulatory framework identifies maizepericarp color1controlled genes. Plant Cell 24:2745–2764. doi:10.1105/tpc.112.098004PMID:22822204
22. Gambin BL, Borras L, Otegui ME (2007) Is maize kernel size limited by its capacity to expand? Maydica 52:431–441.
23. Kiniry JR, Wood CA, Spanel DA, and Bockholt AJ (1990) Seed weight response to decreased seed number in maize. Agronomy Journal 82:98–102.
24. Ito GM, Brewbaker JL (1991) Genetic analysis of pericarp thickness in progenies of eight corn hybrids. Journal of the American Society for Horticultural Science 116:1072–1077.
25. Purdy JL, Crane PL (1967a) Inheritance of drying rate in“mature”corn (Zea maysL.). Crop Science 7:294–296.
26. Purdy JL, Crane PL (1967b) Influence of pericarp on differential drying rate in“mature”corn (Zea mays L.). Crop Science 7:379–381.
27. Hood EE,Hood KR,Fritz SE (1991) Hydroxyproline-rich glycoproteins in cell walls of pericarp from maize, Plant Science 79, 13–22.
28. Gygi SP, Rist B, Gerber SA, Turecek F, Gelb MH, Aebersold R (1999) Quantitative analysis of complex protein mixtures using isotope-coded affinity tags. Nature Biotechnology 17:994–999. PMID: 10504701
29. Berger F. 1999. Endosperm development. Current Opinion in Plant Biology 2, 28–32. PMID:10047564 30. Fu J, Cheng Y, Linghu J, Yang X, Kang L, Zhang Z, et al. (2013) RNA sequencing reveals the complex
regulatory network in the maize kernel. Nature Communications 4:2832. doi:10.1038/ncomms3832 PMID:24343161
31. Walley JW, Shen Z, Sartor R, Wu KJ, Osborn J, Smith LG, et al. (2013) Reconstruction of protein net-works from an atlas of maize seed proteotypes. Proceedings of the National Academy of Sciences 110:E4808–E4817.
32. Francke C, Siezen RJ, Teusink B (2005) Reconstructing the metabolic network of a bacterium from its genome. Trends in Microbiology 13:550–8. PMID:16169729
33. Thiele I, Palsson BØ(2010) A protocol for generating a high-quality genome-scale metabolic recon-struction. Nature Protocols 5:93–121. doi:10.1038/nprot.2009.203PMID:20057383
35. Zhang M, Zhao H, Xie S, Chen J, Xu Y, Wang K, et al. (2011) Extensive, clustered parental imprinting of protein-coding and noncoding RNAs in developing maize endosperm. Proceedings of the National Academy of Sciences 108:20042–20047.
36. Vogel C, Marcotte EM (2012) Insights into the regulation of protein abundance from proteomic and tran-scriptomic analyses. Nature Reviews Genetics 13:227–232. doi:10.1038/nrg3185PMID:22411467 37. Gygi SP, Rochon Y, Franza BR, Aebersold R (1999) Correlation between protein and mRNA
abun-dance in yeast. Molecular and Cellular Biology 19:1720–1730. PMID:10022859
38. Pechanova O, TakáčT, Samaj J, Pechan T (2013) Maize proteomics: an insight into the biology of an important cereal crop. Proteomics 13:637–62. doi:10.1002/pmic.201200275PMID:23197376 39. Ponnala L, Wang Y, Sun Q, van Wijk KJ (2014) Correlation of mRNA and protein abundance in the
developing maize leaf. The Plant Journal 78: 424–440. doi:10.1111/tpj.12482PMID:24547885 40. Schulze WX, Usadel B (2010) Quantitation in mass-spectrometry-based proteomics. Annual Review of
Plant Biology 61:491–516. doi:10.1146/annurev-arplant-042809-112132PMID:20192741 41. Wienkoop S, Larrainzar E, Niemann M, Gonzales EM, Lehmann U, Weckwerth W (2006) Stable
iso-tope-free quantitative shotgun proteomics combined with sample pattern recognition for rapid diagnos-tic. Journal of Separation Science 29:2793–2801. PMID:17305241
42. Bantscheff M, Schirle M, Sweetman G, Rick J, Kuster B (2007) Quantitative mass spectrometry in pro-teomics: a critical review. Analytical and Bioanalytical Chemistry 389:1017–31. PMID:17668192 43. Ross PL, Huang YN, Marchese JN, Williamson B, Parker K, Hattan S, et al. (2004) Multiplexed protein
quantitation in Saccharomyces cerevisiae using amine-reactive isobaric tagging reagents. Molecular and Cellular Proteomics 3:1154–1169. PMID:15385600
44. Unlü M, Morgan ME, Minden JS (1997) Difference gel electrophoresis: a single gel method for detecting changes in protein extracts. Electrophoresis 18:2071–7. PMID:9420172
45. Bondarenko PV, Chelius D, Shaler TA (2002) Identification and relative quantitation of protein mixtures by enzymatic digestion followed by capillary reversed-phase liquid chromatography-tandem mass spectrometry. Analytical Chemistry 74:4741–4749. PMID:12349978
46. Unwin RD, Griffiths JR, Whetton AD. 2010) Simultaneous analysis of relative protein expression levels across multiple samples using iTRAQ isobaric tags with 2D nano LC-MS/MS. Nature Protocols 5:1574–82. doi:10.1038/nprot.2010.123PMID:21085123
47. Fukao Y, Ferjani A, Tomioka R, Nagasaki N, Kurata R, Nishimori Y, et al. (2011) iTRAQ analysis reveals mechanisms of growth defects due to excess zinc inArabidopsis. Plant Physiology 155:1893–
907. doi:10.1104/pp.110.169730PMID:21325567
48. Lan P, Li W, Wen TN, Shiau JY, Wu YC, Lin W, et al. (2011) iTRAQ protein profile analysis of Arabidop-sisroots reveals new aspects critical for iron homeostasis. Plant Physiology 155:821–834. doi:10. 1104/pp.110.169508PMID:21173025
49. Owiti J, Grossmann J, Gehrig P, Dessimoz C, Laloi C, Hansen MB, et al. (2011) iTRAQ-based analysis of changes in the cassava root proteome reveals pathways associated with post-harvest physiological deterioration. Plant Journal 67:145–56. doi:10.1111/j.1365-313X.2011.04582.xPMID:21435052 50. Silva-Sanchez C, Chen S, Zhu N, Li QB, Chourey PS (2013) Proteomic comparison of basal endo-sperm in maizeminiature1mutant and its wild-typeMn1. Frontiers in Plant Science 4:211. doi:10. 3389/fpls.2013.00211PMID:23805148
51. Roy A, Yang Z, Robbins M, Chopra S, Rohila J (2011) proteome analysis of maize pericarp by DIGE and ITRAQ. Proceedings of the South Dakota Academy of Science 90:186.
52. Li JZ, Zhang ZW, Li YL, Wang QL, Zhou YG (2011) QTL consistency and meta-analysis for grain yield components in three generations in maize. Theoretical and Applied Genetics 122:771–782. doi:10. 1007/s00122-010-1485-4PMID:21063866
53. Takacs EM, Suzuki M, Scanlon MJ (2012) Discolored1 (DSC1) is an ADP-Ribosylation factor-GTPase activating protein required to maintain differentiation of maize kernel structures. Frontiers in Plant Sci-ence 3:115. doi:10.3389/fpls.2012.00115PMID:22666226
54. Rasband WS (2009) ImageJ. US National Institutes of Health, Bethesda, MD, USA (1997–2009) http://rsb.info.nih.gov/ij.
55. Dewitte W, Scofield S, Alcasabas AA, Maughan SC, Menges M, Braun N, et al. (2007)Arabidopsis CYCD3 D-type cyclins link cell proliferation and endocycles and are rate-limiting for cytokinin responses. Proceedings of the National Academy of Sciences 104:14537–14542.
56. Lending CR, Larkins BA (1992) Effect of the floury-2 locus on protein body formation during maize endosperm development. Protoplasma 171:123–133.
58. Braun DP, Ding JC, Shaheen F, Willey JC, Rana N, Dmowski WP. (2007) Quantitative expression of apoptosis-regulating genes in endometrium from women with and without endometriosis. Fertility and Sterility 87:263–268. PMID:17094974
59. Wei JL, Chen S, Zeng LX, Yang JY, Liu XQ, Zhu XY. (2011) Quantitative expression analysis of rice bacterial blight resistant candidate genes ofXa7by real-time fluorescent quantitative PCR. Molecular Plant Breeding 9:9–16.
60. Ganeshan S, Vitamvas P, Fowler DB, Chibbar RN. (2008) Quantitative expression analysis of selected CORgenes reveals their differential expression in leaf and crown tissues of wheat (Triticum aestivum L.) during an extended low temperature acclimation regimen. Journal of Experimental Botany 59:2393–2402. doi:10.1093/jxb/ern112PMID:18508811
61. Wang X, Li X, Deng X, Han H, Shi W, Li Y (2007). A protein extraction method compatible with proteo-mic analysis for the euhalophyte Salicornia europaea. Electrophoresis 28, 3976–3987. PMID: 17960840
62. Chatelain E, Hundertmark M, Leprince O, Gall S L, et al. (2012) Temporal profiling of the heat‐stable proteome during late maturation of Medicago truncatula seeds identifies a restricted subset of late embryogenesis abundant proteins associated with longevity[J]. Plant, cell & environment, 35(8): 1440–
1455.
63. Kiesselbach TA. (1998) The Structure and Reproduction of Corn. CSHL Press, Cold Spring Harbor.
64. Al-Whaibi MH (2011) Plant heat-shock proteins: A mini review. Journal of King Saud University-Science 23:139–150.
65. Sabelli PA, Leiva-Neto JT, Dante RA, Nguyen H, Larkins BA (2005) Cell cycle regulation during maize endosperm development. Maydica 50:485–496.
66. Stymne S, Stobart AK (1987) Triacylglycerol biosynthesis. In: Stumpf P K, Conn EE, eds. The Biochem-istry of Plants, pp 175–214. Academic Press; New-York.
67. Sweetlove LJ, Beard KF, Nunes-Nesi A, Fernie AR, Ratcliffe RG (2010) Not just a circle: flux modes in the plant TCA cycle. Trends in Plant Science 15:462–70. doi:10.1016/j.tplants.2010.05.006PMID: 20554469
68. Kennedy EP (1961) Biosynthesis of complex lipids. Federation proceedings 20:934. PMID:14455159 69. Grotewold E, Peterson T (1994) Isolation and characterization of a maize gene encoding chalcone
fla-vonone isomerase[J]. Molecular and General Genetics 242: 1–8. PMID:8277939
70. Szymanski J, Brotman Y, Willmitzer L, Cuadros-Inostroza A (2014) Linking gene expression and mem-brane lipid composition of Arabidopsis. The Plant Cell 26: 915–928. doi:10.1105/tpc.113.118919 PMID:24642935
71. Aprile A, Havlickova L, Panna R, MarèC, Borrelli GM, Marone D, et al. (2013) Different stress respon-sive strategies to drought and heat in two durum wheat cultivars with contrasting water use efficiency. BMC genomics 14: 821. doi:10.1186/1471-2164-14-821PMID:24267539
72. Yao R, Yasuoka A, Kamei A, Ushiama S, Kitagawa Y, Rogi T, et al. (2014) Nuclear receptor-mediated alleviation of alcoholic fatty liver by polyphenols contained in alcoholic beverages. PloS One 9: e87142. doi:10.1371/journal.pone.0087142PMID:24498295
73. Ayliffe MA, Roberts JK, Mitchell HJ, Zhang R, Lawrence GJ, Ellis JG, et al. (2002) A plant gene up-regu-lated at rust infection sites. Plant Physiology 129: 169–180. PMID:12011348