Católica Porto Business School
2018
Luis Filipe Vasconcelos e Sousa Minnemann Baptista
A Performance Measurement Framework for Service Sectors
Context, Enablers and Results
A Performance Measurement Framework for
Service Sectors
Final Dissertation Work
presented to the Universidade Católica Portuguesa to obtain a Masters’ Degree in Management
by
Luís Minnemann
under the guidance of
Professor Drª Maria Conceição Portela and Professor Dr. Rui Sousa
Católica Porto Business School March 2018
i
Acknowledgement
To Professors Maria Conceição Portela and Rui Sousa, who with great patience and wisdom, guided me through this journey.
To my parents and family, who have always supported me full heartedly during the realization of this project.
To my dear friend Ricardo Valente Pereira, for always been there in my times of need, despite been across half the world.
ii
Resumo
O objetivo deste trabalho é desenvolver uma nova framework específica para a avaliação do desempenho de setores de serviços que permita avaliar a evolução do desempenho do setor bem como comparar o desempenho das empresas, não só face à performance média do setor, mas também a outras empresas a operar no mesmo setor.
Foi realizada uma revisão da literatura existente sobre avaliação de desempenho e da análise de 14 frameworks, e de cada dimensão abordada em cada um, foram identificadas as dimensões comuns de avaliação de desempenho.
Como resultado, a Context, Enablers and Results framework é apresentada como novo modelo para a avaliação de desempenho para os setores de serviços.
Palavras-chave: Framework de Avaliação de Desempenho; Setor de Serviços; Indicadores de Desempenho; Dimensões de Desempenho;
iii
Abstract
The main objective of this work is to develop a new specific framework for the performance measurement of service sectors which allows the assessment of the sector performance as well as to enable companies’ comparison, not only against the average sector performance, but also to other companies operating in the same sector.
A review of the performance measurement existing literature was made and from the analysis of 14 frameworks and each dimension addressed on each, common performance measurement dimensions were identified.
As a result, the Context, Enablers and Results frameworks is proposed as a new model for the performance measurement for service sectors.
Keywords: Performance Measurement Framework; Service Sector; Performance Indicators; Performance Dimensions;
iv
Index
Acknowledgement ... i Resumo ... ii Abstract ... iii Index ... iv Figure Index ... vTable Index ... vii
Introduction ... 1
Chapter 1: Literature Review ... 2
1.1 Performance Measurement: definition and relevance ... 2
1.2 Performance Measurement Frameworks ... 3
1.2.1 Organizational Performance Frameworks ... 3
1.2.2 Country Performance Frameworks ... 14
1.2.3 Literature Review Summary ... 19
Chapter 2: Frameworks Overview ... 21
2.1 Organizational Performance Frameworks Overview ... 22
2.2 Country Performance Framework Overview... 26
2.3 Overview ... 29
Chapter 3: Proposing CER: a new framework ... 32
3.1 Framework Objective ... 32
3.2 Conceptual measurement framework ... 33
Context ... 34
Enablers ... 36
Results ... 41
3.3 Context, Enablers and Results General Framework ... 53
3.4 Applying the CER Framework to a service sector ... 56
3.5 Methodology ... 58
Chapter 4: Application of the CER framework to the Portuguese Retail Sector of Supermarkets and Hypermarkets ... 61
4.1 Data Source and Scope... 61
4.2 Application of the CER framework ... 64
4.2.1 Sector Performance ... 65
4.2.2 Application of the CER framework to a company: the Pingo Doce – Distribuição Alimentar, S.A. case ... 71
Chapter 5: Conclusions, Limitations and Future Work ... 74
5.1 Conclusions ... 74
5.2 Limitations and Future Work ... 76
Bibliography ... 79
Annex ... 83
v
Figure Index
Figure 1: Performance Measurement Matrix adapted from Keegan, Eiler, & Jones, 1989 ... 3
Figure 2: SMART framework adapted from Lynch & Cross, 1991 ... 4 Figure 3: Balanced Scorecard framework adapted from Kaplan & Norton, 1992 ... 5 Figure 4: Prism Model adapted from Neely, Adams, & Crowe, 2001 ... 7 Figure 5: The innovation measurement framework (OECD/EUROSTAT, 2005, p.34) ... 8
Figure 6: EFQM Excellence Model adapted from an overview of the EFQM Excellence model ... 10
Figure 7: Malcolm Baldrige Model framework adapted from www.quality.nist.gov ... 11
Figure 8: GII framework (Johnson Cornell et al., 2016) ... 16 Figure 9:The Global Competitiveness Index framework ... 17 Figure 10: EIS measurement framework groups and dimensions (European Innovation Scoreboard 2017, p.8) ... 19
Figure 11: Grouped dimensions categories: context, enablers and results .... 21 Figure 12: CER dimensions framework ... 33 Figure 13: Economic activities hierarchy adapted from NACE Rev. 2, page 13 ... 57 Figure 14: Evolution of the number of companies in the Portuguese retail sector of supermarkets and hypermarkets ... 66
Figure 15: Evolution of sector weight and employment rate in the Portuguese retail sector of supermarkets and hypermarkets ... 66
Figure 16: Evolution of sector capital intensity in the Portuguese retail sector of supermarkets and hypermarkets ... 67
vi
Figure 17: Evolution of sector weight of debt service and leverage in the Portuguese retail sector of supermarkets and hypermarkets ... 68
Figure 18: Evolution of sector supplier debt in the Portuguese retail sector of supermarkets and hypermarkets ... 68
Figure 19: Evolution of the rentability ratios in the Portuguese retail sector of supermarkets and hypermarkets ... 69
Figure 20: Evolution of the current ratio and solvency rate in the Portuguese retail sector of supermarkets and hypermarkets ... 69
Figure 21: Evolution of the sector EBITDA and EBIT in the Portuguese retail sector of supermarkets and hypermarkets ... 70
Figure 22: Evolution of the average collection period, average days payable outstanding and average days sales of inventory in the Portuguese retail sector of supermarkets and hypermarkets ... 70
vii
Table Index
Table 1: Dimensions and subdimensions of Innovation Scoring model (COTEC
Innovation Scoring Support Manual, p.10) ... 9
Table 2: Dimensions and measures of the Performance Measurement System for Service Industries adapted from Fitzgerald, Brignall, Johnston, & Silvestro, 1991 ... 13
Table 3: Dimensions and indicators of the EQS adapted from European Quality Scoreboard ... 18
Table 4: Literature review collected models ... 20
Table 5: Organizational performance frameworks dimensions ... 22
Table 6: Country performance frameworks dimensions ... 26
Table 7: Organization and country frameworks dimensions comparison ... 30
Table 8: Example of retail sector divisions, groups, classes and subclasses adpted from Classificação Portuguesa das Actividades Económicas Rev.3 ... 57
Table 9: Indicators data sources ... 61
Table 10: Sales variation in the Portuguese retail sector of supermarkets and hypermarkets from 2011 to 2016 ... 71
Table 11: Variation between Pingo Doce- Distribuição Alimentar, S.A. and the sector value for each Financing Indicators and respective dimension Score value ... 72
Table 12: Variation between Pingo Doce- Distribuição Alimentar, S.A. and the sector value for each Financial Indicators and respective dimension Score value ... 73
Table 13: Portuguese Retail Sector of Supermarkets and Hypermarkets Industry Dimension Data ... 104
viii
Table 14: Portuguese Retail Sector of Supermarkets and Hypermarkets Financing and Financial Dimensions Data ... 105
Table 15: Portuguese Retail Sector of Supermarkets and Hypermarkets Results Category, Quality and Financial Dimension Data ... 106
1
Introduction
Currently, more and more countries are turning the focus of their economies from products to services. What we verified in the existing literature of performance measurement is that, although the topic has attracted great interest in the last few decades (Taticchi et al., 2010), the existing frameworks not only do not consider the specificity of services, but also no exclusive or oriented framework for service sectors has been proposed. The currently existing frameworks can be classified into two groups by level of scope, (i) organization performance measurement, and (ii) country performance measurement, leaving a gap for sector performance measurement frameworks.
Our objective with this thesis is, by taking advantage of the identified gap in performance measurement literature, to propose the design of a new framework specific for the measurement of the performance of service sectors, the Context, Enabler and Result (CER) framework.
To achieve our aim, first of all, we undertake a literature review of the concept of performance measurement and its relevance, the existing models and their respective advantages and disadvantages. We analyze if there is an existing eligible framework that is adaptable or if there is the need to create and propose a new framework. After that, we verify the dimensions and reality that a model should contemplate by analyzing existing frameworks in order to identify the main common dimensions across the reviewed frameworks and performing an overview of all dimensions identified. Finally, we propose Context, Enablers and Results framework, a new performance measurement framework for service sectors, and exemplify its use in the Portuguese retail sector of supermarkets and hypermarkets. We conclude this work with the presentation of our findings, as well as, the identification of limitations possible future research.
2
Chapter 1: Literature Review
1.1 Performance Measurement: definition and relevance
The concept of performance measurement has been discussed for a long time and its relevance in management has been long debated and reviewed in the existing literature. When trying to grasp the concept of performance measurement, researchers can not agree on a single definition (Franco-Santos et al., 2007). Neely et al., (1995) defines it as “the process of quantifying the efficiency and effectiveness of actions”, while Otley, (1999) takes an accounting perspective and considers it a “system that provides the information that is intended to be useful to managers in performing their jobs and to assist organizations in developing and maintaining viable patterns of behavior”. Many other authors have proposed different definitions (Gates, (1999),Bititci et al., (1997), Bourne et al., (2003), Maisel, (2001), McGee, (1992), Lebas, (1995), Forza & Salvador, (2000), Atkinson, (1998)).
We will consider Bourne et al., (2003) definition of performance measurement system as “the use of a multi-dimentional set of performance measures for the planning and management of a business”.
The relevance of performance measurement in management has been long debated and reviewed in the existing literature. Not only has performance measures been recognized as an integral part of the planning and control cycle (Barnard, 1962), but also most basic methods used to manage big business today were already been used by 1910 (Chandler, 1977, p.417). While Garvin, (1993) believes you cannot manage something if you cannot measure it, Lebas, (1995) goes further and negates the existence of management without performance measurement. Research also indicates that, the use of balanced performance measurement systems as the basis for management increases organization
3
performance (Lingle & Schiemann, 1996). Work in performance measurement area has grown over time, to adjust changes in the performance measurement needs of the business, and has drawn great interest in the last 20 years (Taticchi et al., 2010).
1.2 Performance Measurement Frameworks
1.2.1 Organizational Performance Frameworks
With the growth of literature showing the relevance of performance measurement in management, some authors proposed frameworks to assist managers to measure performance inside their organizations.
The Performance Measurement Matrix (PMM) was proposed by (Keegan, Eiler, & Jones, 1989), and assisted managers into categorizing performance measures, as seen in Figure 1, into either, internal or external, and non-cost and cost.
Figure 1: Performance Measurement Matrix adapted from Keegan, Eiler, & Jones, 1989 -Repeat buyers -Customer complaints -Market share -Competitive cost position -Relative R&D expenditure -Design cycle -Percent on time delivery -New products -Design cost -Material cost -Manufacturing cost Non-cost Cost External Internal
4
While the simplicity of this framework allows to accommodate any measure of performance (A. Neely et al., 1995), it does not establish a link between the different performance dimensions (A. Neely et al., 2000).
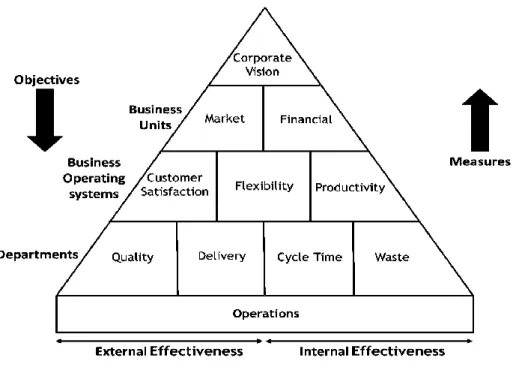
The Strategic Measurement Analysis and Reporting Technique (SMART) proposed by (Lynch & Cross, 1991) is a system that explains the link between different hierarchical levels of the organization.
Figure 2: SMART framework adapted from Lynch & Cross, 1991
The model (Figure 2) shows that, the actions needed to achieve the corporate vision, can be cascaded down through several levels:
• Level 1: at the top of organization is the corporate vision through which the organization describes how it will achieve long-term success;
• Level 2: This level focuses on the achievements of the organization critical success factors in market related measures and financial measures;
• Level 3: the marketing and financial strategies set in the previews level must be linked to the aim of customer satisfaction;
• Level 4: the status of the former level can be monitored using the lower level departmental indicators of quality, delivery, cycle time and waste.
5
While on the left hand side of the pyramid are the measures which have an external focus, and which are mainly non-financial, on the right hand side are the measures focused on the internal efficiency of the organization being these mainly financial.
Lynch & Cross (1991) propose measures relating to business operating systems. As the organization operates at different levels and each level has different focus it is important that these different levels support each other. They propose that customer satisfaction, flexibility and productivity are the driving forces in which company objectives are based on. They suggest that these forces can be monitored by key performance indicators (KPI), which can be derived from lower level measures of quality, cycle time, delivery and waste. They propose measuring performance through KPI across nine dimensions: market, financial, customer satisfaction, flexibility, productivity, quality, delivery, cycle time and waste while the corporate vision is implemented by those responsible for the strategic direction of the organization.
The Balanced Scorecard (BSC) framework was presented by (Kaplan & Norton, 1992) as a way for top managers to gather a view of their business. The model translates the organization objectives and strategy into a set of performance indicators across four perspectives, shown in Figure 3:
Figure 3: Balanced Scorecard framework adapted from Kaplan & Norton, 1992
• Customer perspective: “How do customers see us?”, this perspective is evaluated by using direct and indirect measures. While direct measures
Goals Measures
Goals Measures Goals Measures
Goals Measures
Financial Perspective
Innovation and Learning Perspective
6
involve surveying customers and gathering their opinions, indirect measures analyzes customers without involving them directly in the process;
• Internal process perspective: “What must we excel at?”, the measures are linked to the organization business processes, which are defined by the key processes the company must excel in to achieve a competitive advantage;
• Learning and growth perspective: “Can we continue to improve and create value?”, reflects the company ability to continually develop improvements and adding value using continuous learning.
• Financial perspective: “How do we look to shareholders?”, the financial perspective reflects the organization ability to make profits, it reveals if the organization strategy, implementation and execution are contributing to improvement.
In this framework, the performance measurement is done, after the management set the objectives, by using KPIs in each dimension and comparing performance with those established objectives. By assessing the KPI, managers can assess the current performance of the organization on that subject, allowing them to identify if the activities need improvement or are within the parameters to reach the settled objective.
The Performance Prism framework (PRISM) was created by (Neely et al., 2001) with the aim to be more flexible and offer a wider or narrow focus, in agreement with the organization needs. It is a three-dimensional model, as shown in Figure 4, with the purpose of measuring the performance of the entire organization, where each side corresponds to a specific area of analysis.
7
Figure 4: Prism Model adapted from Neely, Adams, & Crowe, 2001
• Stakeholder satisfaction: who are the key stakeholders and what do they want or need?
• Stakeholder contribution: What does the organization want and need from their stakeholders?
• Strategies: what are the strategies that the organization must apply to satisfy not only stakeholder’s wants and needs but their requirement also? • Processes: what processes need to be applied by the organization to
execute its strategy?
• Capabilities: what capabilities are needed to implement to allow the organization to operate their processes more effectively and efficiently?
The Performance Prism tries to demonstrate that, to survive in the complex world, not only there is a need for executives to understand the needs from all stakeholders, but also their strategies, processes and capabilities need to be linked and aligned, in order to satisfy those same needs and deliver value to their stakeholders (Neely et al., 2001).
The Performance Prism is a framework, which can be used by management teams to identify key questions that are needed to be addressed when managing their business. After these issues are identified, goals can be settled and measured, similarly to the BSC model, by KPIs.
The Oslo Manual (OCDE/EUROSTAT, 2005) framework was co-developed by the Eurostat and the OECD and covers the dimension innovation in the business
Stakeholder
Processes Capabilities
Stakeholder Strategies
8
enterprise sector. Dealing with innovation at the firm level, it covers four types of innovation: product, process, organizational and marketing.
The Manual defines a set of guidelines for collection and interpretation of innovation based on the following characteristics: innovation in the firm, linkages with other firms and public research institutions, the institutional framework in which firms operate, and the role of demand (Figure 5).
Figure 5: The innovation measurement framework (OECD/EUROSTAT, 2005, p.34)
At the firm level, the innovation factors identified are: Research and Development, and Innovative activity. The environment determines the parameters within which the organizations operate. Those parameters can be:
9
• Basic educational system of population;
• Higher education system; • Technical training system; • Science and Research
base; • Shared codified knowledge; • Innovation policies; • Legislative and macroeconomic settings; • Infrastructure (transport and telecommunication); • Financial ease of access; • Market accessibility; • Industry Structure and
competitive environment.
Developed by COTEC Portugal in 2017 (COTEC Portugal, 2017), the Innovation Scoring 2.0 (CIS) is an online tool for an organization performance measurement. The conceptual model, shown in Table 1, is composed of 5 dimensions (strategy, organization, processes of investigation, development and innovation (IDI), enhancers and impact) and 14 subdimensions of analysis. Table 1: Dimensions and subdimensions of Innovation Scoring model (COTEC Innovation Scoring Support Manual, p.10)
A. Strategy B. Organization C. Processes IDI D. Enhancers E. Impact A1. Context Analysis B1. Structure and Governance C1. Generation and assessment of ideas D1. External
Relationships E1. Market
A2. Strategic Planning B2. Human Capital C2. Project Management D2. Financing E2. Sustainability A3. Culture and Leadership B3. Organizational skills C3. Intellectual Property Protection and Appreciation D3. Knowledge Management
The model includes 30 main questions distributed by the 14 subdimensions to measure the organization, each with its own ponderation.
10
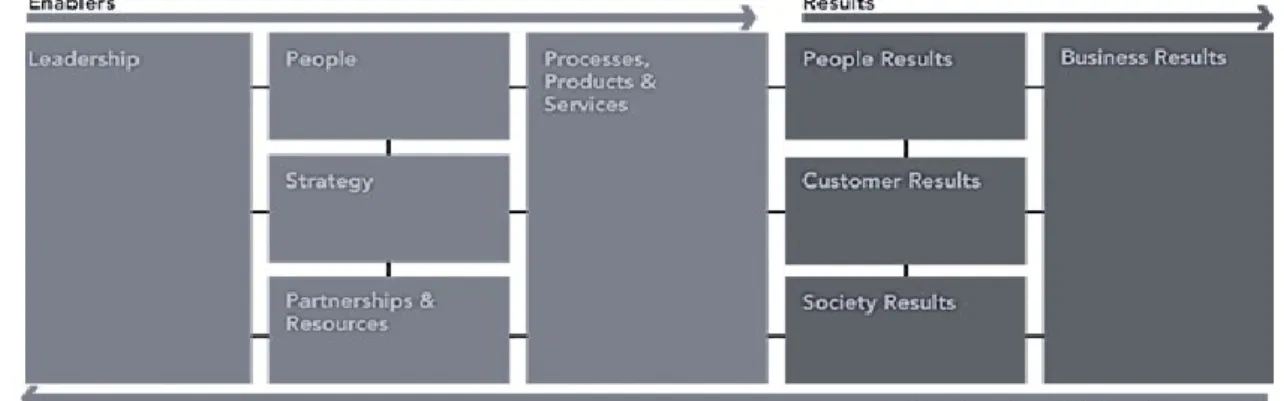
The European Foundation for Quality Management (EFQM) (http://www.efqm.org/the-efqm-excellence-model) framework is an internationally recognized European quality award that allows the understanding of cause-effect relationship between what the organization is doing and its results. It provides a tool for assessing how effective is the organization in developing and delivering a stakeholder focused strategy, as the model is at its simplest level, a cause and effect diagram.
Figure 6: EFQM Excellence Model adapted from an overview of the EFQM Excellence model
The model (Figure 6) is based on nine criteria and these are split between 5 enablers and 4 results. The enabler criteria cover what the organization does and how it does it, while the results criteria cover what the organization achieves. The enablers are composed by leadership, people, strategy, partnerships & resources and processes, products & services. The results are composed of business results, people results, customer results and society results. In addition, the models show that learning, creativity and innovation helps improving the enablers, which leads to an improvement in the results.
Just like the PRISM framework, the EFQM framework assists management teams identify potential performance improvements, in this case in 9 perspectives. Once the potential improvement key points are identified, improvement is assessed by using KPIs. The data are collect using different tools as People and Customer Surveys, 360º Appraisal or Assessments.
11
The Malcolm Baldrige National Quality Award (Baldrige National Quality Program – www.quality.nist.gov) framework is the American counterpart of the EFQM quality award. Created in 1987 by the U.S Commerce Department as a standard of excellence to help U.S. organizations, the Malcolm framework can be used to help increase performance in any organization by providing a framework that helps to assess performance on a wide range of indicators: customer, product and service, financial, human resource, and operational. The criteria are built upon a set of interrelated core values embodied in seven linked categories (Figure 7).
Figure 7: Malcolm Baldrige Model framework adapted from www.quality.nist.gov The seven categories that make up the award criteria are:
• Leadership: examines how executives guide and sustain the organization and how the organization addresses governance, ethical, legal and community responsibilities;
4 Measurement, Analysis and Knowledge Management 6 Operation focus 5 Workforce focus 1 Leadership 2 Strategic Planning 3 Customer Focus 7 Results Organization Profile:
12
• Strategic planning: examines how the organization sets strategic directions and how it determines and deploys key action plans;
• Customer focus: examines how the organization determines requirements and expectations of customers and markets, builds relationships with customers and acquires, satisfies, and retains customers.
• Measurement, analysis, and knowledge management: examines the management, the use, analysis and improvement of data and information to support key organization processes as well as how the organization reviews its performance;
• Workforce focus: examines how the organization behaves with all those actively involved in accomplishing the work of the organization and how the workforce is aligned with the organization objectives;
• Operation focus: examines aspects of how key production/delivery and support processes are designed, managed and improved.
• Results: examines the organization performance and improvement in the key business area as well as how it performs relative to competitors. Despite being quality awards, both the EFQM and Malcolm frameworks are internationally recognized frameworks used by countless organizations to measure performance. While variations exist (Singapore Quality Award Model, Japan Quality Award Model, Canadian Business Award Model, Australian Business Excellence Framework), these models are all remarkably similar, and therefore to avoid redundancy, will not be explored.
Despite all work done, some of the literature has neglected the nature of services in performance measurement. Grassano & Savona (2014) conclude that “most of the literature has for long time studied services using analytical and empirical tools developed for analysis in the manufacturing sector, often without tailoring them on the peculiarities of services”. But not all frameworks disregard this.
13
The Performance Measurement System for Service Industries (PMSSI), developed by (Fitzgerald et al., 1991), from the Chartered Institute of Management Accountants research project focused on service business in the UK. It recognizes the nature of services, as intangibility, perishability, heterogeneity and the implications this has for performance measurement. Based in operations management, service quality, marketing and accounting this model identifies across two categories six dimensions of performance, and for each dimension, it goes one step further by identifying KPIs. These dimensions and types of measures can be identified in the Table 2.
Table 2: Dimensions and measures of the Performance Measurement System for Service Industries adapted from Fitzgerald, Brignall, Johnston, & Silvestro, 1991
Performance dimensions Types of measures Results Competitiveness
Financial Performance
Relative market share and position Sales growth
Measures of the customer base Profitability
Liquidity Capital structure Market ratios Determinants Quality of service
Flexibility
Resource utilization
Innovation
Reliability, responsiveness, aesthetics/appearance, cleanliness/tidiness, comfort, friendliness,
communication, courtesy, competence, access, availability, security
Volume flexibility Delivery speed flexibility Specification flexibility Productivity
Efficiency
Performance of the innovation process Performance of individual innovators
14
Another framework adapted to the specificity of the services is the framework SERVQUAL, a service quality framework developed by Parasuraman et al., (1985, 1986, 1988, 1991, 1993, 1994) and Zeithaml et al., (1990) aiming at measuring the scale of quality in the service sectors. The model measures 5 aspects of service quality:
• Responsiveness – willingness to help customers and provide prompt service;
• Assurance – knowledge and courtesy of employees and their ability to convey trust and confidence;
• Tangibles – Appearance of physical facilities, equipment, personnel, and communication materials;
• Empathy – caring, individualized attention the firm provides its customers;
• Reliability – Ability to perform the promised service dependably and accurately.
The performance across the five dimensions can be measured through the SERVQUAL instrument, which is compiled by 22 statements (appendix 1). With the data compiled, managers can then measure quality performance improvement through KPIs previously established.
1.2.2 Country Performance Frameworks
While there is an identifiable increase tendency in the academic community to publish the topic of performance measurement in organizations (A. Neely, 2005), frameworks to measure performance in countries also start to be proposed.
The Global Innovation Index (GII), developed co-jointly by the Cornell University, INSEAD, and the World Intellectual Property Organization in 2007, ranks the countries and enables a comparinson in terms of innovation. It adopts the notion of innovation originally elaborated in the Oslo Manual “An innovation
15
is the implementation of a new or significantly improved product (good or service), a new process, a new marketing method, or a new organizational method in business practices, workplace organization, or external relations”.
It is an evolving project that uses the previous editions incorporating newly available data. The 2016 edition model included 128 countries/economies. The model framework, presented in Figure 8, relies on two sub-indices, (i) the Innovation Input Sub-Index, which is built around the pillars Institution, Human capital and research, Infrastructure, Market sophistication and Business sophistication, and the (ii) Innovation Output Sub-Index, which is built around the pillars Knowledge and technology output and Creative output. Four measures are calculated (Johnson Cornell, INSEAD, & WIPO, 2016):
• Innovation Input Sub-Index: Five input pillars capture elements of the national economy that enable innovative activities (Institutions, Human capital and research, Infrastructure, Market sophistication, Business sophistication).
• Innovation Output Sub-Index: Innovation outputs are the results of innovative activities within the economy (Knowledge and technology outputs, and Creative outputs).
• The overall GII score is the simple average of the Input and Output Sub-Indices.
• The Innovation Efficiency Ratio is the ratio of the Output Sub-Index to the Input Sub- Index. It shows how much innovation output a given country is getting for its inputs.
Each pillar is divided into three sub-pillars, each of which is composed of individual indicators, for a total of 82 indicators (appendix 2).
16
Figure 8: GII framework (Johnson Cornell et al., 2016)
Another country performance framework, the Global Competitiveness Report (Schwab, et al. 2016) is published annually by the World Economic Forum and assesses the country performance in terms of competitiveness. It measures 138 economies and is composed by 12 pillars, organized in three sub-indices, as shown in Figure 9: basic requirements, efficiency enhancers, and innovation and sophistication factors. The weight assigned to each sub-index depends on the stage of development of each subject economy. The rank is obtained by converting each indicator into a 1 to 7 scale.
17
Figure 9:The Global Competitiveness Index framework
After that, the indicators are aggregated according to their corresponding pillar and an arithmetic mean is calculated, where each level is weighted to calculate the next level score, up until its aggregated into a final overall score. The economies are then ranked according to their respective overall individual scores.
The Global Competitiveness Report framework structure can be seen in appendix 3.
Developed in 2016 by the World State of Quality, the European Quality Scoreboard (EQS) (http://wsq.dps.uminho.pt/eqs_framework.html) aims to assess the performance of several dimensions related to quality, having the first edition evaluated 28 European Union countries.
The model uses up to date available data and is divided in two axes: enablers and results. Each axis is composed by 5 dimensions, making a total of 10 as presented in Table 3. Each dimension is assessed by more than one indicator, in a total of 21. A final score is calculated for each country considering the average
18
weight of the ranking position obtained by each country over the set of 21 indicators considered, which are presented in the following table:
Table 3: Dimensions and indicators of the EQS adapted from European Quality Scoreboard
Enablers Results
Dimensions Indicators Dimensions Indicators
Organizations
ISO 9001 Certified Organizations
Competitiveness
Global Competitiveness Index Organizations Recognized
by Quality Awards
Gross Domestic Product
Professionals
International Academy for Quality Members
Social Cohesion
Gini Index
Qualified Quality Professionals
People at Risk of Poverty and Social Exclusion
Research
Indexed Quality Papers Published
Sustainability
Environmental Wellbeing Results
Universities in International Research Rankings
Ecological Footprint
Education
Indexed Quality Papers Published
Innovation and Entrepreneurship
Global innovation Index Universities in
International Research Rankings
Ease of Doing Business Results
Health
Healthy Life Expectancy
Satisfaction
Quality of Life At Birth Mortality Rates Job Satisfaction
Unemployment Rate
The European Innovation Scoreboard (EIS) is an annually published report by the European Union and provides a comparative analysis of innovation performance in EU countries, other European countries and regional neighbours. The measurement framework identifies four main types of groups and ten innovation dimensions, as seen on Figure 10.
19
Figure 10: EIS measurement framework groups and dimensions (European Innovation Scoreboard 2017, p.8) These 10 dimensions are measured through 27 different indicators, which are presented in appendix 4. The EIS measures the EU national innovation systems through an unweighted average of the 27 indicators.
1.2.3 Literature Review Summary
Despite the existence of many adaptations of frameworks for organizations in specific sectors, like education (Karathanos & Karathanos, 2005) or health care (Zelman et al., 2003), which can be explained by the diversity of the service industry, as Layton & Moore (1989) concluded “since the service industries themselves are a diverse group, indicators for different industries within the sector should be usefull”. To our knowledge, no specific framework has been developed to measure sector performance, leaving a gap in the literature of performance measurement in terms of scope of analysis (organization, sector, country). The reviewed frameworks were organized in the following Table 4 according to the focus of measurement, organization or country. The
Framework conditions
Investments
Innovation activities
Impacts
Human resources
Attractive research systems Innovation-friendly Finance and support Firm investments Innovators Linkages Intellectual assets Employment impacts Sales impacts
20
organization frameworks are frameworks that aim to help in the measurement of organizations performance, while the country frameworks aim to measure country performance.
Table 4: Literature review collected models
Organizational Performance Frameworks Country Performance Frameworks Performance Measurement Matrix (PMM) Global Innovation Index (GII)
Strategic Measurement Analysis and Reporting
Technique (SMART) Global Competitiveness Report (GCR)
Balance Scorecard (BSC) European Quality Scoreboard (EQS)
Performance Prism (Prism) European Innovation Scoreboard 2015 (EIS)
OSLO Manual
COTEC Innovation Scoring (CIS)
European Foundation for Quality Management (EFQM)
Malcolm Baldrige National Quality Award (Malcolm)
Performance Measurement System for Service Industries (PMSSI)
21
Chapter 2: Frameworks Overview
In the previews chapter we reviewed different performance measurement frameworks used to measure organizations and countries’ performance. As a first step, each framework category, criteria, dimensions and subdimensions was fully explored to understand what was measured in each framework. Despite the differences between them, some similarities, in terms of dimensions used, are consistent throughout the frameworks, with different frameworks analyzing the same dimensions but giving them different names (for example the dimension “market” analyzed by the SMART and CIS framework is named “competitiveness” in the PMSSI framework). In order to smooth the analysis and avoid redundancy, we decided to group those into common dimensions. All the thought behind the process is described in Annex 1.
We categorized dimensions into three major intertwined categories, as shown in Figure 11: Context, Enablers and Results. This separation of dimensions in categories is supported by the literature in the EFQM, Malcolm, PMSSI and EQS frameworks.
Figure 11: Grouped dimensions categories: context, enablers and results
Enablers Results
22
2.1 Organizational Performance Frameworks Overview
According to Neely et al., (1997) it is important, for both the designer and the user, to define the measures themselves. In this line of reasoning it also becomes important to define the dimensions and categories. Starting with the analysis of the organizational performance frameworks, 14 dimensions of assessment were identified, defined and categorized. These dimensions are presented in Table 5. Table 5: Organizational performance frameworks dimensions
Category Dimensions/
Frameworks SMART BSC Prism
Oslo
Manual CIS EFQM Malcolm PMSSI SERVQUAL Total
Context Context X X X 3 Enablers Capabilities X X X X X 5 Leadership X X X 3 Strategy X X X X X 5 Stakeholders X X X 3 Results Customer Satisfaction X X X X X X 6 Efficiency X X X 3 Financial X X X X X X 6 Innovation X X X X X 5 Market X X X X 4 Processes X X X X X X X 7 Productivity X X X 3 Quality X 1 Sustainability X X 2 Total 8 7 4 2 9 8 10 7 1 -
SMART- Strategic Measurement Analysis and Reporting Technique; BSC- Balance Scorecard; Prism- Performance Prism; CIS- COTEC Innovation Scoring; EFQM- European Foundation for Quality Management; Malcolm- Malcolm Baldrige National Quality Award; PMSSI- Performance Measurement System for Service Industries
The category Context can be defined as the category formed by the dimensions that are responsible for the measurement of the environment in which the object of assessment (organization, sector or country) is being evaluated. In this category, the only dimensions identified in the reviewed literature is the Context dimension itself. Proposed by the Oslo Manual, CIS and Malcolm frameworks, it tries to measure the environment in which the organization is settled. These
23
factors are outside of the range of action of the organization, but due to the high impact and influence in its performance, consideration must be taken upon.
The category Enablers can be defined as the category formed by the set of dimensions that empower the agent of assessment into achieving results. In the reviewed literature, several dimensions can be categorized as Enabler dimensions:
• The dimension Capabilities is proposed in the BSC, Prism, CIS, EFQM and Malcolm frameworks and measures the ability of the organization in using its workforce, know-how or skills and technology to achieve the organization goals. Capabilities can be defined as the set of workforce, know-how, skills and technology used by an organization in its productive process;
• The dimension Leadership, proposed in the CIS, EFQM and Malcolm frameworks, measures the performance of the leadership inside the organization, how management leads the organization and act as role values. Leadership can be defined as the ability of leading the organization;
• The dimension Strategy, proposed by the Prism, SMART, CIS, EFQM and Malcolm frameworks, measures how the organization plans and establishes its strategic directions. Strategy can be defined as the organization ability in implementing plans of action and implementing its mission and vision;
• The dimension Stakeholders, proposed by the Prism, EFQM and Malcolm frameworks, measures how the organization manages stakeholders, like external partnerships or suppliers, in order to support the operating process. Stakeholders can be defined as the group of entities with interest and/or concern in the organization.
24
The category Results can be defined as the category formed by the set of dimensions that assess the outcome of the agent. In the reviewed literature, several dimensions can be grouped into the results’ dimension:
• The Customer Satisfaction dimension, proposed by the BSC, SMART, EFQM, Malcolm, PMSSI and SERVQUAL frameworks, tries to measure how customers perceive the goods and/or services acquired to the organization. Customer satisfaction can be defined as the degree of satisfaction of the provided goods and/or service of the organization by the customer;
• The Efficiency dimension, proposed in the BSC, SMART, PMSSI frameworks, measures the organization ability in utilizing its resource in its daily activity, comparing what was produced with what could have been produced with the same amount of resources. The efficiency dimension can be defined as the aptitude of the organization in functioning and producing in the best possible manner with the least waste of resources;
• The Financial dimension, proposed in the BSC, SMART, CIS, EFQM, Malcolm and PMSSI frameworks, measures the financial business results that the organization achieved, that is, the economic performance of the organization, in accounting terms;
• The Innovation dimension, proposed by the BSC, Oslo Manual, CIS, EFQM and PMSSI frameworks, measures the ability of the organization in generating new knowledge, translating an invention or idea into new product, service or process that creates value which the customer is willing to pay. Innovation dimension can be defined as the ability of the organization in generating new methods, ideas, products or processes; • The Market dimension, proposed in the SMART, CIS, Malcolm and PMSSI
25
competitors. The market dimensions can be defined as the capacity of the organization in surpassing its competitors;
• The Process dimension, proposed in the BSC, Prism, SMART, EFQM, Malcolm and PMSSI frameworks, measures how the organization conducts its continuous actions or operations with the aim of producing their products and/or services. It includes parameters like flexibility, delivery or cycle time. The process dimension can be defined as the ability of the organization in conducting their production operations;
• The Productivity dimension, proposed by the BSC, SMART and PMSSI frameworks, measures how productive the organization is. In other words, it measures the division of average output per period by the total costs incurred or resources consumed in that same period. The productivity dimension can be defined as the effectiveness of the organization and its productive effort in terms of the rate of output it produces per unit of input it consumes;
• The dimension Quality, proposed in the SMART framework, is a measure of excellence or a state of being free of defects and/or deficiencies. This dimension is linked to the Customer Satisfaction dimension, since the number of defect an organization produces has a direct impact on their customer satisfaction. The quality dimension can be defined as the organization aptitude of producing to certain standards, conformance to requirements and freedom from defects;
• The sustainability dimension can be divided into the sub-dimensions social responsibility and environment sustainability. Social responsibility can be defined as the idea that business should balance profit-making activities with activities that benefit the society, while environment sustainability can be defined as the restructuration of the organization actions to avoid depletion of the natural resources and to maintain an
26
ecological balance. The sustainability dimension, proposed in the CIS and Malcolm frameworks, measures how the organization actions affect the society and environment in which the organization is inserted.
2.2 Country Performance Framework Overview
The same process of analysis, done to the organizational performance frameworks, was applied to the country performance frameworks. From the various frameworks analyzed, 15 dimensions of assessment were identified, defined and categorized. These dimensions are presented in Table 6.
Table 6: Country performance frameworks dimensions Category Dimensions/
Frameworks GII GCR EQS EIS Total
Context Internal Context X X 2
Enablers Education X X X 3 Financing X X 2 Health X X 2 Infrastructure X X X 3 Investment X X 2 Labour Market X X X 3 Market X X 2 Research X X X 3 Results Competitiveness X X 2 Innovation X X X X 4 Quality X 1 Satisfaction X 1 Sustainability X X Outputs X X 2 Total 9 9 10 6 -
GII- Global Innovation Index; GCR- Global Competitiveness Report; EQS- European Quality Scoreboard; EIS- European Innovation Scoreboard
As previously defined, the category Context is formed by the dimensions that are responsible for the measure of the environment in which the agent of assessment is been evaluated. In this category, the only dimension identified in the reviewed literature is the Internal Context dimension. Measured by the GII
27
and GCR frameworks, it tries to measure the internal environment of the country, formed by the internal political, regulatory and business and economical environment.
The category Enablers can be defined as the category formed by the set of dimensions that empower the agent of assessment into achieving results. In the reviewed literature of country performance measurement, several dimensions, related to the country performance frameworks, can be categorized as enabler dimensions:
• The Education dimension, proposed in the GII, GCR, EQS and EIS frameworks, measures the level of education and training in the country, from education enrollment rate to school life expectancy or even expenditure on education. This dimension can be defined as the ability of the country in educating its citizens;
• The Financing dimension, proposed in the GII and GCR frameworks, measures the access to credit inside the country, from the ease of access to loans, to affordability of financial services and venture capital availability. This dimension can be defined as the capacity of financing entities inside the country;
• The Health dimension, proposed in the GCR and EQS frameworks, measures the health condition inside the country, from healthy life expectancy to infant mortality or HIV prevalence. This dimension can be defined as the state of health of the people living inside the country; • The Infrastructure dimension, proposed in the GII, GCR and EIS
frameworks, measures the access inside of the country to infastructures, like electricity, broadband, roads, and so on. This dimension can be defined as the state of infrastructures the country possesses;
28
• The Investment dimension, proposed in the GII and EIS frameworks, measures the investment captured. This dimension can be defined as the ability of the country of gathering investment;
• The Labour Market dimension, proposed in the GCR, EQS and EIS frameworks, measures the labour efficiency and employment impacts in the country. This dimension can be defined as the state of working force inside the country;
• The Market dimension, proposed in the GII and GCR frameworks, measures the trade, competition and market scale in the country. This dimension can be defined as the state of the market inside the country; • The Research dimension, proposed in the GII, EQS and EIS frameworks,
measures the research undertaken, from published papers and international scientific co-publications to number of researchers and gross expenditure on R&D. This dimension can be defined as the ability of the country to perform research.
The category Results can be defined as the category formed by the set of dimensions that assess the outcome of the agent. In the reviewed literature of country performance measurement, several dimensions can be categorized as results:
• The Competitiveness dimension, proposed in the GCR, and EQS frameworks, measures the set of institutions, policies and factors that determine the level of productivity of an economy. This dimension can be defined as the level of productivity of the country;
• The Innovation dimension, proposed in the GII, GCR, EQS and EIS frameworks, measures the ability of the country in generating new knowledge, technology or intellectual assets. This dimension can be defined as the ability of the country to innovate;
29
• The Quality dimension, proposed in the EQS framework, measures quality through several related dimensions. This dimension can be defined as the aptitude of the country to maintain certain standards and conformances;
• The Satisfaction dimension, proposed in the EQS framework, measures the satisfaction of the people living inside the country, like the quality of life or job satisfaction. This dimension can be defined as the degree of satisfaction of the country residents;
• The Sustainability dimension can be divided into the sub-dimensions social cohesion, proposed in the EQS framework, and environment sustainability, proposed in the GII and EQS frameworks. Social cohesion can be defined as the effort of the country in working toward the well being of all its citizens, while environment sustainability can be defined as the ability of the country to a certain level of environment performance and maintain its ecological footprint. The sustainability dimension can be defined as the ability of the country to grant a minimum level of well being to its citizens and environmental performance;
• The Outputs dimension, proposed in the EQS and EIS frameworks, measures outputs from the country, like gross domestic product or exports and sales.
2.3 Overview
As a result of the completed frameworks overview, some relevant findings emerge for the construction of our sector performance measurement framework. While some organization dimensions focus on the aspects of the organization (Stakeholders, Leadership, Strategies, Products and Services or Customer Satisfaction), they are not applicable once we broaden the analysis scope from
30
organizations to countries. This is a result of the change of the subject of measurement. This means, although some dimensions are used to measure performance independently of the level of scope, others are only applicable in specific levels, resulting in a need to adapt the dimensions when measuring performance. Despite this fact, other dimensions seem to be common across the various levels of scope, although they may be included into different categories (for example, the dimension Market exists in the organizational performance frameworks as a Result dimension but it’s an Enabler dimension in the countryperformance frameworks). The Table 7 shows the dimensions used, across the organizational and country performance frameworks, organized.
Table 7: Organization and country frameworks dimensions comparison
Organization Frameworks Country Frameworks
Category Dimensions Dimensions
Context Context Internal Context
Enablers
Leadership Strategy Stakeholders
Capabilities Labour Market
Education Financing Health Infrastructure Investment Market Research Results
Customer Satisfaction Satisfaction
Financial Outputs Innovation Innovation Market Processes Efficiency Productivity Competitiveness Quality Quality Sustainability Sustainability
31
When comparing the few service specific frameworks (PMSSI and SERVQUAL frameworks) with the other organization performance measurement frameworks, a distinction in the emphasis on the measurement of capabilities is also found. While the PMSSI framework emphasizes the utilization of the capabilities needed (through the use of measures in productivity and efficiency) the other frameworks emphasize the measure in the capabilities themselves. This might be explained due to the intangible nature of services.
While organization models try to grasp as many dimensions as possible to assess organization performance, country performance models try to explore to the fullest one specific dimension (innovation, quality or competitiveness). Despite measuring a single dimension, like innovation or quality, by analyzing the frameworks a better understanding of the components used to measure those dimensions was possible to achieve. Also, while organization frameworks analyse the organization internally, with information collected mainly inside the organization, performing benchmarking with themselves from period to period, country frameworks perform benchmark between a set of countries in the same period of time.
Finally, there seems to be a shift in the paradigm of the frameworks, and few of the most recent ones have been introducing sustainability as an additional dimension (COTEC Innovation Scoring, Malcolm, European Quality Scoreboard and Global Innovation Index).
32
Chapter 3: Proposing CER: a new framework
3.1 Framework Objective
The objective of the Context, Enabler and Result (CER) framework, developed in this thesis, is to elaborate a performance measurement tool that allows measuring and evaluating the performance of service sectors. This performance measurement is done across 11 different dimensions, allowing organizations to benchmark their performance within their operating sector.
When proposing this new framework, product of the reviewed literature, some considerations were made:
• Some dimensions are not applicable to all levels of scope;
• Other dimensions are applicable across different levels of scope but can be sorted into different categories;
• The number of dimensions can be subject of change depending on the level of scope. Even so, when analyzing a single dimenson multiple components can be analyzed to gather data;
• The type of data can be different, changing from time series data, (collected in organization frameworks - a collection of observations for a single entity over time), to cross-sectional data (collected in country frameworks - a collection of observations for multiple entities at a single point in time);
• Dimensions can have different importance in different service sectors, and therefore, different weights. For this thesis, we assume that they are of equal importance and contribution.
The framework allows the comparison between the sector average performance and the organizations performance, producing important information relating to the performance state in each of the different assessed
33
dimensions. In order to do it, the framework that is first presented in a broad way, is then adapted to the specificities of a certain service sector, which in this case, is the Portuguese retail sector of supermarkets and hypermarkets (classified according to the Portuguese CEA, classification of economic activity, 47111) was chosen and its performance analyzed.
3.2 Conceptual measurement framework
The CER framework is applied specifically to service sectors, calculating different variables across 11 dimensions imbedded in the 3 categories: context, enablers and results (Figure 12).
Figure 12: CER dimensions framework
Enablers Results Context: Industry Labour Force Financing Infrastructure Investment Efficiency and Productivity Processes Financial Sustainability Quality Innovation
34
Context
The category Context measures the dimension industry, which represents the internal environment of the sector. This is a specific dimension, unlike the others, since it is the only exogenous dimension in the framework. This means the indicators presented in this dimension are relative to the sector in question, and as such, are not managed by the companies. Despite that, it provides usefull information regarding the state of the sector. It is measured through the following 8 indicators:
• Number of companies: this indicator represents the total number of companies working in the specific sector during each year t:
𝑁º 𝑜𝑓 𝑐𝑜𝑚𝑝𝑎𝑛𝑖𝑒𝑠 𝑡
= 𝑡𝑜𝑡𝑎𝑙 𝑛𝑢𝑚𝑏𝑒𝑟 𝑜𝑓 𝑐𝑜𝑚𝑝𝑎𝑛𝑖𝑒𝑠 𝑜𝑝𝑒𝑟𝑎𝑡𝑖𝑛𝑔 𝑖𝑛 𝑡ℎ𝑒 𝑠𝑒𝑐𝑡𝑜𝑟 𝑖𝑛 𝑡 • Entry of new companies: this indicator shows the variation (in %) of
new companies that entered the sector each year in comparison to the previous year:
𝐸𝑛𝑡𝑟𝑦 𝑜𝑓 𝑛𝑒𝑤 𝑐𝑜𝑚𝑝𝑎𝑛𝑖𝑒𝑠
=𝑡𝑜𝑡𝑎𝑙 𝑛𝑢𝑚𝑏𝑒𝑟 𝑜𝑓 𝑛𝑒𝑤 𝑐𝑜𝑚𝑝𝑎𝑛𝑖𝑒𝑠 𝑜𝑝𝑒𝑟𝑎𝑡𝑖𝑛𝑔 𝑖𝑛 𝑡ℎ𝑒 𝑠𝑒𝑐𝑡𝑜𝑟 𝑖𝑛 𝑡 𝑡𝑜𝑡𝑎𝑙 𝑛𝑢𝑚𝑏𝑒𝑟 𝑜𝑓 𝑐𝑜𝑚𝑝𝑎𝑛𝑖𝑒𝑠 𝑜𝑝𝑒𝑟𝑎𝑡𝑖𝑛𝑔 𝑖𝑛 𝑡ℎ𝑒 𝑠𝑒𝑐𝑡𝑜𝑟 𝑖𝑛 𝑡 − 1 𝑥100 • Exit of companies:this indicator shows the number of companies (in %)
that ceased operations in the sector each year in comparison to the previous year:
𝐸𝑥𝑖𝑡 𝑜𝑓 𝑛𝑒𝑤 𝑐𝑜𝑚𝑝𝑎𝑛𝑖𝑒𝑠
= 𝑡𝑜𝑡𝑎𝑙 𝑛𝑢𝑚𝑏𝑒𝑟 𝑜𝑓 𝑐𝑜𝑚𝑝𝑎𝑛𝑖𝑒𝑠 𝑡ℎ𝑎𝑡 𝑐𝑒𝑎𝑠𝑒𝑑 𝑜𝑝𝑒𝑟𝑎𝑡𝑖𝑜𝑛𝑠 𝑖𝑛 𝑡ℎ𝑒 𝑠𝑒𝑐𝑡𝑜𝑟 𝑖𝑛 𝑡
35
• Sector weight: this indicator shows the weight of the sector for each year by using the ratio between the sector Gross Value Added (GVA) and the country Gross Domestic Product (GDP):
𝑆𝑒𝑐𝑡𝑜𝑟 𝑊𝑒𝑖𝑔ℎ𝑡 = 𝑆𝑒𝑐𝑡𝑜𝑟 𝐺𝑉𝐴 𝑖𝑛 𝑡 𝐺𝐷𝑃 𝑖𝑛 𝑡
• Regulation: this is a binary indicator that gives the information if the sector is regulated by a third party, taking the value 1 if it is regulated or 0 if it is not;
• Capital intensity: this indicator represents if the sector is capital or labour intensive and one way of calculating it is through the ratio of fixed assets by labour. The higher the value, the more Capital intensive the sector is:
𝐶𝑎𝑝𝑖𝑡𝑎𝑙 𝐼𝑛𝑡𝑒𝑛𝑠𝑖𝑡𝑦 = ∑ 𝐹𝑖𝑥𝑒𝑑 𝑎𝑠𝑠𝑒𝑡𝑠 𝑝𝑒𝑟 𝑐𝑜𝑚𝑝𝑎𝑛𝑦 𝑜𝑓 𝑡ℎ𝑒 𝑠𝑒𝑐𝑡𝑜𝑟 𝑖𝑛 𝑡 ∑ 𝑃𝑒𝑟𝑠𝑜𝑛𝑛𝑒𝑙 𝐶𝑜𝑠𝑡 𝑝𝑒𝑟 𝑐𝑜𝑚𝑝𝑎𝑛𝑦 𝑜𝑓 𝑡ℎ𝑒 𝑠𝑒𝑐𝑡𝑜𝑟 𝑖𝑛 𝑡 • Employment rate: this indicator represents the percentage of people
employed regarding the total active population;
𝐸𝑚𝑝𝑙𝑜𝑦𝑚𝑒𝑛𝑡 𝑅𝑎𝑡𝑒 = 𝑇𝑜𝑡𝑎𝑙 𝑆𝑒𝑐𝑡𝑜𝑟 𝑊𝑜𝑟𝑘𝑓𝑜𝑟𝑐𝑒 𝐸𝑚𝑝𝑙𝑜𝑦𝑒𝑑 𝑖𝑛 𝑡 𝐸𝑐𝑜𝑛𝑜𝑚𝑖𝑐𝑎𝑙𝑙𝑦 𝐴𝑐𝑡𝑖𝑣𝑒 𝑃𝑜𝑝𝑢𝑙𝑎𝑡𝑖𝑜𝑛 𝑖𝑛 𝑡
• Dispersion of Earnings: this indicator represents how disperse are the earnings in the sector by measuring which % of companies in the sector hold 80% of the earnings. A high value on dispersion of earnings means the sector earnings are split across the companies in a more evenly way while a low value means few companies control most of the sector earnings.
36
By calculating these indicators, an understanding of the sector can be grasped since they reflect the competition of the industry: how many companies exist operating in the sector, if it is a stable or unstable sector with high entrance and/or exit of companies, if it is an important sector in the country economy, if it is regulated, if it is an intensive labour or capital sector as well as if there is too much dispersion in the earnings with few companies earning much of the sector or is spreaded across multiple companies.
Enablers
On the other way, the categories Enablers and Results are composed by dimensions and indicators in which organizations have direct control and effect. The category Enablers is formed by a set of 4 dimensions that empower the organizations in the sector into achieving results:
1. Investment
The Investment dimension measures the degree of investment the sector has undergone, and it is measured through the following 2 indicators:
o Average gross expenditure on R&D: this indicator represents the average amount invested in research and development by each company in the sector and it is calculated by the ratio of the sum of the total gross expenditure on R&D of each company in the sector with the total number of companies in that sector:
𝐴𝑣𝑒𝑟𝑎𝑔𝑒 𝑔𝑟𝑜𝑠𝑠 𝑒𝑥𝑝𝑒𝑛𝑑𝑖𝑡𝑢𝑟𝑒 𝑜𝑛 𝑅&𝐷
= ∑ 𝐺𝑟𝑜𝑠𝑠 𝐸𝑥𝑝𝑒𝑛𝑑𝑖𝑡𝑢𝑟𝑒 𝑜𝑛 𝑅&𝐷 𝑜𝑓 𝑒𝑎𝑐ℎ 𝑐𝑜𝑚𝑝𝑎𝑛𝑦 𝑖𝑛 𝑡 𝑁º 𝑐𝑜𝑚𝑝𝑎𝑛𝑖𝑒𝑠 𝑖𝑛 𝑡
37
o Degree of investment: this indicator is calculated by the ratio of the sum of the total investment of each company in the sector with the sum of the net income of each company:
𝐷𝑒𝑔𝑟𝑒𝑒 𝑜𝑓 𝑖𝑛𝑣𝑒𝑠𝑡𝑚𝑒𝑛𝑡
=∑ 𝑓𝑖𝑛𝑎𝑛𝑐𝑖𝑎𝑙 𝑖𝑛𝑣𝑒𝑠𝑡𝑚𝑒𝑛𝑡 𝑜𝑓 𝑒𝑎𝑐ℎ 𝑐𝑜𝑚𝑝𝑎𝑛𝑦 𝑖𝑛 𝑡 ∑ 𝑛𝑒𝑡 𝑖𝑛𝑐𝑜𝑚𝑒 𝑜𝑓 𝑒𝑎𝑐ℎ 𝑐𝑜𝑚𝑝𝑎𝑛𝑦 𝑖𝑛 𝑡
2. Infrastructure
The Infrastructure dimension measures the number and state of the vital infrastructures in which the sector relies, and it is measured through these 7 indicators:
o Average number of point of sales per company: this indicator is calculated by the sum of total number of points of sales of each company in the sector divided by the total number of companies in that sector:
𝐴𝑣𝑔 𝑛º 𝑜𝑓 𝑝𝑜𝑖𝑛𝑡 𝑜𝑓 𝑠𝑎𝑙𝑒𝑠
= ∑ 𝑡𝑜𝑡𝑎𝑙 𝑛𝑢𝑚𝑏𝑒𝑟 𝑜𝑓 𝑝𝑜𝑖𝑛𝑡 𝑜𝑓 𝑠𝑎𝑙𝑒𝑠 𝑝𝑒𝑟 𝑐𝑜𝑚𝑝𝑎𝑛𝑦 𝑜𝑝𝑒𝑟𝑎𝑡𝑖𝑛𝑔 𝑖𝑛 𝑡ℎ𝑒 𝑠𝑒𝑐𝑡𝑜𝑟 𝑖𝑛 𝑡 𝑁º 𝑜𝑓 𝑐𝑜𝑚𝑝𝑎𝑛𝑖𝑒𝑠 𝑖𝑛 𝑡
o Average number of new points of sales per company: this indicator represents in average, how many new points of sales were created by each company and it is represented by the sum of total number of new points of sales of each company divided by the total number of companies in that sector:
𝐴𝑣𝑔 𝑛º 𝑜𝑓 𝑛𝑒𝑤 𝑝𝑜𝑖𝑛𝑡𝑠 𝑜𝑓 𝑠𝑎𝑙𝑒
= ∑ 𝑡𝑜𝑡𝑎𝑙 𝑛𝑢𝑚𝑏𝑒𝑟 𝑜𝑓 𝑛𝑒𝑤 𝑝𝑜𝑖𝑛𝑡 𝑜𝑓 𝑠𝑎𝑙𝑒𝑠 𝑝𝑒𝑟 𝑐𝑜𝑚𝑝𝑎𝑛𝑦 𝑜𝑝𝑒𝑟𝑎𝑡𝑖𝑛𝑔 𝑖𝑛 𝑡ℎ𝑒 𝑠𝑒𝑐𝑡𝑜𝑟 𝑖𝑛 𝑡 𝑁º 𝑜𝑓 𝑐𝑜𝑚𝑝𝑎𝑛𝑖𝑒𝑠 𝑖𝑛 𝑡
38
o Average number of closure of points of sale per company: this indicator represents in average, how many points of sale are closed by each company and it is represented by the sum of total number of closed points of sales of each company divided by the total number of companies in that sector:
𝐴𝑣𝑔 𝑛º 𝑜𝑓 𝑐𝑙𝑜𝑠𝑒𝑑 𝑝𝑜𝑖𝑛𝑡𝑠 𝑜𝑓 𝑠𝑎𝑙𝑒
= ∑ 𝑡𝑜𝑡𝑎𝑙 𝑛𝑢𝑚𝑏𝑒𝑟 𝑜𝑓 𝑐𝑙𝑜𝑠𝑒𝑑 𝑝𝑜𝑖𝑛𝑡 𝑜𝑓 𝑠𝑎𝑙𝑒𝑠 𝑝𝑒𝑟 𝑐𝑜𝑚𝑝𝑎𝑛𝑦 𝑜𝑝𝑒𝑟𝑎𝑡𝑖𝑛𝑔 𝑖𝑛 𝑡ℎ𝑒 𝑠𝑒𝑐𝑡𝑜𝑟 𝑖𝑛 𝑡 𝑁º 𝑜𝑓 𝑐𝑜𝑚𝑝𝑎𝑛𝑖𝑒𝑠 𝑖𝑛 𝑡
o Average size of physical points of sales per company: this indicator is calculated by the sum of the average size of physical points of sales (e.g. in square meters) of each company divided by the total number of companies in that sector;
𝐴𝑣𝑔 𝑠𝑖𝑧𝑒 𝑜𝑓 𝑝ℎ𝑦𝑠𝑖𝑐𝑎𝑙 𝑝𝑜𝑖𝑛𝑡𝑠 𝑜𝑓 𝑠𝑎𝑙𝑒𝑠
= ∑ 𝑎𝑣𝑒𝑟𝑎𝑔𝑒 𝑠𝑖𝑧𝑒 𝑜𝑓 𝑝ℎ𝑦𝑠𝑖𝑐𝑎𝑙 𝑝𝑜𝑖𝑛𝑡𝑠 𝑜𝑓 𝑠𝑎𝑙𝑒 𝑝𝑒𝑟 𝑐𝑜𝑚𝑝𝑎𝑛𝑦 𝑖𝑛 𝑡 𝑁º 𝑜𝑓 𝑐𝑜𝑚𝑝𝑎𝑛𝑖𝑒𝑠 𝑖𝑛 𝑡
o Average cost of 𝑚2 per point of sales per company: this indicator is calculated by the sum of the average of the cost of 𝑚2 per point of sale of each company divided by the total number of companies in that sector:
𝐴𝑣𝑔 𝑐𝑜𝑠𝑡 𝑜𝑓 𝑚2 𝑝𝑒𝑟 𝑝𝑜𝑖𝑛𝑡 𝑜𝑓 𝑠𝑎𝑙𝑒𝑠 𝑝𝑒𝑟 𝑐𝑜𝑚𝑝𝑎𝑛𝑦
= ∑ 𝑎𝑣𝑒𝑟𝑎𝑔𝑒 𝑐𝑜𝑠𝑡 𝑜𝑓 𝑚2 𝑝𝑒𝑟 𝑝𝑜𝑖𝑛𝑡𝑠 𝑜𝑓 𝑠𝑎𝑙𝑒 𝑝𝑒𝑟 𝑐𝑜𝑚𝑝𝑎𝑛𝑦 𝑖𝑛 𝑡 𝑁º 𝑜𝑓 𝑐𝑜𝑚𝑝𝑎𝑛𝑖𝑒𝑠 𝑖𝑛 𝑡
o Online presence: this indicator represents the position of the sector towards the internet market and its calculated by the ratio of the sum of the total online sales of each company with the sum of the total sales of each company in that sector:
𝑂𝑛𝑙𝑖𝑛𝑒 𝑝𝑟𝑒𝑠𝑒𝑛𝑐𝑒 =∑ 𝑜𝑛𝑙𝑖𝑛𝑒 𝑠𝑎𝑙𝑒𝑠 𝑝𝑒𝑟 𝑐𝑜𝑚𝑝𝑎𝑛𝑦 𝑖𝑛 𝑡 ∑ 𝑡𝑜𝑡𝑎𝑙 𝑠𝑎𝑙𝑒𝑠 𝑝𝑒𝑟 𝑐𝑜𝑚𝑝𝑎𝑛𝑦 𝑖𝑛 𝑡