i
An application to Cascais smart city
A FRAMEWORK FOR DASHBOARDING CITY
PERFORMANCE
Guiomar Correia de Matos de Andrade Fernandes
Project Work presented as partial requirement for obtaining
NOVA Information Management School
Instituto Superior de Estatística e Gestão de Informação
Universidade Nova de Lisboa
A FRAMEWORK FOR DASHBOARDING CITY PERFORMANCE: AN
APPLICATION TO CASCAIS SMART CITY
by
Guiomar Correia de Matos de Andrade Fernandes
Project Work presented as partial requirement for obtaining the Master’s degree in Information Management, with a specialization in Knowledge Management and Business Intelligence
Advisor:Professor Doutor Miguel de Castro Neto
Co Advisor: Eng.ª Fátima Trindade Neves
ii
NOVA Information Management School
Instituto Superior de Estatística e Gestão de Informação
Universidade Nova de LisboaA FRAMEWORK FOR DASHBOARDING CITY PERFORMANCE: AN
APPLICATION TO CASCAIS SMART CITY
by
Guiomar Correia de Matos de Andrade Fernandes
Project Work presented as partial requirement for obtaining the Master’s degree in Information Management, with a specialization in Knowledge Management and Business Intelligence
Advisor:Professor Doutor Miguel de Castro Neto
Co Advisor: Eng.ª Fátima Trindade Neves
i
ACKNOWLEDGEMENTS
The time has come for me to express my deep and sincere acknowledgements to everyone which indirectly or directly contributed to this project.
To my family and friends, for all the patience, affection and support during these months. You make everything seem simple and fun. Thank you for making me always happy and for being my motivation.
To my advisors, Professor Miguel Neto and Engª Fátima Neves, for all the help and wise words. Could not have had a better orientation. Thank you for your advices, great contributions, constructive feedback and for all the constant availability.
ii
ABSTRACT
There has been a recent move to open up the data about the cities and transform it in indicators of interest to share with citizens through online, interactive data visualizations, often termed ‘city dashboards’.
This project reflects on the building of dashboards mainly based on open data generated in the smart city context of Cascais.
The main goal of these dashboards is to provide detailed information about city performance and trends, without citizens or the managers of the municipality needing to collect or learn how to handle data. These open data and dashboard initiatives are changing not only the relationship between government and the public, but also the way that the municipality is managed.
The work begins with a literature review composed by a framework describing the characteristics of a smart city followed by an approach about the open data and a perspective about dashboards. Then, a benchmarking is presented as a means to select a series of indicators that can efficiently capture the performance of the smart city. These indicators will feed the dashboards that will permit to see Cascais as visualized facts, changing the way how managers and citizens know their municipality.
The work also identifies the need of a graphic rules manual to follow up in future dashboards in order to achieve coherence in the public share of dashboards by the various departments of Cascais. The project ends with the presentation of a set of key indicators that describe the municipality in several dimensions and with an application case of the constructed dashboards to the open data portal of Cascais.
KEYWORDS
iii
INDEX
1.
Introduction ... 1
1.1. Contextualization... 2
1.2. Study Goals ... 3
1.3. Relevance of the Study ... 3
1.4. Methodology ... 4
2.
Literature review ... 6
2.1. Business Intelligence for Cities ... 6
2.2. Smart City ... 6
2.2.1.
The Smart City Model ... 7
2.2.2.
Smart Cities Worldwide ... 9
2.2.3.
Cascais As Smart City ... 11
2.3. Open Data ... 12
2.3.1.
Cascais Data Portal ... 15
2.4. Dashboards ... 18
2.4.1.
Data Visualization Best Practices ... 18
2.4.2.
Rules to Dashboarding ... 18
2.4.3.
Target and Indicators ... 20
3.
Development ... 22
3.1. Benchmarking ... 22
3.1.1.
Indicators Based on the Benchmarking ... 32
3.1.2.
Other Indicators Of Interest ... 36
3.2. Mockups ... 41
3.3. Graphic Rules Manual... 44
4.
Results... 45
4.1. Performance Dashboards of Cascais ... 45
4.2. Application Case ... 51
4.1. Evaluation of Results ... 57
5.
Conclusions ... 59
5.1. Limitations of the Project ... 60
5.2. Future Work Recommendations ... 61
6.
Bibliography ... 62
7.
Appendix ... 65
iv
LIST OF FIGURES
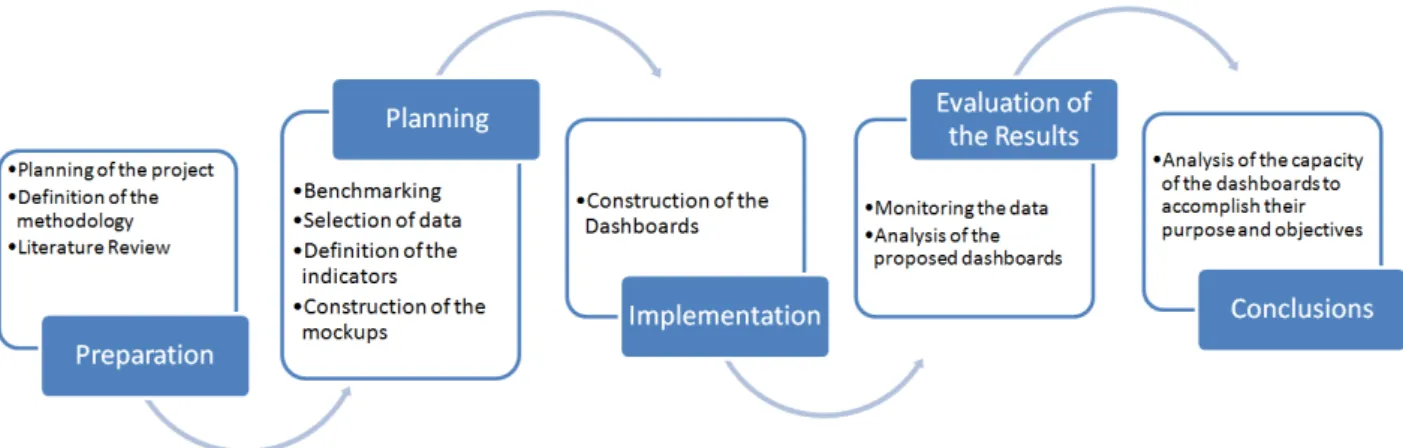
Figure 1.1 - Investigation process used on the project ... 5
Figure 2.1 - Proposed model for smart cities adapted from the proposed by Khatoun &
Zeadally (2016) ... 8
Figure 2.2 - Weighting of each dimension in the sustainability pillars ... 9
Figure 2.3 - The ratio of smart cities to cities across the EU, according to (Manville et al.,
2014) ... 10
Figure 2.4 - The average number of smart city characteristics, according to (Manville et al.,
2014) ... 11
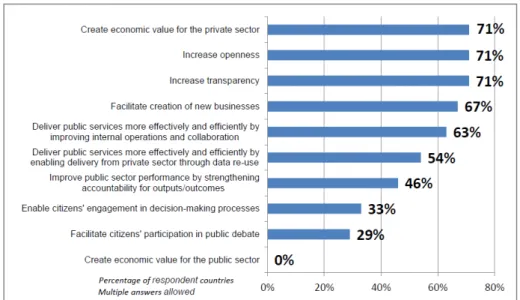
Figure 2.5 - Top 5 principal objectives of the Open Data strategy/policy (OECD, 2015) ... 13
Figure 2.6 - Map with the classification of the EU countries in terms of open data maturity,
retrieved from “Open Data Maturity in Europe 2016” (Carrara, Nieuwenhuis, et al.,
2016) ... 14
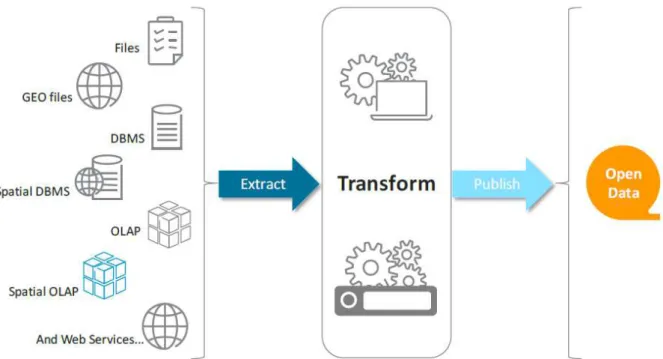
Figure 2.7 - The ETP-
Proces represented in “Open Data Goldbook for Data Managers and
Data Holders” (Carrara, Oudkerk, et al., 2016)
... 15
Figure 2.8 - Homepage of the Cascais Open Data Portal ... 16
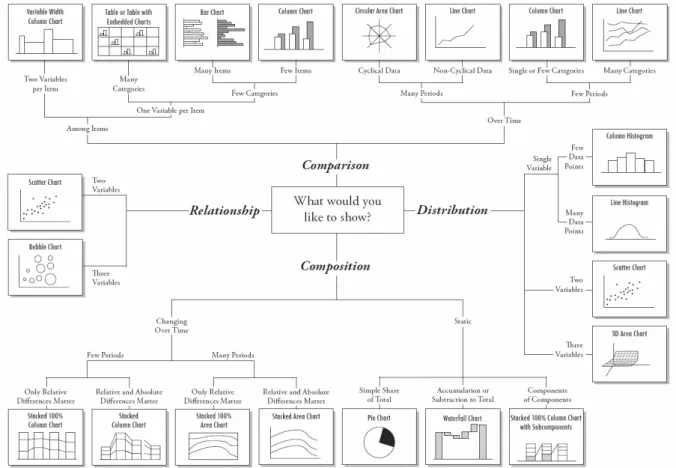
Figure 2.9 - Chart Suggestions by Abela (2009) ... 19
Figure 3.1 - Sydney city dashboard (http://citydashboard.be.unsw.edu.au/) ... 23
Figure 3.2 - Benchmarking process ... 26
Figure 4.1
–
Economic Dashboard ... 47
Figure 4.2
–
Environmental Dashboard ... 48
Figure 4.3
–
Social (Security and demographics) Dashboard ... 49
Figure 4.4
–
Social (Education and others) Dashboard ... 50
Figure 4.5
–
Environment Dashboard of the Application Case ... 52
Figure 4.6
–
Governance (Attendance and Workers) Dashboard of the Application Case ... 53
Figure 4.7 - Governance (Elections and Participatory Budget) Dashboard of the Application
Case ... 54
Figure 4.8 - Education Dashboard of the Application Case... 55
Figure 4.9 - Security Dashboard of the Application Case ... 56
Figure 4.10
–
Example of the Security Dashboard published online with the option to see the
data behind the visualization ... 57
Figure 4.11
–
Example of the data possible to see online during the interaction with the
dashboard (on this case, to the example of the Civil Protection Occurences chart) ... 58
v
LIST OF TABLES
Table 2.1 - Adapted table with the smart city definitions proposed in studies by Albino,
Berardi & Dangelico (2015) and Manville et al. (2014) ... 7
Table 3.1 - Results of the reasearch to the constituents of the benchmarking ... 25
Table 3.2 - Indicators (related to the dimensions under study) that appear in at least three of
the portals under analysis. ... 27
Table 3.3 - Table with the metrics used on the most recurrent indicators on the 10 portals
under analysis ... 31
Table 3.4 - List of the indicators used to construct the first mockups ... 40
Table 3.5 - General visual rules of the dashboard ... 44
Table 7.1
–
Indicators used to measure the performance of each city under analysis ... 70
Table 7.2
–
Indicators used by the Civic Dashboards ... 71
Table 7.3
–
Indicators proposed by ITU-T L.1603 and by the RFSC... 76
Table 7.4 - Indicators proposed by ISO and the GCIF... 81
Table 7.5 - Rules for each visualization of the dashboard ... 85
vi
LIST OF ABBREVIATIONS AND ACRONYMS
BI Business Intelligence CO2 Carbon Dioxide
ETP-Process Extract, Transform and Publish Process. The process that starts with (raw) data in a database and ends with a publishable, published data set
EU European Union
GDP Gross Domestic Product
ICT Information and Communication Technologies
KPI Key Performance Indicator
Mockup Prototype of the dashboard, dashboard sketch NO2 Nitrogen Dioxide
O3 Ozone
PM10, PM2.5 Air mass suspended particules, related to traffic emissions
SC Smart City
1
1.
INTRODUCTION
The urban population in 2014 accounted for 54% of the total global population, up from 34% in 1960, and continues to grow. It is estimated that in this year 2017, even in less developed countries, a majority of people will be living in urban areas (World Health Organization, 2014). As the planet becomes more urban, cities need to become smarter. Major urbanization requires new and innovative ways to manage the complexity of urban living (Rizzo, Deserti & Cobanli, 2015).
Thus, a new management proposal arises: more integrated, more sustainable and more efficient. The core of the management is no longer so focused on the physical ability to live in cities, but focused on the citizens and on the increasing of its livability (Directorate-General for Territorial Development, 2015a).
It is in this context of transforming the infrastructures and systems of the city into optimized results that the concept of smart city arises. Cities that are based on intelligent approaches to the various sectors and focus on providing effective responses to the needs of those who inhabit them: the present and the future citizens (UK Department for Business Innovation & Skills, 2013).
Since citizens are their core, the smart cities should be transparent to them. To this end, smart cities should allow the exchange of data and information with their citizens (Smart Cities Council, 2014). In the smart cities’ vision, the generation and analysis of contextual and actionable data is a central pillar, with the city becoming increasingly knowable and controllable in new dynamic ways (Kitchin, Maalsen & McArdle, 2015). However, it was considered in this work that, the value of the data stored by the smart city is only tangible if shared with the various stakeholders that are part of it (like citizens, governors, tourists and investors, for example).
The data should be shared for understanding, monitoring and planning the city (Kitchin, 2014). It is for this purpose that dashboards were built on this project. Their aim is to transform the city data into information and knowledge by showing the performance of Cascais: a municipality managed according to a smart city strategy. The main goal is to make this project into the transition link between the raw data and the information by creating the framework between the data that nothing transmits (due to its initial and raw state) to the citizen and the information with useful purposes. Initially, this project was intended to only use open data feeding the dashboards. However, other sources of data emerged due to two reasons. The first one was the fact that the open data portal of Cascais is still in its initial state, not allowing the existence of sufficient open data to feed the indicators of interest. The second reason is the fact that the benchmarking was the way outlined to achieve the initial choice of indicators. The constituent cities of benchmarking have different characteristics of the municipality under study and, as expected, there is no open data available on the portal for all key indicators resulting from the benchmarking.
2 The research question goes through discover the best way to show the performance data of the city always with the aim that, with the release of these data, the quality of life of the citizen improves. This may occur due to a large number of factors like the following examples:
The citizens are more informed and therefore can make better decisions based on facts;
Organizations can create new innovative solutions whose need for existence has been verified through the analysis of the released data;
Municipal managers can find flaws and potential opportunities to improve the municipality, track the progress of services and identify needs of citizens.
1.1.
C
ONTEXTUALIZATIONThis project is developed in Cascais, a municipality that benefits from a mild climate, with an extensive coastline (30 Kilometers) with more than fifteen beaches and natural landscapes (that occupy a third of its territory) and near the capital (Lisbon). With 97.4 km² of area and with approximately 206 479 inhabitants (Statistics Portugal, 2011),it is the 6th most populous urban area of Portugal.
It is a modern municipality that is concerned with the development of contemporary approaches to manage and plane the future of the community. For this purpose it uses a smart city strategy. For such, the efficient and intelligent use of technology is essential and, like any smart city, Cascais will achieve positively it goals only if it has the feedback and collaboration of its inhabitants. Therefore, the constant connection with the inhabitants is fundamental to the use of their information as a means of achieving efficiency (UK Department for Business Innovation & Skills, 2013).
In order to achieve assertive collaboration from the citizens, transparency in the communication of strategies and results is essential. To gain this governmental transparency it is necessary to analyze and transmit the data generated. To reach an efficient communication, the sharing of data and information using definitions and standards that any user can use, reuse and interpret is essential. It is a process that makes the data and the citizens smarter (Manville et al., 2014).
Following the principles of smart city, Cascais has been producing a large number of data (through the information technologies present in the various dimensions of the municipality) that can support the planning and the management of the municipality and improve the knowledge about the territory and about the inhabitants. Therefore, it is necessary to develop a framework to release this data.
3
1.2.
S
TUDYG
OALSThe main objective of this project is the construction of city performance dashboards for the municipality of Cascais mostly supported by open data.
The dashboards should make the data useful and easily interpretable by any dimension of the smart city, allowing the assimilation of information without the need of work the raw data.
The dashboards should cover the economic dimension, the social dimension and the environmental dimension of the data. Such choice is based on the fact that smart cities are sustainable cities and the three pillars of sustainability are the economic, social and environmental, according to the conclusions of the United Nations 2005 World Summit on Social Development.
The monitoring of information about these dimensions will be used as a mean to support the analysis of this data, thus generating insights on how to improve the performance of the smart city in the service and citizen's quality of life.
In order to achieve this, the following steps must be carried out in advance:
Conduct an international benchmarking in how other cities measure and present the three dimensions of interest (economic, social and environmental);
Study best practices for visualizing the performance measures using dashboards;
Select which indicators best describe the level of performance of a smart city on these three dimensions;
Select required data sources and prepare data;
Characterize the dashboard design template;
Built the dashboard and analyze the results obtained.
1.3.
R
ELEVANCE OF THES
TUDYAccording to the Smart Cities Council (2014), the three core functionalities of smart cities are to gather data (measure and monitor the current conditions), communicate the data and analyze it. The objective of this project is focused on the communication part since the main objective of the project is to monitor the large amount of data already generated and gathered, summarize it and make it easily viewable by any individual.
Due to its many technologies, like sensoring, a smart city is a big data generator (Kitchin, 2014). Because this data is so voluminous, these dashboards arise as a need to visualize, understand, explore and communicate information, not data.
For a smart city to be successful it has to have an open access and open data approach that enables their citizens to access the information they need, when they need it (De Marco, Mangano, & Zenezini, 2015). The dashboards developed will grant any citizen the access to transparent outcomes allowing them to compare the performance of the city.
4 With the creation of these dashboards it is expected the improvement of the public services. It is important for citizens to become smarter, with the intention of acting and thus be more integrated in the services of their city.
In addition to the demonstration of key indicators that represent the performance of the city, this project also has the objective to serve as guideline to other cities that want to implement a similar solution to monitor their data. Although the indicators presented are adapted to the characteristics of the municipality under study, it is intended that the followed processes can be easily adapted to other cases.
1.4.
M
ETHODOLOGYThe chosen methodology to follow on this project was the "Design and Creation Research" proposed by Oates (2005). It is a cycling process that focuses on the development of IT artifacts and on the creation of missing knowledge. On this case, the artifacts will be the developed dashboards. Is a design process characterized by learning via making and the five major steps are:
1. Awareness: the recognition and articulation of a problem.
The recognition came from the need for visualizing the data produced by the smart city. This visualization will be useful both for the inhabitants (to have government transparency) and to management of the city (allowing the identification of possible problems or opportunities). The articulation of the problem will be characterized by an extensive review of the literature that will help to plan and define the dashboard components, the open data concept, features of a smart city and indicators to evaluate its performance.
2. Suggestion: tentative idea of how the problem might be addressed.
Is the creative step to envision of a new functional artifact and the expected output of this step is a tentative design. On this case, the output expected will be the first mockups with the first experimental metrics. The choice of the first metrics will be based on a benchmarking that should have, as output, the best indicators to capture the performance of a city.
3. Development: is the implementation of the tentative design and the expected output are the artifacts: the dashboards built using Power BI (a Microsoft tool created to monitor and analyze data along the organizations). On the development, an integration of the data that will feed the dashboard must be carried on. For such, an assessment must be made to verify which open data has already been published and what data is need to properly characterize the smart city.
5 evaluates methodology which means that, after produce and apply knowledge to create effective artifacts that should solve a problem, it is necessary to analyze the use and the performance of artifacts. The question that will determine the efficiency of the performance of artifacts will be: the used indicators characterized the performance of the smart city?
5. Conclusion: the results of the research and determination why and how the
artifact worked or did not work.
It cannot be ignored that the process of analyzing data is not static nor does it have an end. All the above phases are interlinked and should be reviewed when new updates are available. It is a continuous cycle and even after the results have been published, measures should be taken to ensure accuracy, meaning and timeliness of data (Carrara, Oudkerk, Steenbergen, & Tinholt, 2016). The investigation process considered for this work is composed by five stages and is presented on Figure 1.1.
6
2.
LITERATURE REVIEW
On the present chapter, it will be presented a literature review that served as theoretical basis to the development of this project. The chapter begins with a brief description about the definition of Business Intelligence, followed by an approach to some proposed definitions and model of smart city. The section ends with some insights about the incidence of smart cities internationally.
This chapter also contains the characteristics and objectives of the open data as well its process followed by the presentation of the open data portal existing in Cascais: the Cascais Data.
At the end of the chapter is presented the theme of dashboards with the related correct practices during the construction.
2.1.
B
USINESSI
NTELLIGENCE FORC
ITIESThe business pressures resulted of today’s competitive climate leaded us to an evolution of decision support concepts overtime. To organizations excel on this turbulent environment (solving problems and exploiting opportunities) is always present a need for computerized support of managerial decision making (Varghese & Ramakrishnan, 1991).
The term Business Intelligence emerged amongst main objective of closing the gap between the current performance and the desire performance. According to Watson (2009), BI is a broad category of applications, technologies and processes for gathering, storing, accessing and analyzing data to help business users make better decisions. The objectives are to enable everyone throughout an organization to quickly and easily access any data, possibly in real time, as well as conduct appropriate manipulation and analysis. BI helps transform data to information, to knowledge, to decisions and finally to action (Negash, 2004). In the smart cities context, the BI term follows the referred characteristics but acts more linked to the urban analytics. Urban analytics is also a set of tools, methods and processes oriented to the processing and analysis of a set of data with urban information of the diverse areas associated to the smart cities. Aligned with the BI objectives, the main goal of urban analytics is to support decision-making (Directorate-General for Territorial Development, 2015b).
This project will be focused on the component of BI that provides a comprehensive view of performance measures and trends, once it will be develop a dashboard in a smart city context. On the next point we will define the definition, context and framework the smart city topic.
2.2.
S
MARTC
ITY7
2.2.1.
The Smart City Model
Various models for understanding and conceptualizing smart cities have been developed, which aim to define their architecture. The main question is that many authors support their scopes on governance, others on services, environment or facilities, for example. With the objective of unifying and reach a consensus, in 2016, Anthopoulos, Janssen & Weerakkody carried out a study where the various models already proposed were analyzed. The result was a unified smart city model that is composed by six dimensions that are recognized an agreed by all scholars, even with small variations.
Definition Source
Smart city as a high-tech intensive and advanced city that connects people, information and city elements using new technologies in order to create a sustainable, greener city, competitive and innovative commerce, and an increased life quality.
Bakıcı et al. (2012) A smart city is based on intelligent exchanges of information that flow between its
many different subsystems. This flow of information is analyzed and translated into citizen and commercial services. The city will act on this information flow to make its wider ecosystem more resource efficient and sustainable. The information exchange is based on a smart governance operating framework designed to make cities sustainable.
Gartner (2011)
Smart city generally refers to the search and identification of intelligent solutions which allow modern cities to enhance the quality of the services provided to aware citizens.
Giffinger et al. (2007) Smart Cities initiatives try to improve urban performance by using data, information
and information technologies (IT) to provide more efficient services to citizens, to monitor and optimize existing infrastructure, to increase collaboration among different economic actors, and to encourage innovative business models in both the private and public sectors.
Marsal-Llacuna et
al. (2014)
The idea of a smart city is rooted in the creation and connection of human capital, social capital and information and communication technology (ICT) infrastructure in order to generate greater and more sustainable economic development and better quality of life.
Manville et al. (2014) Cities [should be seen as] systems of systems, and that there are emerging
opportunities to introduce digital nervous systems, intelligent responsiveness, and optimization at every level of system integration.
MIT (2013)
8 The six axes that the smart cities have been further defined are:
Smart Economy
Smart Mobility
Smart Environment
Smart People
Smart Living
Smart Governance
(It is possible to overview the six smart city axes in Table 8.1)
Based on the referred dimensions and in the model proposed by Khatoun & Zeadally (2016) the following model is suggested which places the citizen as the center of all the axes once they exist to meet their needs (see Figure 2.1).
All these six dimensions are framed on the three pillars of sustainability already mentioned. Each dimension has its own contribution to each of the three pillars. As the International Electrotechnical
9 Commission (n.d.) affirms, all the models and architectures defined by the various authors have in common the basis of the three pillars.
Following the work proposed in “New Key Performance Indicators for a Smart Sustainable City” (Hara, Nagao, Hannoe, & Nakamura, 2016), on this project it will be constructed a dashboard per pillar of sustainability: social, economy and environment. Each pillar encompasses the six referred dimensions with different weights, so the defined model for a smart city will be respected.
On the Figure 2.2 it is possible to have an empirical overview of the weight of each dimension on each pillar of sustainability considered on this project, according the potential impact of local politics priorities/projects.
2.2.2.
Smart Cities Worldwide
To complete the contextualization of the concept, it is considered important to have some general ideas about how smart cities are performing globally.
As will be explored later, there are a several number of indexes attempting to measure and classify smart cities. It is an ambiguous task to classify the best smart city but, in an attempt to reach a consensus, it is possible to affirm that the cities whose references most appear in the top of divers indexes and rankings are New York (USA), London (UK), Paris (France), Boston (USA) or Tokyo (Japan) for example, as it is possible to examine on two of the manifold indexes Global Cities 2016 (A.T. Kearney, 2016) and IESE Cities in Motion (IESE Business School & Center for Globalization and Strategy, 2016).
Since Cascais is located in Europe, this section will be concluded with brief key findings in how European cities are performing along the six dimensions previously referred. The key findings refers to a study conducted by Manville et al. (2014) based on a database of all 468 cities with a population of at least 100 000 citizens within the 28 Member States of the EU.
10 After the collection of the data about these 468 cities, the authors decide that the threshold for being considered on the study a smart city is to have at least one of the six characteristics. For that, they examined elements such strategies, projects, platforms, networks and programs and identified 240 of the 468 that are considered smart cities. Some conclusions are:
There are more small smart cities than large ones, but there are smart cities in all size categories and in most EU-28 countries.
The incidence of smart cities decreases with city size. This does not mean, however, that smaller cities are not engaging in smart city development as it's possible to see on Figure 2.3;
City size is clearly positively correlated with the number of characteristics sought through smart city initiatives, as Figure 2.4 demonstrates. Smart cities with only one characteristic tend to have between 100,000 and 200,000 inhabitants.This supports the notion that larger cities tend to have the greatest resources and more ambitious smart city policies;
11
Smart Environment has significantly greater representation than the other characteristics, followed by Smart Mobility. The remaining characteristics are more or less evenly distributed (around 10% coverage by all cities); The highest absolute number of smart cities is found in the UK, Spain and Italy; the countries with the highest proportion of smart cities are Italy, Austria, Denmark, Norway, Sweden, Estonia and Slovenia.
The majority of these conclusions are also verified for the example under study. Cascais is also a small city but is engaged with the development of solutions to become a smarter city. Following the conclusions of the study, is also in the Environment and Governance dimensions that Cascais has greater representation, like is possible to notice on the next section.
2.2.3.
Cascais As Smart City
The leadership of Cascais over this theme is related to the degree of urban intelligence achieved, as result of the good practices carried out in the area of sustainability.
Cascais is one of the municipalities that has invested in new technologies in order to make the city management smarter which results in better living conditions.
Some of the technology applied to smart cities is already used in the municipality, in the daily life of the citizens who live or work there or by those who visit.
The first example is the case of the MOBI-Cascais project (https://www.mobicascais.com): an integrated transport system where, through a single application, will be possible to integrate all existing means of transport (which includes the use of shared bicycles and parking).
12 Another example where the innovation is present is the intelligent management of solid waste. "Smart Waste Management" (Cascais, 2015) allows, among other things, the application of sensors in the underground containers to indicate, in real time, the level of filling. Avoiding, on the one hand, that they become too full and, on the other, preventing unnecessary trips to collection. Municipal vehicles are able to do less 180,000 Kilometers per year, reducing CO2 emissions by 352 000 tons per year, which results in savings for the municipal of 800 000 Euros per year.
But it is not only in the monitoring of containers that new technologies help. The collection vehicles are also equipped with technology that allows geo-referencing and typifying of end-of-life objects and garden cuts that are in the public highway for later management of collection routes.
Other example is the FIX Cascais (http://cascais.pt/fixcascais)application. This also allows anyone to geo-reference a situation or problem detected on the public space.
Also in the museum spaces of Cascais there is innovative technology that allows to a better management. The Museum of the Village (Cascais,n.d.) is equipped with an intelligent lighting system that adapts the luminosity of each exhibitor to the approach of the visitors, allowing the best lighting conditions in each moment.
Like the online attendance of the municipal services and the public and available information systems, there are much more other examples that put Cascais at the forefront of the smart city movement in Portugal. As well as the examples referred, this project is another initiative that goes with the goal of making Cascais smarter. It is possible to conclude that, in Cascais, the concept of smart city is very present as a means to improve quality of life.
Cascais, like the others smart cities, is a data producer. The use of this data produced is fulcrum to be considered a successful smart city. This referred use supposes the analysis of the data to constantly improve the performance of the city. The data collected by a smart city it is about its inhabitants, so it should belongs to them. For this, it must be made public and open. That is the purpose of the open data concept, explained in the following section.
2.3.
O
PEND
ATAGovernments have a large number of basic data which can be of economic and social value to society as a whole. Along those lines, more and more European countries are developing policies to release this data as open data. Open data refers to information that can be freely used, modified, and shared by anyone for any purpose. It must be available under an open license and provided in a convenient and modifiable form that is machine readable (Carrara, Oudkerk, et al., 2016).
13 In particular, the public is expected to be able to use government data to make better decision and improve the quality of their lives while governments are expected to be able to more easily access a wider range of datasets to foster evidence-based decision making (Ubaldi, 2013).
It is possible to conclude that the benefits of open data can be divided into economic, political and social indirect benefits. Economic benefits can translate into new job potential, new goods and services, knowledge economy growth, increased efficiency in public services and growth of related markets. At the political level, one can speak of increased transparency and accountability, civic participation, political awareness and access to information. From a social point of view, benefits can take the form of increased social inclusion and empowerment, civic participation, access to information and support to personal decision-making capabilities (Carrara, Chan, Fischer, & Steenbergen, 2015).
Aligned with these benefits, the Organisation for Economic Co-operation and Development (2015) ranked the top principal objectives of the open data strategy. As can be seen below in Figure 2.5, improved service delivery is the top priority.
To have some conclusions about this theme across Europe, the European Union made a research conducted by Carrara, Nieuwenhuis & Vollers (2016) about the level of maturity of the open data. For that, two key indicators were selected. The first key indicator, Open Data Readiness, assesses which countries have an open data policy in place, licensing norms, an open data policy, the open data available and the impact of open data. The second key indicator, Portal Maturity, explores the usability of the portals regarding the availability of functionalities, the overall re-usability of data such as machine readability and accessibility of data sets.
The results of this study show that the open data movement has gained acceptance in Europe on the past few years and, increasingly, European countries implement open data policies. This fact is possible to verify on the open data maturity map (Figure 2.6):
14 This study also concludes that, in 2016, most countries have increased their use of open data as they have launched activities to promote their open data policies and portals. This growing attention to this subject implies an increase on the amount of public and published open data. According to Ubaldi (2013) the four main phases that can be identified in the open data creation are:
1. Data generation: this covers the generation of public data, which is normally done by public sector entities even if this function may increasingly become shared with other publicly funded data sources (e.g. social statistics, aerial data);
2. Data collection, aggregation and processing: data need to be collected, gathered to enable access, sharing and re-use. Most government data also need to be aggregated, linked, and or manipulated once open in order to add value for the majority of users (e.g. to support personal decisions). Many users would in fact not be able to understand and make use of the data as it is‘. This applies in particular to non commercial re-use of government data;
3. Data distribution and delivery: data need to be distributed to the potential users to enable access and re-use;
4. Final data use: open government data need to be re-used by a whole list of different users to sustain public value creation.
15 To make these referred phases it is possible to rely on the traditional extract, transform and load process (ETL process) and adapt it transforming the load phase in the publish phase (Herreweghe, 2015). The ETP-Process (see Figure 2.7) is the technical specification of how data flows through the organization, transforms into a publishable data set, and eventually is made public.
2.3.1.
Cascais Data Portal
According to Catarina Selada (Cardoso, 2016), the priority area in the development of a smart city, in Portugal, is the development of an integrated strategy based on open data, available to the population. Following this principle, one of the priorities of Cascais is to make the data available to the population. Cascais has been collecting a large quantity of data that, when shared, can create value. These data, in order to reach their maximum potential, must be made public in an open data format.
Upload to a portal is the most used channel for publishing open data. As all the open data portals, the expected impact of the Cascais Data portal is to drive transparency once it bridges the gap between government and citizens in terms of information.
The Cascais Data portal will be launched soon and publishes data using CKAN (Comprehensive Knowledge Archive Network), an open source catalogue system that has become one of the major standards within Open Data portals. As CKAN is open source, it is continually improved and is available free of charge. The option to choose this catalogue system was due to its many strong features such as harvesting, publishing and auditing and has integrated data storage (CKAN, n.d.). It is possible to see in the following Figure 2.8 the general aspect of the Cascais Data.
16 Figure 2.8 - Homepage of the Cascais Open Data Portal (the text is in Portuguese)
As it is possible to see, the Cascais Data portal is based on the ten following themes: 1. Economy
2. Education 3. Health
4. Leisure, Culture and Sports 5. Environment and Energy 6. Transportation
17 8. Security
9. Population and Citizenship 10. Territory
Align with the already mentioned open data strategy, the Cascais Open Data strategy/policy has the following three main challenges related with the liberation of the public data about the municipality:
1. Accessibility
To have and to give access to the data produced (internal data management);
Availability of data to be used and re-used (primary, raw, appropriate formats);
2. Quality
Providing reliable (up-to-date, complete and consistent) data;
Production of metadata and organization of data in order to understand it;
3. Utility
Provision of high-value datasets according to the users interest;
Development of an ecosystem that supports and enhances existing data;
Monitor and document emerging impacts and benefits of open data.
18
2.4.
D
ASHBOARDSOn this project there will be no such focus on the ability of BI to assist business managers in their analytical and decision-making process but rather in the main objective of BI: to allow easy access to data and create a favorable environment to conduct analysis through the transformation of historical and current data, metrics and performances into three single interfaces, the dashboards.
The volume of open data produced by this smart city brings a fundamental challenge: display all the required information on a single screen clearly and without distraction in a manner that can be quickly and easily assimilated (Few, 2007). There is obviously a need for visual tools that help people understand data. It is in this context that the dashboards emerged. One example of a succinct and workable definition of a BI dashboard can be: “is a visual display of the most important information needed to achieve one or more objectives; consolidated and arranged on a single screen so the information can be monitored at a glance” (Few, 2004).
Despite being a mean to organize and interact with data, the dashboards can also be seeing as storytellers once they use their visualization tools to analyze complex data that cannot simply tell stories. They need to be ”tailored” to accommodate storytelling by better highlighting items of importance within very large data resources, in a way that is efficient for the storyteller and clear for the audience (Elias, Aufaure, & Bezerianos, 2013).
2.4.1.
Data Visualization Best Practices
There are some visual considerations that can greatly improve the way that the user understands the data. Some examples are (“Guide to Dashboard Design,” 2009):
Colors should enhance data comprehension, not distract (use fewer than six colors), the use of opposing colors should emphasize comparisons and the use of color temperatures should highlight information (cool colors to backgrounds and warm colors to data) and use the color saturation correctly (less saturation to small values and more saturation to greater values);
Avoid combining unrelated charts into one and make sure that everything is legible;
Consider the importance of direction (high level visualizations to the left and detail to the right and bottom);
Avoid concentrating on style over substance and make sure that these metrics allow meaningful comparisons.
2.4.2.
Rules to Dashboarding
In addition to the best practices, designing and building successful dashboards might evolve some of the following rules (“Guide to Dashboard Design,” 2009):
Enable drill-down or drill-through to underlying data sources or reports and filters to allow flexibility and customization;
19
Require minimal training and easy to use by anyone;
Do not exceed the boundaries of a single screen or display excessive detail;
Use modularity to compact information and visual cues to guide attention.The most relevant one is the selection of the right visual representation for each type of data.
One of the main tasks of this project is to choose the visualizations that better make the data meaningful and useful in order to be possible to achieve the objectives. If the visual representations are not the correct ones, the dashboard cannot be informative and useful. To help in this aspect it will be used the chart selection diagram crated by Abela (2006) and represented on Figure 2.9.
20
2.4.3.
Target and Indicators
One of the most important aspects, if not the most important one, is to present, on the dashboards, indicators1 that really matter to the audience, to the defined goals and to the problem.
The dashboards are a valuable tool to analyze data if allow to make proper decisions and if communicate performance. The selection of proper target and indicators is crucial for the effectiveness of the measurement and the data collected need to be exhaustive and representative so that the real world is described (De Marco et al., 2015).
The initial step is to define the target. If the final product has a user, it must be adapted to the characteristics of that user.
The dashboard should clearly communicate to the following potential users:
Potential newcomers and visitors looking for information about Cascais when considering it as a place to live or to visit;
Investors looking for strategic information about the municipality to identify potential investments;
Inhabitants that want to be informed about their city and its performance;
City executives and managers that want to recognize eventual lapses or possible improvements to consider.Based on “Key Performance Indicators Related to the Use of Information and Communication Technology in Smart Sustainable Cities” (International Telecommunication Union, 2015) the selection of the indicators will be carried out using the following principles:
Comprehensiveness: The set of indicators should cover all the aspects of the smart city and be aligned to the measured subject;
Comparability: The indicators should be defined in a way that data can be compared scientifically between different moments, which means the indicators must be comparable over time and space;
Availability: The indicators should be quantitative and the historic and current data should be either available or easy to collect;
Independence: The indicators in the same dimension should be independent or almost-orthogonal i.e., overlap of the indicators should be avoided as much as possible;
21
Simplicity: The concept of each indicator should be simple and easy to understand the calculation of the associated data should be intuitive and simple;
Timeliness: This is defined as the ability to produce indicators with respect to emerging issues in SC construction or stage or development.
The data that will feed these indicators is also a parameter of importance. Within the context of the smart city, data are used as input for decision making and to inform (citizens, city managers or other entities).
The data quality needs to be considered at all aspects of the data lifecycle and in the development and use of applications. Otherwise, the dashboard can be constructed based on data with quality issues which may result on propagation through multiple systems and lead to poor information and unreliable ‘evidence-based’ decisions (Mcardle & Kitchin, 2016). If the transmitted data is not reliable, when the users take evidence-based decisions with that data, the outputs of these actions will not be accurate or correct and the main purpose of this project will not be achieved.
It is then considered necessary to check the quality and veracity of the data to be used in the dashboard so it can inform users and not mislead them.
22
3.
DEVELOPMENT
As already mentioned on the methodology definition, the development of this project relies on a cyclical process which means it is an iterative method used for the continuous control and improvement of the artifacts. To start the process, an initial suggestion must be made. This will lead to the implementation and finally to the evaluation of results. The evaluation will determine the beginning of a new cycle or the conclusion of the project.
To start the first suggestion, a benchmarking was conducted in order to have an initial list of indicators to follow on the first try. The presentation of it is the first section of this chapter followed by the presentation of the indicators to use on the initial mockup as well the construction of the mockups.
The chapter ends with the construction of the mockups and with the presentation of the graphic rules manual.
3.1.
B
ENCHMARKINGIf there are different theories about the definition of a smart city, even more ambiguous will be trying to find out the correct way to measure performance. The lack of a clear and widely usable definition and such as delimitation areas and indicators makes it difficult to compare or measure cities in this context (Afonso, Brito, & Álvaro, 2015).
Different methods and measurement indicators have been developed so far according to the several meanings of the concept but usually the existing indicators are often not standardized, consistent, or comparable over time or across cities. So, they will never be completely reliable and accurate. The fundamental problem is that the variety of indicators lacks consistency and comparability (Mavric & Bobek, 2015).
Due to this fact, there is no correct way or an index to follow to evaluate the performance of Cascais. So, to have a starting point, a benchmarking was conducted and five cities and five frameworks were selected for analysis.
Each city is individual and unique. Different people living in different places have different values and it is nearly impossible to find out a universal way of measuring performance of all cities. Big cities have different characteristics from the small ones as well as the ones located on the coast, the Asian ones, and so on. With this in consideration, and after an extensive analysis of the many existing frameworks, were selected five frameworks of interest that seem to be able to take into account different locations, people and cultures.
The first of all was the ISO2 37120 (2014): an international standardization of indicators for city services and quality of life. This set of standardized indicators provides a uniform approach to what is measured, and how that measurement is to be undertaken. As a list, it does not provide a value judgment, a threshold or a target numerical value for the indicators. These indicators can be used to track and monitor progress on city performance.
23 With the ISO 37120 as a basis, the World Bank (2009) with support of University of Toronto, creates the Global City Indicator Facility. This is the second used framework and help cities with performance monitoring by providing a framework to facilitate consistent and comparative collection of city indicators.
The next one was proposed by ITU (2015), the United Nations specialized agency for Information and Communication Technologies that works to standardize the many areas of the ICT subject. Together with the United Nations Economic Commission for Europe (UNECE) developed a set of KPIs for smart cities that they believe to assess how smart cities have been in accomplishing their goals.
The ITU-UNECE framework is followed by the indicators used on a solution developed by the Open Government of the United States. Is a solution called Civic Dashboards (n.d.) and its major goal is to transform open data in actionable information. It aggregates data from various sources and provides a set of indicators to help users to get insights.
The last one under analysis is the Reference Framework for Sustainable Cities (n.d.). A web tool created to guide cities to sustainable development through five dimensions.
Regarding to the chosen cities, when the initial research about the subject of dashboarding open data of smart cities was initiated it became clear that only a few cities had public solutions on this area. The few that have something relating to dashboards of performance had real-time solutions of a global overview of the city and no monitoring of their data. Example of this fact is the city of Sydney (see Figure 3.1). Their city’s dashboard only shows a brief overview of the real-time conditions like the weather, the transportation network, live traffic cameras, news or trends. They do not have records of analysis of open data generated in the city, trends or status evaluation of a few dimensions.
24 Whence, the selection of the five smart cities was based on their capacity to monitor open data and release indicators that demonstrate their performance. An extensive analysis of existing city dashboards and performance metrics was carried out, starting with the considered best smart cities. But then, it was concluded that the smartest and biggest cities (despite the example of London) are least concerned in releasing data analyzes, dashboards and indicators. They have their data public and available but are other cities that perform better on this field.
On the Table 3.1 the results of the referred analysis are shown. It was conducted a search using the key words city dashboard, city performancedashboard and city indicators dashboard.
Cities Result Source
CityDashboard: Birmingham, Brighton, Cardiff, Edinburgh, Leeds, Manchester Madrid Sydney Venice
Performance dashboard with no statistical data or analysis. Real-time indicators like for example: Air Pollution, Noise,
Weather Conditions, Transportation Status, Traffic
Cameras and News.
http://citydashboard.org/choose.php http://ceiboard.dit.upm.es/dashboard/sck_p ub http://citydashboard.be.unsw.edu.au/ http://dashboard.cityknowledge.net/#/venic e Calgary Edmonton Los Angeles Dublin London
Interesting set of indicators to capture city performance. In the most cases it is presented
the following features: - Indicator with related measures, metadata and
behavior over time; - Importance of the indicator and the actions undertaken to
improve performance; - Target and comparisons.
http://www.calgary.ca/General/Pages/Citizen Dashboard/Citizen-Dashboard-Landing.aspx https://dashboard.edmonton.ca/ http://dashboard.lamayor.org/ http://www.dublindashboard.ie/pages/index https://data.london.gov.uk/ Glasgow
Amsterdam Under Construction
http://futurecity.glasgow.gov.uk/dashboards/ http://citydashboard.waag.org/ Boston, Albuquerque, Surrey, Toronto, Tampa, Muskegon, Rockford, Adrian, Melbourne, Waterloo, Seattle, Portland, Bellevue, Texas, Galway, Kansas,
Interesting set of indicators but not related with the objectives of the project. They have one
of the following issues: - Do not display the indicators
that are measuring the city performance into a dynamic
single-screen;
- The information is presented in an info graphic format; - The information is not related
with the subject under study; - They adjective a dashboard as
25 Jersey, Plano,
Washington DC, Chicago,…
a list of indicators. http://adriancity.com/transparency/dashboar d/
https://www.melbourne.vic.gov.au/about-
council/our-performance/Pages/quarterly-services-dashboard.aspx
http://www.waterloo.ca/en/government/perf ormancedashboard.asp
https://performance.seattle.gov/ https://www.portlandoregon.gov/cbo/67124
http://www.ci.bellevue.wa.us/performance-dashboards.htm
https://data.austintexas.gov/stories/s/Citywid e-Dashboard/2tzx-kje9
http://galwaydashboard.ie/ https://kcstat.kcmo.org/ http://data.jerseycitynj.gov/showcase
https://dashboard.plano.gov/ https://dc.gov/trackdc
https://www.cityofchicago.org/city/en/depts/ cdot/dataset/cdot_performancemanagement
26 It is possible to conclude that the chosen cities to the benchmarking were: Edmonton, Calgary, Los Angeles, Dublin and London.
After the choice of the five frameworks and the five cities, for each one was constructed a table with the dimensions and indicators (see Appendices 7.1 to 7.4) that are used to characterize and monitor the performance of the city. Then, the various indicators were crossed and the Table 3.2 emerges composed by the indicators (related to the dimensions under study) that appear in at least three of the portals under analysis.
This process is illustrated bellow on Figure 3.2:
Figure 3.2 - Benchmarking process
27
THEME-INDICATOR Cities Frameworks
LONDON DUBLIN LOS ANGELES EDMONTON CALGARY ISO 37120 GCIF ITU RFSC CIVIC D.
ECONO
MY
Unemployment X X X X X X X X
Employment X X X X X X X
Population in Poverty X X X X X
GDP X X X
GINI X X X
Nr of Business X X X X X
Nr of New Patents X X X
Housing X X X X X X
International Visitors X X X
SOC
IAL
Property Crime Rate X X X X
Recorded Crime X X X X X
Police Officers X X X X
Firefighters X X X
Education Qualifications X X X X X X
Demographics of the Population X X X X
EN
VIRON
ME
N
T
Waste Produced X X X X X X X X
Water per Capita X X X X X X X
Water Quality X X
Air Quality Index X X X
Sound Level X X X
PM2.5 Levels X X
NO2 Emissions X X
Energy Use X X X X
Greenhouse Gas Emissions X X X X X X X X
Building Energy Use X X X
Green Area X X X X
28
THEME-INDICATOR Cities Frameworks
LONDON DUBLIN LOS ANGELES EDMONTON CALGARY ISO 37120 GCIF ITU RFSC CIVIC D.
EC O N O M Y Unemployment Unemployment rates for those aged 16 or over.
Numbers in unemployed
Unemployment rate gap between LA County and the
City of LA
Unemploym ent rate Unemployment rate Unemploym ent rate, Youth unemployme nt rate Annual average unemployment rate
_________ _________ Unemployment rate
Employment
Employment projections by
sector and by borough Numbers in employed, Numbers by employment sector Total employment _________ _________ Percentage of persons in
full-time employment Total employment, Employment percentage change based on
the last 5 years, Percentage of full-time employment Employment Rate, Creative industry employment, Tourism industry employment Employme nt rate for women and men aged
20-64
_________
Population in Poverty
_________ _________ Percentage of population in poverty Percentage of population in poverty Percentage of population in poverty _________ Population at risk of
poverty
Percent Living in Poverty
GDP
_________
GDP
_________
GDP, GDP per
capita _________ _________ GDP per Capita
GINI _________ _________ Gini coefficient Gini
coefficient
Gini income distribution
Nr of Business
Growth in the Nr of Small & Medium Business
Number of businesses per 100 000
population
Number of businesses per
100 000 population
% of Small and Medium Enterprises
_________
Number of businesses per 100
000 population
Nr of New Patents _________
New patents per 100 000 inhabitants
per year
New patents per 100 000 inhabitants per
year
Nr of New patents Patents per 100
29
THEME-INDICATOR Cities Frameworks
LONDON DUBLIN LOS ANGELES EDMONTON CALGARY ISO 37120 GCIF ITU RFSC CIVIC D.
Housing Average Rent Levels, Average House Prices Average monthly rent, Average House Prices Housing Permits Issued,
Nr of new houses Permit Applications, New units per quarter Construction Permits Issued,
New units per month, Average House
Prices
_________ _________ _________ _________
Building Permits per 1000 Residents, Average monthly
rent
International Visitors
Number of visitors, Foreign Born, Country of origin
of the visitors
Number of visitors
Number of
visitors _________ _________ _________
SO
C
IA
L
Property Crime Rate _________ _________ Property Crime
Percentage _________
Property Crime Rate Property Crimes per 100 000 _________ _________ _________
Property Crimes per 100 000
Recorded Crime Number of
Offences Number of Offences Crime Percentage Crime Severity Index Person Crime
Rate _________
Homicides, Violent Crimes and highway
fatalities per 100 000
Police Officers Number of Officers
_________ Number of Officers _________ _________ Number of Officers Number of Officers _________
Firefighters _________ Number of
firefighters Number of firefighters Number of firefighters Education Qualifications
People 25-64 with higher level qualifications
Highest Level of Education for Persons Aged 15
and Over, Number of students by year
of learning _________ _________ Number of higher education degrees per 100 000 population Number of higher education
degrees per 100 000 population
Higher education ratio, School enrollment
Percentage with High School or
higher, with bachelors degree or
30
THEME-INDICATOR Cities Frameworks
LONDON DUBLIN LOS ANGELES EDMONTON CALGARY ISO 37120 GCIF ITU RFSC CIVIC D.
Demographics of the Population Number of inhabitants Number of inhabitants, Age profiles, Foreign born _________ Number of inhabitants, People per Sq
Mile, Age profiles
_________
People per Sq Mile, Percent foreign
born, Percent 65 and over
EN VIR O N M EN T Waste Produced
Kg of waste produced per household, Recycling rate Waste Produced per Capita, Recycling rate Waste Diversion Rate Waste Diversion Kilograms of waste landfilled per person Percentage of waste recycled, Waste collected per capita Percentage of waste recycled
Percentage of waste recycled
Waste Produced per Capita
_________ Water per Capita
_________
Annual Water Consumption per Capita
Avg Daily Use Per Capita _________ Daily water consumption Total water consumption per capita (l/day) Total water consumption per capita (l/day) Total water consumption per capita (l/day) Total water consumpti on per capita (l/day)
Water Quality Water Quality
Trends _________
_________
_________
_________
Quality of drinking water
_________
Air Quality Index Current Air
Quality Index
Number of days of unhealthy air pollution levels
Air Quality Index
Sound Level Sound Level
_________
Noise
pollution Exposure to noise
PM2.5 Levels Average PM2.5
Levels _________ PM2.5 concentratio n _________
NO2 Emissions Average Nitrogen
31
THEME-INDICATOR Cities Frameworks
LONDON DUBLIN LOS ANGELES EDMONTON CALGARY ISO 37120 GCIF ITU RFSC CIVIC D.
Energy Use _________ Power average
use
Total energy use per
capita
Total energy use per capita
Total energy use per
capita _________
Greenhouse Gas Emissions Carbon Dioxide Emissions by Sector Greenhouse Gas Emissions Greenhouse Gas Emissions Greenhouse Gas Emissions Greenhouse gas emissions measured in tonnes per capita Greenhouse gas emissions measured in tonnes per capita Greenhouse Gas Emissions Greenhous e Gas Emissions
Building Energy Use
_________ Average Building Energy Use _________ _________ Total energy consumption of public buidings per year _________ Annual energy consumption of public buildings _________
Green Area _________
Green area per 100 000 population
Green area per 100 000 population
Green area per 100 000 population
Green zones
32
3.1.1.
Indicators Based on the Benchmarking
The constructed table is the benchmarking result and, as previously mentioned, it will be the starting point for the choice of the indicators.
Whence, the metrics used to calculate the next indicators were chosen based on the fact that are the most recurrent on the benchmarking.
For each indicator, most recurrent on the benchmarking, the following process (Figure 3.3) was applied:
Figure 3.3 – Indicators process
The result of this process is a list of potential indicators to measure the performance of Cascais. Once this list does not contemplate the characteristics of Cascais, small adaptations will be considered. Whenever it is necessary to carry out calculations, the estimate population of the current year under analysis should be used. For example, police officers per inhabitant:
Number of police officers in 2016 / Estimation of the population in 2016;
33 Each indicator of the economic dimension will be explained on the following points:
Unemployment
This indicator is a rate that defines the weight of the unemployed population over the total active population. The calculation of this indicator is:
(Unemployed Population / Active Population) * 100
Note: Active population is the labor available to work, including the working population (the workers who are employed) and the unemployed.
Employment
This indicator is a rate that defines the relationship between the employed population and the population aged 15 and over. The calculation of this indicator is:
(Employed population / Resident population aged 15 and over) * 100
Population in Poverty, GINI Coefficient, GDP and Patents
Although these indicators are recurrent in the benchmarking table, there is no data available at the municipality level. The existing and free-to-publish data related to these topics are only of national level so these indicators will not be used.
To replace them, a potential indicator was identified according to the available data and interest for the dashboard user:
Purchasing Power
The Portuguese National Institute of Statistics conducted a study in 2015 about the purchasing power in the municipalities of the country. The purchasing power per capita indicator aims to understand the daily purchasing power per inhabitant. Since Cascais is one of the municipalities with the greatest purchasing power in the country, is interesting, from an economic point of view, to present this indicator. This is due to the fact that, for example, if an investor is looking to find a strategic place to invest in Portugal, will find that Cascais is an attractive place.
This composite indicator is intended to translate purchasing power into per capita terms. It is an index number with a value of 100 in the country average, which compares the purchasing power expressed daily.
Number of Business
Although the most used metric to calculate this indicator in the Table 3.3 is the number of businesses per 100 000 inhabitants, to the Cascais example it was considered more interesting to present the absolute number of businesses per sector of economic activity.