Master Thesis
Using text-mining-assisted analysis to examine the applicability of
unstructured data in the context of customer complaint management
Maastricht University
School of Business and Economics
Universidade NOVA de Lisboa School of Business and Economics
Maastricht, 31 December 2014 Martin Wolowiec (I6009869/ 1856)
Master Thesis
MSc International Business Strategy & Innovation
MSc Management
Confidentiality clause
The current master thesis comprises confidential information of Deutsche Telekom AG. Publications and duplications of this master thesis - even just in extracts - are forbidden without obtaining a previous written permission of Deutsche Telekom AG. The master thesis is only accessible for members of the examination board and reviewers of Maastricht University and Universidade NOVA de Lisboa.
Abstract
Table of content
1. Introduction ... 3
2. Literature review and theory development ... 6
2.1 Satisfaction with complaint handling and behavioural outcomes ... 6
2.2 Perceived justice and satisfaction with complaint handling ... 9
2.3 Recovery attributes and perceived justice ... 13
2.4 Boundary conditions for effectiveness of recovery attributes ... 15
3. Method ... 16
3.1 Context ... 17
3.2 Sample and procedure ... 19
3.3 Measures ... 22
4. Results ... 26
5. Discussion ... 33
5.1. Interpretation of findings ... 33
5.2 Practical implications ... 36
5.3 Limitations and future research ... 38
6. Conclusion ... 40
References ... 41
Appendices ... 47
A. Dictionaries ... 47
B. Inter-rater agreement for severity measure ... 48
C. Dictionaries for model extension ... 48
1. Introduction
Companies operating within the telecommunication industry are facing a multitude of industry drivers, which they try to master on a daily basis. The drivers range from deregulation, to technology advances, to competition in general (Lee & Stewart, 2014). These drivers are dynamic by nature, which makes it difficult to maintain any competitive advantage that was previously achieved. In addition, when considering the net promoter score, which is a common customer loyalty metric, the industry average of the telecommunication industry ranks among the lowest overall (Net promoter benchmarks report, 2013). Consequently, a focus on improving customer experience can be a starting point for future advances with respect to the competitive position of a company.
Customer experience combines a number of facets that are all shaped through the offerings by a company, which can range from advertising and packaging to customer care and service performance (Meyer & Schwager, 2007). Thus, customer experience represents a central role for a variety of important company metrics. For example, customers infer their subsequent satisfaction from a series of experiences that result from using the services by a company (Maxham III & Netemeyer, 2003). In turn, customer satisfaction links to a variety of other outcomes such as word-of-mouth and trust (van Doorn et al., 2010). As a result, starting from the experience that is provided by a company to the customer an entire functional chain is put into motion. Improving the customer experience can ultimately influence loyalty and customer retention, which are essential prerequisites for a profitable brand positioning (Rust & Zaborik, 1993).
structured and of quantitative nature or unstructured and of qualitative nature (Meyer & Schwager, 2007). For example, a study by Ordenes, Theodoulidis, Burton, Gruber, and Zaki (2014) analysed customer experience feedback from an airport car park and transfer service. Based on the information within textual data it was possible to gain a more holistic view of the underlying service process and to identify previously unknown improvement factors. For instance, management realised that a previous change in the park’s name had caused service process failures and that customers were unable to find the designated parking spaces. Thus, once customer feedback is successfully organized and analyzed it can subsequently create value for a firm (van Doorn et al., 2010).
The purpose of the study is to help bridge the gap between CRM and CXM data by linking former research and recent developments in the realm of CRM with means of text-mining-assisted analysis. Correspondingly, the study aims at answering the research question: Can unstructured CRM and CXM data be used to infer succeeding customer evaluations within the context of complaint management? Moreover, additional sub-questions aim at investigating the influence of recovery attributes on perceived justice evaluations, the impact of perceived justice dimensions on customer satisfactions with complaint handling, and the relationship between customer satisfaction with complaint handling and behavioural intentions by the customer. It is expected that the findings on the initially unlinked and unexamined textual data contribute to the overall goal of gaining a more holistic view on customer experiences by building on recent developments within CRM. Consequently, improvements in customer experience and resulting practical implications can be achieved.
The study begins with a review of existing literature related to satisfaction with complaint handling including adjacent theories on behavioural outcomes, perceived justice, and recovery attributes. The corresponding hypotheses are derived along the studied literature. The methodology behind the study is presented in chapter three. Chapter four presents the empirical results from the data analysis. A discussion of the research findings including practical implications, limitations, and future research is presented in chapter five. Finally, chapter six presents the conclusion.
2. Literature review and theory development
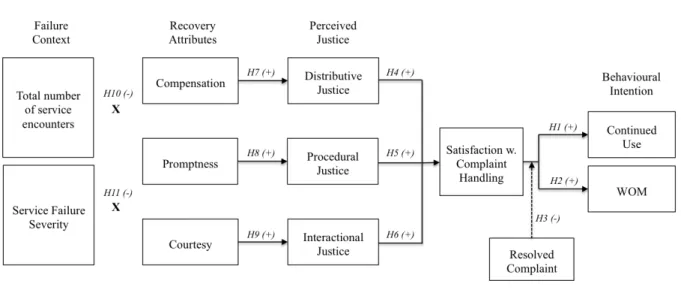
The following section develops a model along with the corresponding hypotheses in order to describe the underlying relationships for customer satisfaction with complaint handling in the context of complaint management. The goal is to explain how selected recovery attributes (compensation, speed, courtesy) affect post-complaint behaviour intentions (continued use and positive word-of-mouth) by means of perceived justice and customer satisfaction with complaint handling. The model also incorporates various failure context conditions (total number of service encounters and service failure severity) and a moderating variable (complaint status).
2.1 Satisfaction with complaint handling and behavioural outcomes
Effective customer complaint handling and thus also satisfaction with complaint handling is a crucial opportunity for companies to influence future customer behaviour by rectifying preceding service failures (Bijmolt et al., 2010). Therefore, complaint handling has the power to transform dissatisfactory encounters into satisfactory ones through the creation of positive feelings (Andreassen, 2000; Bitner et al., 1990). Based on a subjective evaluation of emotions, satisfaction can be defined as a positive feeling of fulfilment that follows the evaluation (Andreassen, 2000). Although the construct of satisfaction has also been conceptualized as overall satisfaction (e.g. Karande, Magnini, & Tam, 2007), satisfaction with complaint handling (Tax et al., 1998) is commonly used for particular complaint handling experiences (Gelbrich & Roschk, 2011).
exit (van Doorn et al., 2010). Consequently, one can conclude that new customer experiences eventually lead to an adaptation of existing customer attitudes towards the respective company and their products or services depending on the quality of service recovery and the satisfaction with complaint handling. The following sections will focus on continued use and positive word-of-mouth as two potential outcomes of satisfaction with customer complaint handling.
Continued Use Continued use refers to the willingness of doing business with the company in the future after a service recovery occurred (Liao, 2007; Weun, Beatty, & Jones, 2004). It is one of the most important constructs when measuring customer behaviour on an intentional level as it offers an indication for future purchases by the customer (Gelbrich & Roschk, 2011; Orsingher, Valentini, & Angelis, 2010). Due to the distinct differences in customer satisfaction levels, which can be elevated or exacerbated in both directions (Bitner et al., 1990), subsequent customer behaviour also ranges from continued use to switching intentions and exit (Chih, Wang, Hsu, & Cheng, 2012). Numerous similar references are found in the literature including repurchase intent, loyalty (Ruyter & Wetzels, 2000), and return intent (Orsingher et al., 2010). Moreover, it is important to emphasize that commitment is only an attitudinal aspect and thus differs from customer engagement behaviours (Orsingher et al., 2010).
contribute to the proof of the proposed relationship. The consistency across studies and various research setups leads to the following hypothesis:
H1: Satisfaction with complaint handling will lead to continued use.
Word-of-mouth Similarly to commitment, word-of-mouth (WOM) is also a customer behaviour that is frequently defined at the intentional level (Gelbrich & Roschk, 2011). WOM consist of two parts; the likelihood to spread information and the valence of the respective information (Davidow, 2003). Consequently, WOM can be constructed as the likelihood of either positive or negative WOM (Maxham III & Netemeyer, 2003). Furthermore, WOM can be a powerful tool for companies to lower the cost of customer attraction as well as improve the company’s image (Anderson & Mittal, 2000), which can eventually positively affect company revenues (Bijmolt et al., 2010).
Research in the context of post-complaint behaviour and service recovery often links positive WOM to the antecedent satisfaction with complaint handling (Kumar Piaralal et al., 2014; Wirtz & Mattila, 2004). The results show that satisfied customers are more likely to engage in positive WOM than customer who are dissatisfied with the complaint handling (Gelbrich & Roschk, 2011; Kumar Piaralal et al., 2014). In other words, being satisfied with the complaint handling stimulates customers to share their positive experience with others and promote the company. Interestingly, when distinguishing between complainants and non-complainants, Kau and Loh (2006) find that complainants are more likely to engage in WOM than non-complainants. The study thereby emphasizes the importance of carefully handling customer complaints and paying extraordinary attention to the group of complainants. Overall, following hypothesis can be formulated:
Solved Complaint Another crucial aspect of customer complaint handling is the question whether the complaint has ultimately been resolved. Although customers might be satisfied with the handling of their complaint, the fact that it is not yet completely resolved might influence future behaviour and decisions. A study by Kolodinsky (1992), researching complaint behaviour, found that the probability of a complaint being solved was significantly positively related to the number of complaints by a respondent. The same study also found a significant relationship between the probability of a complaint being solved and future purchases. Hence, being dissatisfied with the primal complaint handling, but additionally being disappointed by unresolved complaints might exacerbate any effects on behavioural outcomes. Thus, the hypothesis reads as follows:
H3: Complaints with the status ‘solved’ moderate the relationship between
satisfaction with complaint handling and behavioural outcomes.
2.2 Perceived justice and satisfaction with complaint handling
With respect to the antecedents of satisfaction with complaint handling, justice theory has been used in marketing for investigating service encounters in situations of both service failure and recovery (Orsingher et al., 2010). While the theory of justice originated in social psychology (Adams, 1965), the concept has been applied in several contexts including organizational and legal context (e.g Greenberg, 1990). The theory is based on the notion of balance that should exist in the relation between the company and a customer. Exchanges that are being made as part of a service encounter will lead to imbalance if the interaction is unsatisfactory or the outcome is not perceived as appropriate by the customer (Chebat & Slusarczyk, 2005).
dimensions of distributive, procedural and interactional justice (Chebat & Slusarczyk, 2005; Orsingher et al., 2010). Moreover, the characteristics of justice theory enable the linkage to customer satisfaction with a particular complaint handling incident, as customers tend to assess the actual complaint handling performance with respect to their prior expectations (Orsingher et al., 2010; Tax et al., 1998). Hence, if customer expectations are not being met, this will negatively affect subsequent evaluations by customers.
Due to the comprehensive nature of justice theory, it is suitable for examining complaint handling across various procedural stages ranging from initiation to completion (Tax et al., 1998). Individuals are thus enabled to assess both the outcome of a filed complaint and the underlying process, which aims at resolving the conflict (Conlon & Murray, 1996). Consequently, the present study uses justice theory in order to investigate the applicability of text-mining tools in the context of complaint management on the grounds of the theory’s established validity and applicability.
Distributive Justice Among the three different dimensions of perceived justice, distributive justice is the only dimension specifically referring to the outcome of an exchange (Gelbrich & Roschk, 2011). The outcome in this context is an equation of rewards and losses that are weighted against any investments that have been made. If the relation between two such ratios is perceived as unbalanced then a feeling of injustice arises from the exchange (Adams, 1965). It is therefore important for companies to prevent any feeling of injustice in order to prevent negative customer evaluations. Coupons, reimbursements (Conlon & Murray, 1996), or the replacement of the good or service (del Río-Lanza, Vázquez-Casielles, & Díaz-Martín, 2009) are some of the examples of how companies can try to restore distributive justice towards their customers.
al., 1999). Moreover, distributive justice is often found to exert the most significant relationship with complaint handling satisfaction (Homburg & Fürst, 2005; Orsingher et al., 2010). However, there are also studies that find a weaker correlation of the relationship between distributive justice and complaint handling satisfaction (del Río-Lanza et al., 2009). Consequently, customers perceive outcomes as either fair or unfair. While favourable outcomes are perceived as fair and lead to higher satisfaction, unfavourable outcomes that are perceived as unfair lead to lower satisfaction with the complaint handling process (Andreassen, 2000). This leads to the following hypothesis:
H4: Perceived distributive justice will lead to higher satisfaction with the complaint
handling process.
Procedural Justice In contrast to distributive justice, procedural justice “concerns the way
that decisions are made rather than the nature of those decisions themselves” (Lind & Tyler, 1988, p. 5). Processes also include complaint handling policies and rules that are used by a company to solve customer complaints (Smith et al., 1999). Due to the fact that procedural justice looks beyond outcome measures, it is particularly valuable when researching customer journeys in its entirety, as it adds valuable insights to the overall understanding of customer journeys. Procedural justice within the complaint handling process refers to the cost of effort and time invested by the customer before a complaint is resolved (Chebat & Slusarczyk, 2005). On a more detailed level, Tax et al. (1998) identified several other elements relevant for complaint evaluation, which include convenience, flexibility and control over the process, as well as easy access.
also numerous studies that prove a self-contained positive effect of perceived procedural justice on satisfaction with complaint handling (e.g. Kau & Loh, 2006; Wirtz & Mattila, 2004). In other words, if customers need to deal with time-consuming and complex processes this will eventually also affect the satisfaction with complaint handling. Thus, the corresponding hypothesis is formulated as follows:
H5: Perceived procedural justice will lead to higher satisfaction with the complaint
handling process.
Interactional Justice Closely related to the procedural justice is interactional justice, which refers to the enactment of the complaint handling procedure (Bies & Shapiro, 1987). Together with procedural justice it is therefore also part of the process dimension (Kumar Piaralal et al., 2014). At the centre of interactional justice is the quality of interpersonal treatment and communication (Greenberg, 1990) and the perceived fairness of the employee behaviour that customers experience (Homburg & Fürst, 2005). With respect to the company-customer relation, there are several factors influencing the interactional justice that is perceived by the respective customer. Examples of these factors are politeness and employee’s empathy perceived by the customer (Orsingher et al., 2010) as well as the willingness to achieve service failure recovery (Homburg & Fürst, 2005). Additionally, the appropriateness of the language used during the conversation can also impact interactional justice (Chebat & Slusarczyk, 2005).
addition to a joint effect of perceived justice on service recovery satisfaction, Wirtz and Mattila (2004) also demonstrate the effectiveness of interactional justice (e.g. an apology) for recovery strategies that are targeted at satisfying customers in a timely manner. Consequently, it is hypothesized:
H6: Perceived interactional justice will lead to higher satisfaction with the complaint
handling process.
2.3 Recovery attributes and perceived justice
Although the various customer reactions (e.g. post-complaint behaviour and justice perceptions) have been subject to numerous studies in the past, relevant antecedents are often being ignored (Maxham III & Netemeyer, 2003; Tax et al., 1998). Thereby, the potential value of analysing the immediate recovery phase and the generated social and economic interactions between a company and a customer is neglected (Miller, Craighead, & Karwan, 2000; Smith et al., 1999). In order to account for the effect of social and economic interactions of service failure processes (Smith et al., 1999), some studies include organizational responses and recovery attributes, which refer to the reactions by a company (Conlon & Murray, 1996; Smith et al., 1999). Although the number of categories varies across studies, a higher order construct of three categories covering characteristics of timeliness, compensation, and employee behaviour is commonly found to have empirical relationships with customer perceptions (Estelami, 2000; Gelbrich & Roschk, 2011). Thus, customers take these characteristics into account when evaluating their overall customer service experience. Consequently, the present study examines the influence of three different recovery attributes (compensation, promptness, and courtesy) on perceived justice evaluations (Tax et al., 1998).
Compensation can have the form of discounts, coupons, product replacements, refunds, or similar measures (Conlon & Murray, 1996). The goal of the company is to restore the customer’s confidence in the firm that was damaged as a result of a perception of loss by the customer (Estelami, 2000). Research shows that the recovery attribute compensation is associated with perceived distributive justice (Tax et al., 1998). Therefore, compensation affects the outcome of the exchange, which results in the following hypothesis:
H7: Compensation will lead to a higher level of perceived distributive justice.
Promptness Within customer complaint handling processes the issue of timing is another important recovery attribute. Promptness refers to the speed by which a service failure was recovered (Lariviere & Vandenpoel, 2005). In the case that customers file a complaint due to a perceived failure by the company a slow recovery can reinforce the initial negative picture of the company and add to the level of dissatisfaction (Bitner et al., 1990). Promptness can further be extended to the efficient control of complaint handling processes (Gelbrich & Roschk, 2011). In addition, the consequent link with procedural justice is empirically tested (Tax et al., 1998) and proves the importance of timely complaint handling with respect to process evaluations. Thus, the hypothesis reads as follows:
H8: Promptness will lead to a higher level of perceived procedural justice.
2000; Smith et al., 1999). Employee behaviour characteristics are important elements when evaluating the interactions with customer service, which leads to the following hypothesis:
H9: Courtesy will lead to a higher level of perceived interactional justice.
2.4 Boundary conditions for effectiveness of recovery attributes
Although the aforementioned recovery attributes are hypothesized to individually influence customers’ justice perceptions as well as several behavioural outcomes, there are also additional factors that indirectly alter the effects of recovery attributes.
Total number of service encounters In research the total number of service encounters
can be examined in numerous ways. Low, Lee, and Lian (2013) for example found proof of a moderating effect of transaction frequency on loyalty and the tolerance of service failure. According to Tax et al. (1998) poor complaint handling can be mitigated by prior positive experiences. In the context of granting recovery voice, results by Karande et al. (2007) show a greater impact of recovery voice on perceived procedural justice with longer customer transaction histories. Additionally, the length of a relationship can also alter customer engagement behaviour and customer satisfaction over time (van Doorn et al., 2010). Although transaction frequency and the overall length of a relationship are found to generate higher levels of service failure tolerance (Low et al., 2013), the commonly negative nature of customer service encounters should lead the opposite relationship with lower service failure tolerance over time. Thus, the hypothesis reads as follows:
H10: A greater number of service encounters will lower the positive effect of recovery
attributes and perceived justice evaluations.
moderating effects of service failure severity (Kumar Piaralal et al., 2014; Smith et al., 1999; Weun et al., 2004). A study by Conlon and Murray (1996) researched problem severity by using the measure of product price and their results showed a negative relation to satisfaction with the explanations by the company and repurchase intention. This shows that for example the effect of explanations provided differs across different service failure severity levels and is thus limited. Because in the context of customer complaint handling it can be assumed that not all incidents are equally severe (Lariviere & Vandenpoel, 2005), it is hypothesized:
H11: Increased service failure severity will lower the positive effect of recovery
attributes and perceived justice evaluations.
Figure 1 is a representation of the underlying processes that are part of service recovery and complaint handling. The figure summarizes all relevant variables and their hypothesized interactions in accordance to their development in chapter 2.
3. Method
The research was initiated in collaboration with a major German telecommunication company. The marketing department of the company provided the data for conducting the research. The data set consisted of secondary data that was gathered prior to the research (between 2012 and 2013) and combined two different internal sources of data: internal customer relationship management (CRM) system and customer feedback questionnaires. In order to ensure the usefulness of the data both the information and sample quality were checked (Blumberg, Cooper, & Schindler, 2011).
Although the data was investigated previously, it was decided to use the data for another research based on two main arguments. First, the data set links two previously separate data sets, thus making it possible to combine collected data from the internal CRM system with the customer experience management (CXM) system. The approach is in line with recent developments, which advocate a shift in focus from CRM to one that manages customer experience holistically as part of their integration (Ab Hamid & Akhir, 2013; Goldenberg, 2013). Second, both data sets include unstructured data that originate from open text fields and thereby allows the use of text-mining-assisted analysis for information extraction (Ordenes et al., 2014). In contrast to structured data that results from standardized customer feedback questionnaires and thereby primarily measures predefined dimensions (Caemmerer & Wilson, 2010), rich textual data enables the extraction of more in-depth information (Khare & Chougule, 2012).
3.1 Context
of telecommunication companies. Iwashita, Shimogawa, and Nishimatsu (2011) proposed a classification technique in order to analyse customer enquiries that were stored by agents of a telecommunication company. As a result, it was possible to efficiently analyse large amounts of unstructured textual data. The examples show that text mining can be of great value when analysing unstructured textual data by providing additional insights. However, when analysing an industry such as the telecommunication industry it is important to keep in mind the structural factors that characterize an industry. Examples of structural factors can be contracts, switching costs, and the availability of alternatives, which can influence behavioural customer intentions (Kau & Loh, 2006; Tax et al., 1998) and are present in the context of most telecommunication services. Switching costs for example are able to positively influence repurchase intentions despite a relatively low level of customer satisfaction (Jones, Mothersbaugh, & Beatty, 2000). Hence, the characteristics of the industry play an important role for any conclusions to be made.
structural elements (Shostack, 1987). The technique provides a visible overview of often times complex service processes (Shostack, 1987). Figure 2 is an exemplary representation of a service blueprint for an overnight hotel stay (Bitner, Ostrom, & Morgan, 2008). The figure illustrates the respective touch points in simplified terms and differentiates between the visible and invisible layer, thereby highlighting the complexity of many services. Similarly, the overall complaint handling experience and consequent service recovery is a process of multiple interactions that trigger discrete outcomes (Tax et al., 1998). For companies operating in the context of services it is therefore important to keep in mind that the customer’s overall experience is a sum of multiple contact points. As a result, it is difficult for companies to improve customer experience in a targeted fashion.
3.2 Sample and procedure
made via various channels (i.e. in-store and by correspondence), but mainly through the company’s customer service hotline. Although the input by an agent is based on some general guidelines that specify required information for input, the actual description still varies a lot between individual agents (Iwashita et al., 2011). It is important to note that the data does not provide a complete transcript of the conversation between the customer and the agent. Instead it is a personal summary by the agent, which describes the specific customer enquiry and the actions that were taken in response. For instance in one specific case the agent noted that he called back the customer upon their request, informed the customer that there were no news regarding the current enquiry, and asked the customer for patience. Consequently, the available information is limited to the actual input of the agent.
feedback questionnaires consisted predominantly of structured data as Likert-type questions were employed on a five-point scale. In order to account for the restricted sample all relevant discrete variables were dichotomized with a median split, which resulted in high/low groups for each variable (MacCallum, Zhang, Preacher, & Rucker, 2002). Moreover, the data set also provided textual data, as one of the relevant questions asked customers to describe negative aspects relating to the handling of their complaint.
In order to transform the textual data into numerical data the process of content analysis was used, which establishes a framework based on measurable and quantifiable categories (Chang et al., 2009). Thus, content analysis enables both valid and replicable inferences from the textual data (Krippendorff, 1980). First, the available data within both sources was screened and selected based on the research objectives. All CRM data entries were restructured in order to conform to the structure of customer feedback questionnaire data. Additional data cleansing further improved the quality of the data and resulted in a final sample of 273 unique customer feedback questionnaires, which could be matched with an average of about four CRM data entries (total of 1,068) for each customer. Second, all textual data was coded based on the themes and theories identified. As part of the prescriptive analysis individual dictionaries with keywords were created manually for each of the respective variables (Blumberg et al., 2011). Because of the limited size of the two data sets, Microsoft Excel software was used for the coding process. Third, all relevant variables were imported into IBM Statistical Package for Social Science Statistics for statistical analysis.
regression is generally employed for predictor variables that are a combination of both categorical and continuous variables (Wuensch, 2014). The resulting function indicates the probability that the studied subject will end up in the respective category (Wuensch, 2014).
3.3 Measures
Behavioural intention Both continued use as well as word-of-mouth (WOM) are based
on the original customer feedback survey, which employed a five point Likert-scale for their measurement. In order to account for the range restrictions of the sample the variable was dichotomized with a median split. Consequently, for continued use the value 0/1 represents a low/high probability for the future use of the company’s products and services based on the experience by the customer. For WOM the value 0/1 represents a low/high probability for recommending the company to friends and acquaintances based on the experience by the customer.
Satisfaction with complaint handling Satisfaction with complaint handling is based on
the original customer feedback survey, which employed a five point Likert-scale for measurement. In order to account for the range restrictions of the sample the variable was dichotomized with a median split. Consequently, the value 0/1 represents a low/high satisfaction with the experience with respect to the complaint.
Perceived justice All dimensions of perceived justice and the respective variables are
the customer as part of the complaint (Chebat & Slusarczyk, 2005). The dictionary for interactional justice consists of words that describe the interpersonal treatment and communication (Greenberg, 1990), including aspects of politeness, employee’s empathy (Orsingher et al., 2010), and explanations (Bies & Shapiro, 1987).
Recovery attributes The variables that are used to represent the selected recovery
attributes originate from textual data entries by the agents within the company CRM system. All variables are dummy coded with values of 0/1, which represent the absence/presence of the respective recovery attribute, and employ separate dictionaries. The dictionary for compensation combines various forms of financial indemnification (Lariviere & Vandenpoel, 2005), including coupons, discounts, refunds, and product replacements (Conlon & Murray, 1996). Although the variable promptness refers to a speedy handling of the complaint (Lariviere & Vandenpoel, 2005), its dictionary consists of words that describe situations where the complaint processing was postponed or internally forwarded. Consequently, for this variable the coding was reversed in order to match the direction of the other two variables. The dictionary for courtesy consists of words that describe positive aspects of employee behaviour like politeness, empathy, informative behaviour (Bies & Shapiro, 1987; Estelami, 2000), and apology (Smith et al., 1999).
Total number of service encounters The number is based on the original customer
feedback survey, which employed a question asking about the total number of times the customer made contact with company regarding the complaint. Although this discrete variable relies on customer judgement, internal company investigation proved that the responses represent a valid measurement. Moreover, including the total number of service encounters complements the research objective of accomplishing a holistic view.
Service failure severity The variable service failure severity was generated based on
4. Results
The results of the study are presented in the same order as the hypotheses were developed within the literature review and theory development. Inter-correlations and descriptive statistics including mean values and standard deviations are presented in table 2. The magnitude of the correlation coefficients indicates a low correlation between the independent variables. The results of the binary logistics regression analyses are presented in this chapter.
and WOM with significance at the 0.01 level and thereby providing support for hypotheses 1 and 2. Consequently, high satisfaction with the complaint handling increases the likelihood of the two behavioural outcomes by a factor of 309.7 % for continued used and 576.9 % for WOM. Hypothesis 3 predicted a moderating effect by the status of the complaint on the relationship between satisfaction with complaint handling and behavioural outcomes. The results indicate that the interaction variable is not significant (p-value of 0.279 for the dependent variable continued use and 0.101 for the dependent variable WOM), which provides no support for hypothesis 3. However, table 3 and 4 also indicate a significant positive relationship of the status of the complaint with the two behavioural outcome variables at the 0.05 level.
perceived justice dimension only interactional justice appears to be significant (p-value of 0.015) and thus providing support for hypothesis 6. Consequently, cases where interactional justice was achieved from the customer perspective increase the likelihood of a high level of satisfaction with the complaint by a factor of 107.6 %. Hypothesis 4 (p-value of 0.997) and 5 (p-value of 0.210) are not supported.
Following the extension to a four-dimensional perceived justice model the recovery attributes were adapted in order to fit the four-dimensional structure. In line with the other recovery attributes, explanations are hypothesized to lead to higher ratings of fairness (Bies & Shapiro, 1987). According to a study by Estelami (2000) adequate information also leads to consumer delight compared to consumer dissatisfaction. Consequently, the original dictionary for the recovery attribute courtesy was split into courtesy and explanations with courtesy referring to apologetic actions and explanations referring to informative actions (see appendix C). The omnibus test of model coefficients was performed for the models of interactional and informational justice, but fails to report significant chi-square values (p-value of 0.247 for interactional justice and p-value of 0.427 for informational justice). However, additional backwards stepwise logistic regression analyses reports a significant test for interactional justice square of 9.420, df of 4, and p-value of 0.051) and for informational justice (chi-square of 7.813, df of 1, and p-value of 0.005). Thus, there is support for the significance of the predictors as part the original analyses. Furthermore, the models show improved classification percentages and classify 58.5 % (for interactional justice) and 71.0 % (for informational justice) of cases correctly. The results of the binary logistics regression analysis show that none of the hypothesized recovery attributes significantly influences interactional or informational justice. However, the results show that the discrete variable total numbers of service encounters negatively affect interactional justice (p-value of 0.033) and informational justice (p-value of 0.007), thereby adding further support for hypothesis 10. Additionally, as part of the four-dimensional model a significant interaction effect of the recovery attributes promptness and courtesy exists on interactional justice at the 0.1 level (p-value of 0.085). Thus, promptness decreases the effect of courtesy on interactional justice by a factor of 70.6 % (see appendix D).
5. Discussion
The main objective of this research is to investigate the question whether unstructured data collected from customer relationship management (CRM) and customer experience management (CXM) systems can be used to infer succeeding customer evaluations. By identifying specific recovery attributes from CRM data and linking those to their complementing dimensions of perceived justice as part of CXM data, it was found that the individually composed hypothesized sequence of ‘courtesy
→
interactional justice→
satisfaction with complaint handling’ is significant and positive. In this sequence there is a negative effect of the number of total service encounters on the justice dimension of interactional justice. In addition, satisfaction with the complaint handling leads to the behavioural intentions of continued use and positive word-of-mouth (WOM). The results show that there is predictive power resulting from the combination of unstructured CRM and CXM data into one overarching construct. Consequently, under the proposed research setup the findings partially affirm existing theoretical principles in the context of complaint handling experiences (e.g. Colquitt, 2001; Smith et al., 1999; Tax et al., 1998).5.1. Interpretation of findings
on continued use, which is consistent with another finding by Kau and Loh (2006). In contrast to what was hypothesized, complaints with the status solved are not found to moderate the relationship between satisfaction with complaint handling and behavioural outcomes, but instead there is a significant direct relationship to both behavioural outcome variables. An explanation could be nature of the variable, which relates to the outcome of a complaint and should therefore be seen as an antecedent to succeeding customer evaluations. Support is provided by the significant correlation, although low in value, between the variable of complaint status and distributive justice (see table 2), which is the only perceived justice dimension that links to the outcome of the exchange (Gelbrich & Roschk, 2011).
justice is still the only dimension with a significant effect on customer satisfaction with complaint handling. In accordance with findings by Colquitt (2001), who reports differential effects of interactional and informational justice in the organizational context, the results of this study suggest a breakdown into interactional and informational justice for the context of service recovery.
recovery. With regard to the impact of the total number of service encounters the results of the four-dimensional model are in line with the results of the main model and provide additional support for its negative effect on perceived justice (i.e. interactional and informational justice). Interestingly, the results of four-dimensional model also present a significant negative interaction effect of promptness on the relationship between the recovery attribute courtesy and interactional justice. Given the hypothesized positive direct effect of promptness on procedural justice the results are contradictory to the original expectations. Previous findings hint towards the ambiguity of promptness. Wirtz and Mattila (2004) for example argue that speedy recovery can also induce customers to think the service provider had control over the failure in the first place, thus increasing customer's attributions of controllability and generating negative associations with speedy recovery. Similarly, a prompt customer complaint handling limits the opportunity to bring forth signals of courtesy, which ultimately will limit the impact of the recovery attribute of courtesy (Chebat & Slusarczyk, 2005). Thus, although a prompt complaint handling might be of positive nature on an individual level, it can damage and decrease the effect of other recovery attributes that require some time to be established.
5.2 Practical implications
Furthermore, this opens up additional measuring possibilities within the realm of service recovery for the company, because unstructured data often times carries multiple factors for analysis (Ordenes et al., 2014), which enables the discovery of more latent knowledge (Chang et al., 2009). Consequently, it is worthwhile to investigate the possibility of extending the scope of data collection. For example, one option might be to record conversations between the agent and the customer word-for-word. This would allow for a more extensive analysis, which could for example include sentiment analysis (Setiawan, 2014).
interactional justice it is only the particular behaviour by the agent (e.g. courtesy, making an apology), which has a significant impact. In light of the underlying setup of the research study at hand, which was limited to a sample of the most dissatisfied customers, the implications and insights could potentially make the difference between exit of a customer and continuation of business.
Despite the fact that the focus of the study is on analysing unstructured data, there is also room for drawing implications with respect to structured data in the form of customer feedback questionnaires. Standardized customer feedback questionnaires tend to rely on predefined quality dimensions, which can lead to superficial information in case the standards for the measures are not set properly (Caemmerer & Wilson, 2010; Ordenes et al., 2014). However, through the analysis of unstructured feedback it is possible to gain better insights on customer experiences (Ordenes et al., 2014) and adapt existing standard questionnaires accordingly. Based on the fact that the company currently is not measuring the agent’s courtesy in any dimension it is advisable to add a comparable dimension in the future. This will allow the company to track courtesy ratings over time and to take actions accordingly.
5.3 Limitations and future research
adaptations. Thus, future research should extent the present study, which can be seen as a pilot study due to the mentioned constraints, with more balanced data.
Secondly, all dictionaries used for the coding of the variables were generated by manual categorization, which limits the quality of the dictionaries to the subjective assessment of the coder. Furthermore, the quality of the data itself imposes an additional constraint on the analysis. In contrast to the unstructured data from the customer feedback questionnaires, the unstructured data extracted from the CRM system was limited with respect to its richness. One reason is that the agents generated the transcripts under time pressure, which also leads to the increased use of abbreviations. Consequently, the dictionary for the service recovery attribute variable promptness consists of only seven individual terms (see appendix A) due to the fact that the measure of time was difficult to identify as part of the provided data. In addition to the use of word-by-word recordings of conversations between the agent and the customer, future research should consider the use of linguistic techniques that analyse text with respect to natural language characteristics, which could improve the quality of categorization (Ordenes et al., 2014).
6. Conclusion
References
Ab Hamid, N. R., & Akhir, R. M. (2013). Beyond technology-‐based customer relationship management – It is total customer experience management. Research in Business & Economics Journal, 8.
Adams, J. S. (1965). Inequity in social exchange. Advances in Experimental Social Psychology, 2, 267–299.
Anderson, E. W., & Mittal, V. (2000). Strengthening the satisfaction-‐profit chain. Journal of Service Research, 3(2), 107–120.
Andreassen, T. W. (2000). Antecedents to satisfaction with service recovery. European Journal of Marketing, 34(1/2), 156–175.
Badawi, S. (2012). Justice and customer emotion’s effect on complaint handling satisfaction: A survey on complaint attitude handling. International Journal of Innovation, Management and Technology, 3(5), 573–579.
Bies, R. J., & Shapiro, D. L. (1987). Interactional fairness judgments: The influence of causal accounts. Social Justice Research, 1(2), 199–218.
Bijmolt, T. H. A., Leeflang, P. S. H., Block, F., Eisenbeiss, M., Hardie, B. G. S., Lemmens, A., & Saffert, P. (2010). Analytics for customer engagement. Journal of Service Research, 13(3), 341–356.
Bitner, M. J., Booms, B. H., & Tetreault, M. S. (1990). The service encounter: Diagnosing favorable and unfavorable incidents. Journal of Marketing, 54(1), 71–84.
Bitner, M. J., Ostrom, A. L., & Morgan, F. N. (2008). Service blueprinting: A practical technique for service innovation. California Management Review, 50(3), 66. Blumberg, B., Cooper, D. R., & Schindler, P. S. (2011). Business Research Methods (3rd
Caemmerer, B., & Wilson, A. (2010). Customer feedback mechanisms and organisational learning in service operations. International Journal of Operations & Production Management, 30(3), 288–311.
Chang, C.-‐W., Lin, C.-‐T., & Wang, L.-‐Q. (2009). Mining the text information to optimizing the customer relationship management. Expert Systems with Applications, 36(2), 1433–1443.
Chebat, J.-‐C., & Slusarczyk, W. (2005). How emotions mediate the effects of perceived justice on loyalty in service recovery situations: An empirical study. Journal of Business Research, 58(5), 664–673.
Chih, W.-‐H., Wang, K.-‐Y., Hsu, L.-‐C., & Cheng, I.-‐S. (2012). From disconfirmation to
switching: An empirical investigation of switching intentions after service failure and recovery. The Service Industries Journal, 32(8), 1305–1321.
Colquitt, J. A. (2001). On the dimensionality of organizational justice: A construct validation of a measure. Journal of Applied Psychology, 86(3), 386–400.
Conlon, D. E., & Murray, N. M. (1996). Customer perceptions of corporate responses to product complaints: The role of explanations. Academy of Management Journal, 39(4), 1040–1056.
Davidow, M. (2003). Organizational responses to customer complaints: What works and what doesn’t. Journal of Service Research, 5(3), 225–250.
Del Río-‐Lanza, A. B., Vázquez-‐Casielles, R., & Díaz-‐Martín, A. M. (2009). Satisfaction with service recovery: Perceived justice and emotional responses. Journal of Business Research, 62(8), 775–781.
Estelami, H. (2000). Competitive and procedural determinants of delight and
Gelbrich, K., & Roschk, H. (2011). A meta-‐analysis of organizational complaint handling and customer responses. Journal of Service Research, 14(1), 24–43.
Goldenberg, B. (2013). The emerging integration of CEM and CRM. CRM Magazine, 17(1), 6–6.
Greenberg, J. (1990). Organizational justice: Yesterday, today, and tomorrow. Journal of Management, 16(2), 399.
Homburg, C., & Fürst, A. (2005). How organizational complaint handling drives customer loyalty: An analysis of the mechanistic and the organic approach. Journal of
Marketing, 69(3), 95–114.
Iwashita, M., Shimogawa, S., & Nishimatsu, K. (2011). Semantic analysis and
classification method for customer enquiries in telecommunication services. Engineering Applications of Artificial Intelligence, 24(8), 1521–1531.
Jones, M. A., Mothersbaugh, D. L., & Beatty, S. E. (2000). Switching barriers and repurchase intentions in services. Journal of Retailing, 76(2), 259–274. Karande, K., Magnini, V. P., & Tam, L. (2007). Recovery voice and satisfaction after
service failure: An experimental investigation of mediating and moderating factors. Journal of Service Research, 10(2), 187–203.
Kau, A.-‐K., & Loh, E. W.-‐Y. (2006). The effects of service recovery on consumer
satisfaction: A comparison between complainants and non-‐complainants. Journal of Services Marketing, 20(2), 101–111.
Khare, V. R., & Chougule, R. (2012). Decision support for improved service effectiveness using domain aware text mining. Knowledge-‐Based Systems, 33, 29–40.
Krippendorff, K. (1980). Content analysis: An introduction to methodology (1 edition.). Beverly Hills: Sage Publications, Inc.
Kumar Piaralal, N., Kumar Piaralal, S., & Awais Bhatti, M. (2014). Antecedent and outcomes of satisfaction with service recovery: A study among mobile phone users in Central Region of Malaysia. Asian Social Science, 10(12), 210–221.
Lariviere, B., & Vandenpoel, D. (2005). Investigating the post-‐complaint period by means of survival analysis. Expert Systems with Applications, 29(3), 667–677.
Lee, P., & Stewart, D. (2014). Technology, media & telecommunications predictions 2014. Retrieved June 21, 2014, from http://www.deloitte.com
Liao, H. (2007). Do it right this time: The role of employee service recovery performance in customer-‐perceived justice and customer loyalty after service failures. Journal of Applied Psychology, 92(2), 475–489.
Lind, E. A., & Tyler, T. R. (1988). The social psychology of procedural justice (1988 edition.). Springer Science & Business Media.
Low, W.-‐S., Lee, J.-‐D., & Lian, W.-‐C. (2013). Can loyal customers tolerate service failure? The moderating roles of service failure severity and transaction frequency in a B2B context. Journal of Service Science and Management, 06(05), 12–19.
MacCallum, R. C., Zhang, S., Preacher, K. J., & Rucker, D. D. (2002). On the practice of dichotomization of quantitative variables. Psychological Methods, 7(1), 19–40. Maxham III, J. G., & Netemeyer, R. G. (2003). Firms reap what they sow: The effects of
shared values and perceived organizational justice on customers’ evaluations of complaint handling. Journal of Marketing, 67(1), 46–62.
Miller, J. L., Craighead, C. W., & Karwan, K. R. (2000). Service recovery: A framework and empirical investigation. Journal of Operations Management, 18(4), 387–400. Net promoter benchmarks report. (2013). Retrieved from
http://www.satmetrix.com/net-‐promoter/industry-‐benchmarks/
Ngai, E. W. T., Xiu, L., & Chau, D. C. K. (2009). Application of data mining techniques in customer relationship management: A literature review and classification. Expert Systems with Applications, 36(2), 2592–2602.
Nikbin, D., Ismail, I., & Marimuthu, M. (2013). The relationship between informational justice, recovery satisfaction, and loyalty: The moderating role of failure
attributions. Service Business, 7(3), 419–435.
Ordenes, F. V., Theodoulidis, B., Burton, J., Gruber, T., & Zaki, M. (2014). Analyzing customer experience feedback using text mining: A linguistics-‐based approach. Journal of Service Research, 17(3), 278–295.
Orsingher, C., Valentini, S., & Angelis, M. (2010). A meta-‐analysis of satisfaction with complaint handling in services. Journal of the Academy of Marketing Science, 38(2), 169–186.
Rust, R. T., & Zaborik, A. J. (1993). Customer satisfaction, customer retention, and market share. Journal of Retailing, 69(2), 193.
Ruyter, K. de, & Wetzels, M. (2000). Customer equity considerations in service recovery: A cross-‐industry perspective. International Journal of Service Industry
Management, 11(1), 91–108.
Shostack, G. L. (1987). Service positioning through structural change. Journal of Marketing, 51(1), 34.
Smith, A. K., Bolton, R. N., & Wagner, J. (1999). A model of customer satisfaction with service encounters involving failure and recovery. Journal of Marketing Research, 36(3), 356.
Tax, S. S., Brown, S. W., & Chandrashekaran, M. (1998). Customer evaluations of service complaint experiences: Implications for relationship marketing. Journal of Marketing, 62(2), 60–76.
Van Doorn, J., Lemon, K. N., Mittal, V., Nass, S., Pick, D., Pirner, P., & Verhoef, P. C. (2010). Customer engagement behavior: Theoretical foundations and research
directions. Journal of Service Research, 13(3), 253–266.
Wang, Y.-‐S., Wu, S.-‐C., Lin, H.-‐H., & Wang, Y.-‐Y. (2011). The relationship of service failure severity, service recovery justice and perceived switching costs with customer loyalty in the context of e-‐tailing. International Journal of Information
Management, 31(4), 350–359.
Weun, S., Beatty, S. E., & Jones, M. A. (2004). The impact of service failure severity on service recovery evaluations and post-‐recovery relationships. Journal of Services Marketing, 18(2), 133–146.
Wirtz, J., & Mattila, A. S. (2004). Consumer responses to compensation, speed of recovery and apology after a service failure. International Journal of Service Industry
Management, 15(2), 150–166.
Appendices
A. Dictionaries
B. Inter-rater agreement for severity measure
C. Dictionaries for model extension
D. Logistics regression analysis for model extension