Choice Criteria in
Retail Banking
Pietro Cagnina
Dissertation written under the supervision of Ana Isabel de
Almeida Costa
Dissertation submitted in partial fulfilment of requirements for the
International MSc in Management, at the Universidade Católica
To my parents and my sister, for their unconditional support and for believing in me.
To all the people who assisted me in drafting this final work, my advisors and my friends.
Abstract (English)
This study strives to understand the relevance of different choice criteria in the selection of a retail bank. Based on the answers of 152 US consumers to an online questionnaire, we first determined the importance of seven criteria through conjoint-analysis; the most important one was shown to be branch location, followed by quality of service and cost. We then found that consumers can be grouped into three segments depending on their preferences on evaluative criteria: a balanced-choice group, a location-oriented one and lastly a cost-oriented group. Our questionnaire also measured level of financial knowledge, both subjectively and objectively, enabling us to test the following hypothesis: is there a relationship between financial knowledge and evaluative criteria? A positive answer was found. More knowledgeable consumers considered different criteria or focused on cost, while less knowledgeable ones tended to heavily rely on location. Our findings carry relevant strategic implications for retail banks, suggesting to pay particular attention to restructuring of branch networks, given how important is branch location for a relevant group of customers. This study provides also a segmentation tool useful for the targeting of different groups of consumers.
Abstract (Português)
Este estudo pretende compreender a relevância de vários critérios de escolha do consumidor na banca de retalho. Com base nas respostas de 152 consumidores norte-americanos a um inquérito on-line,determinou-se a importância de sete critérios através da análise conjunta. Verificou-se que o critério mais relevante é a localização da filial bancária, seguidoda qualidade do serviço e do custo. Seguidamente, constatou-se que os consumidores podem ser agrupados em três segmentos em função da importância atribuída aos diferentes critérios: um grupo de escolha equilibrada, um orientado para a localização da filial e, finalmente, um grupo sensível aos custos do serviço. O nível de conhecimento financeiro dos inquiridos foi também medido, tanto subjetivamente quanto objetivamente, o que permitiu testar a seguinte hipótese: existe relação entre conhecimento financeiro e a importância relativa critérios avaliativos?Os resultados obtidos parecem confirmar esta hipótese - os consumidores mais conhecedores consideraram critérios diferentes ou concentraram-se nos custos, enquanto os menos conhecedores tenderam a fazer depender fortemente a sua escolha da localização da filial. Estes resultados têm implicações estratégicas importantes para a banca de retalho, sugerindo que se preste especial atenção à reestruturação de redes de agências, dada a importância da localização de filiais para um grupo relevante de clientes. Este estudo fornece também uma ferramenta útil para a segmentação de diferentes grupos de consumidores na banca de retalho.
1
Index
1. Introduction………3
2. Literature………5
2.1. Choice criteria
2.2. Conjoint analysis and information overload
2.3. Choice overload
3. Methodology………...13
3.1. Sample and data collection
3.2. Questionnaire
3.3. Data analysis
4. Results and discussion……….18
4.1. Socio-demographics and financial knowledge
4.2. Banking behaviour and choice criteria
4.3. Cluster analysis and drivers for choice criteria
4.4. Discussion
5. Conclusions, limits and future research……….29
Appendices……….38
Bibliography………54
3
1. Introduction
Identifying the most important choice criteria taken into account by consumers when making a purchase is of paramount importance for companies and their managers. A lot of research has been done on goods, in particular durable ones (Schmidt & Spreng, 1996), while relatively fewer studies focused on services. Nonetheless, several academic articles investigated consumer choices when it comes to intangible products. In particular, interest about selection of financial services has been growing over the past decade. This is due both to the change of the competitive environment in the retail banking industry and the aftermath of the financial crisis (Ricci & Caratelli, 2014). Bothelements are pushing the industry in the same direction, that is, intomaking more instruments availablefor customers to evaluate which financial products, and therefore which providers, fit their needs better.
Growing competition in the retail banking sector is due to the end of its traditional oligopolistic structure. This is an incentive for banks to put more effort in satisfying consumers, includingby increasing transparency about their offers. In addition, the consequences of the financial crisis in terms of retail banks’ reputation cannot be ignored. In fact, consumer distrust about financial institutions and the information they provide reached an all-time high in the aftermath of the crisis (Optem Eurobarometer, 2008).
At the same time, the global financial crisis made sector regulators acutely aware of the crucial role played by the (un)informed choices of consumers. Consequently, they have pushed for stricter rules on transparency and asked banks to facilitate switching from one financial service provider to another. A case in point is what happened in the EU: at first, the banking sector was asked by the Commission to self-regulate on these matters and this resulted in the adoption of the Common Principles of Account Switching by the European Banking Industry Committee, published in December 2008. Adoption by retail banks across the EU was expected by November 1st 2009. However, a report by the
EBIC itself in 2010 (Report on the implementation of the EBIC common principles on
account switching) as well as investigations conducted by the Commission in 2009
4
EU Commission press release) revealed that the implementation of the Common
Principles was not yet a reality in many Member States. Therefore, a new binding directive regulating account switching, comparability of payment account fees and access to payment accounts was drafted and became law on the 23rd of July 2014
(Directive 2014/92/EU). Similar actions were taken for making information on consumer credit easier to understand andcompare (Directive 2008/48/EC). The aim was precisely to enhance transparency in the retail banking sector and provide more instruments that increased public understanding of all the terms and conditions offered by different financial service providers.
As a consequence of this environmental and regulatory shift, retail banks find themselves in the position of having to make crucial choices as to how to best direct their marketing efforts. For instance, they need to decide whether it is better to invest in marketing campaigns to re-build reputation, or focus resources on re-designing product range, or even if a quick and friendly service is more relevant than low fees and charges. The decision on what aspects to prioritize should obviously be determined to a large extent by what consumers reallyvalue and take into account when selecting their bank, i.e., their choice criteria.
In view of this, this paper focuses on identifying consumers’ relevant criteria when it comes to the choice of retail banking services. In addition, it also investigates the influence of external factors, namely consumers’ level of financial knowledge (subjectively and objectively assessed), on choice criteria, with the goal of segmenting the market accordingly.These research questions carry important managerial implications, since they give insights on how to optimize the use of resources. In particular, identifying what criteria different kinds of customers prioritize according to their level of financial literacy provides an effective tool for segmentation and targeting purposes. In addition to the relevance for financial institutions operating in the retail banking industry, this study and its findings may also contribute to the literature supporting regulators of the industry. As we saw earlier, the focus has been clearly on pushing banks to provide detailed and clear financial information to consumers. In response to that, this study assesses what role information regarding elements, such as product range, have on theconsumer decision-making process.
5
2. Literature review
2.1. Choice criteria
Past research has extensively investigated choice criteria for both products and services. Its focus, however, has traditionally been skewed towards the firstrather than the latter (Schmidt & Spreng, 1996). This is mainly related to the fact that services are usually harder for consumers to evaluate than, for instance, durable goods. Financial services, in particular, show two peculiar characteristics: high consumer-supplier interactivity for long periods of time (two-way information flows and high number of transactions) and fiduciary responsibility, that is the importance of trust in the supplier, given that the customer has no way to evaluate the quality of service ex-ante (Ricci & Caratelli, 2014). Trust is crucial in financial services given that customers seek advice from their account manager or financial advisor, or even delegate decisions to them. Moreover, results obtained from the study of choice criteria for durable goods are not fully applicable to services, given their intangibility, inseparability and highly experiential nature.
Notwithstanding these difficulties, choice criteria for retail banks have been the object of a number of studies. One of the first dates back to 1976 (Anderson, Cox & Fulcher, 1976), showing that the main criteria for retail bank selection were friends’ recommendations, reputation, availability of credit, friendliness and service charges on checking accounts. However, the same study revealed that consumers were heterogeneous in terms of the importance they attributed to different types of criteria: one group saw banking services mainly as commodities with little differentiation among them in terms of attributes (convenience-oriented), whereas another prioritized credit availability as a choice criteria and thought that banks actually differed along criteria, such as friendliness and interest charges (service-oriented). The presence of these two consumer segments is a recurring element in literature, which consequently strove to understand the drivers of such a market segmentation. Devlin (2002) observed
6
that although all consumers seemed to base their choice mainly on extrinsic attributes, i.e., those that are not product-specific, such as brand and advertising, some of them also took intrinsic ones into account when selecting a bank, such as interest rates, fees and service features. The key factor discriminating these consumers was their relative level of financial knowledge (Devlin, 2002). In spite of these recurring themes, some studies have yielded contrasting results. A study conducted in Sweden, for example, surprisingly revealed that consumers’ choice of retail bank was often random, with no specific attribute or set of attributes being determinant (Martenson, 1985). The reason behind this peculiar finding is highlighted by the researcher herself: back in the mid-80’s customers in Sweden could use branch offices of any bank to withdraw money, while in the US and elsewhere customers could only use this service at their own bank branches. This led many Swedish customers to perceive banks as undifferentiated and therefore to a more random choice.
More recent research shows that bank choice criteria differ depending on tenure. While short tenure customers were observed to use recommendations as their main criterion, long tenure ones appeared to base their choice on branch location instead (Devlin & Gerrard, 2004). This suggests a gradual shift in the relative relevance of choice criteria: while extrinsic attributes still play a dominant role, mainly thanks to a growing reliance on recommendations, intrinsic cues (such as product range, fees, charged and interest rate) seemed to be increasingly taken into account, especially by customers with some financial knowledge (Devlin et
al., 2004; Ricci et al., 2014). However, there is no unanimous agreement about
this trend. For instance, as far as an important intrinsic attribute, such as product range, is concerned, different studies draw different conclusions: on one hand product range scores 6th out of 11 criteria in Devlin (2002) and is characterized
by an increasing relevance according to Devlin et al. (2004), but on the other hand, product range plummets to the 11th position out of 13th criteriaaccording to
Ricci et al. (2014).
Suchcontrasting results are common in literature on retail bank choice and are likely due to methodological issues to a large extent. Extant studies have been
7
mainly conducted using secondary, cross-sectional data. For instance, most of the abovementioned studies (Martenson, 1985; Devlin, 2002; Devlin et al., 2004; Ricci et al., 2014) used secondary data. Using secondary data is not a drawback by itself. In fact, they might be reliable once a careful analysis of their fit to the purpose of the study is carried out. However, it seems clear from the studies described that these researchers mostly had no input in the data collection stage and could not select the variables being recorded. This often demanded using other variables as proxy for some other proximate concepts and making the necessary adjustments. Devlin & Gerrard (2004), for instance, used the highest level of educational attainment as a proxy for financial knowledge, recognizing that such a choice was due to the nature of the data and called for some strong assumptions to hold. Moreover, prior econometric analyses have been run on data originating from a restricted sub-group of the population, mainly students, or from a specific country [e.g., studies in Finland (Kaynak, 1995) and Poland (Kennington, Hill & Rakowska, 1996)]. This has probably become a minor issue nowadays, especially across European countries, given the increasing uniformity and integration across markets. Nevertheless, it remains a relevant factor in studies carried out in the 90s or earlier on, since at that point the banking industry had really heterogeneous structures and characteristics across Europe. The review of extant studies also helps to develop some expectations about the importance of different choice criteria in retail banking. Location, for instance, is expected to score high compared to other criteria. Given the aforementioned methodological limitations, however, the approach undertaken in this dissertation entailed the collection of primary data through a questionnaire that included a conjoint analysis task(Green & Rao, 1971). Conjoint analysis is a very popular method for estimating consumers’ preferences based on attribute evaluations (Green & Srinivasan, 1990; Leigh, MacKay & Summers, 1984). Moreover, given indications of the existence of groups of consumers with different preferences for retail banking attributes, this study also included an additional segmentation step (cluster analysis) based on estimated parth-worth utilities. Lastly, a relationship between attribute importance and level of financial knowledgewas considered
8
likely. This variable was thus both subjectively and objectively assessed (Brucks, 1985) and impact on choice investigated overall, and at segment level.
2.2. Conjoint analysis and information overload
Conjoint analysis has been used since 1971 (Green et al., 1971; Green & Srinivasan, 1978). The assumption behind it is that consumers choose a product on the basis of the utility it provides, which in turn is given by sum of the utilities of each of its attributes. Naturally, the best product or service is going to be the one providing the highest overall utility. Conjoint analysis is thus an extremely powerful tool for companies wanting to assess the potential of different products or services characterized by different attribute and attribute levels. For example, an attribute of a retail bank might be branch location and its levels might be close to home, close to work, or close to usual grocery shop.
The way consumers are induced to reveal their preferences is through trade-offs. In our case, for instance, a retail bank offering a higher quality of service (meaning efficient customer service, quick service, etc.) would charge more for their services than one offering a poorer quality of service. Respondents are faced with this kind of trade-offs, so that when making their choice among different profiles they will be revealing the utility they put on each attribute at each level. Conjoint analysis enables then the estimation of individual’s preferences for different attributes and levels (parth-worth utilities) and the subsequent use of statistic inference to derive overall preferences for these attributes.
There are different types of conjoint analysis. In this dissertation, three were considered: the more classic,full-profile conjoint analysis and the more recent choice-based and self-explicated conjoint methods. Full profile consists in showing respondents descriptions of products, or even actual products, representing different combinations of attributes and levels, and asking them to rank or rate them according to likelihood of purchase. Responses then reveal the underlying importance of different attributes (Oppewal & Klabbers, 2003). Choice-based conjoint analysis is a variation of full-profileand asks respondents
9
to choose among two or more different full profile concepts of the product; the aim is to replicate a real purchasing environment. Preferences are then extracted from data generated by those choices by econometric estimation (Chrzan & Orme, 2000). Lastly, self-explicate conjoint analysis consists in asking respondents to evaluate directly the different levels of the attributes and the attributes themselves, rather than products (Chrzan et al., 2000). This involves three steps: first, the different attribute levels are shown and respondents are asked to rate the most and least desirable level for each attribute. Next, thelevels are shown again, but this time alongwith a scale from 0 to 10. The level rated as most desirable in the previous step is given a fixed score of 10 and the least desirable a score of 0; respondents then have to give a score to the other levels in between using the 1-9 scale points left. The first and second steps give us the level of preference (LOP) for each level, expressed by the score on the 0-10 scale. The third and last step consists in having a constant sum question (100) to assign to the different attributes at their most desirable level. This gives us a utility constant sum score (UCS) for each attribute.
The potential role of information overload in conjoint analyses tasks has been widely discussed, given the need for respondents to consider a great deal of attributes, levels and products (Malhotra, 1982; Malhotra, 1984; Lines & Denstadli, 2004). In theory, a full profile method with fractional design should be feasible with a maximum of six attributes (Hair, 2009), without the danger of overloading respondents with information. This is however just an indicative number. The real threshold depends on the nature and characteristics of the profiles, attributes and levels, but also on the knowledge and motivation ofrespondents (Lines et al., 2004). These, in turn, determine the maximum level of information a respondent is able to handle before being overloaded by information. The same holds true for choice-based conjoint analysis. In a situation of information overload, attributes and levels are not evaluated rationally anymore, but shot-cuts (or non-compensatory decision-making processes) come into place, such as considering just one attribute of the profile and fully disregarding the remaining ones. Consequently, the data obtained from a
10
conjoint analysis in which a respondents suffer from information overload is likely to be unreliable.
It is further proposed that information overload might be more likely to occur when choosing a retail bank than many other goods or services, given the importance of financial knowledge and decision motivation in this case. Low levels of product knowledge and low motivation are known to make information overload more likely to occur (Malhotra, 1984). Moreover,the amount of information consumers can handle when it comes to deciding about financial services is positively associated to their level of financial knowledge, implying that a lower level of knowledge increases the likelihood of information overload to occur (Agnew & Szykman, 2005). In our case, the level of financial knowledge of the respondents is not known beforehand, so it is impossible to control for its likely impact on conjoint results a priori. Secondly, motivation, when it comes to financial decisions, is not as high as in other consumption areas, especially among low-income consumers, which tend not to differentiate much between retail bank offers (Anderson et al., 1976).
Following all these considerations, the risk of running a full-profile conjoint analysis or a choice based conjoint analysis with fractional factorial design was deemed to be too high. Consequently, the self-explicated conjoint method was selected. Literature provides contrasting results as to the performance of self-explicated conjoint analysis relatively to other methods (Kapur, Kumar, Banqa & Surana, 2008). According to Oppewal & Klabbers (2003), full-profile conjoint analysis provides better results when compared to self-explicated methods. However, according to Srinivasan and Park (1997), the self-explicated approach has better predictive validity of preferences. Leigh, MacKay and Summers (1984) also failed to find any convincing evidence of the expected superiority of full-profile methods.
2.3. Choice overload
From a theoretical standpoint, it isworth reflecting on the decision process itself within the consumption environment. When it comes to picking a product, a
11
bank is not different from a supermarket: in the former, customers pick financial services, while in the latter they pick products off shelves. In both cases, way too much choice of services or products might lead choice overload. This phenomenon is not empirically addressed by this dissertation, but given that the range of services offered by a bank might be a relevant choice criterion, it is worth knowing more about its potential effects.
A rich literature has been investigating whether having a wider range of choices is beneficial for consumers. Affirming that an increase of available options is actually harming consumers, means challenging most economics theoretical models, which are based on the assumption that more choice positively affects motivation (Scheibehenne, Greifeneder & Todd, 2010). However, there are several studies suggesting that although in many cases too much choice may first appear appealing, it can lead to increased frustration when an actual decision has to be made, and hence motivation to finalize the purchase could be negatively affected (Iyengar & Lepper, 2000). This may lead to purchase deferral or to giving up the purchase all together. Nevertheless, it is also true that consumers enjoy variety up to a given point. In fact, they are generally dissatisfied when faced with a single option and, when this is the case, they end up searching for more options (Mochon, 2013). Understanding at which point a range of options become too wide is not an easy task, as this threshold depends on personal evaluation of decision effort-benefit trade-off, namely of whether the resources required by a rational choice are outweighed by the benefits in picking the best alternative available (Iyengar et al., 2000).
Negative effects of choice overload are not consensual, as a meta-analysis of studies concludes by showing no clear supporting evidence for most of them (Scheibehenne et al., 2010). The reason behind this lack of convergence lies in the factors moderating choice overload. Attractiveness of options, for instance, is a crucial factor. If consumers are faced with many options, but none of them is attractive, adding a clearly superior alternative will not result in choice overload, but in more satisfaction and motivation. On the other hand, adding an attractive option to a set of already appealing ones will lead to choice overload and a
12
decrease in satisfaction due to regret (Chan, 2015). Another characteristic influencing consumers’ perception of variety is assortment structure. On one hand, increasing variety in an organized assortment positively affects utility and pushes consumption up. However, when the same alternatives are added to a disorganized assortment, increases in consumer satisfaction and consumption are not observed (Kahn and Wansink, 2004). It is also likely that clear ex-ante preferences (ideal point availability) reduce the likelihood of choice overload in consumers (Chernev, 2003).
The way different product choices are presented to consumers can equally affect the point at which choice overload takes over the benefits of more options. In particular, when customers evaluate many options with an alternative-based approach, whereby product characteristics are evaluated comparing each attribute against available alternatives, choice overload kicks in more easily (e.g. as in classic conjoint analysis methods). On the contrary, it seems that the best approach for high variety assortments is attribute-based. This is when consumers are asked to put more effort in the decision and define preferences on the different attributes beforehand, allowing for the best product to be chosen or developed for them (Huffman & Kahn, 1998). Such approach is more similar to what is required from respondents in a self-explicated conjoint method.
Even if the amount of research on choice overload and its moderating factors is extensive, its focus is almost exclusively on goods, while services are relatively less well researched. What is happening in this field is similar to what has been discussed already about choice criteria. Studying consumer behaviour when it comes to services is more challenging when compared to goods (Ricci et al., 2014). However, while in the case for choice criteria research, results for durable goods could not be extended to services, in the case of choice overload the two areas seem much closer. So there seems to be no reason why many mechanisms detected for the former could not equally apply to the latter.
13
3. Methodology
3.1 Population and sample
Data for this study were collected through the administration of anonline questionnaire to a random sample of US-based respondents via MTurk. Previous literature did not provide much guidance on geographical focus, as each and every study was conducted in different countries: Anderson et al. (1976) in the US, Martenson (1986) in Sweden, Devlin (2002) and Devlin et al. (2004) in the UK, Ricci et al. (2014) in Italy and so on and so forth. Given this fragmented framework conducting the study in the US seemed more reasonable than doing so in Europe due to the different characteristics of the two markets. First of all, the US are one single unified market with more than 320 million consumers and this makes the findings of this study relevant to at least this consumer population. Also, and according to the S&P Global FinLit Survey (2015), about 57% of the US population can be considered financially literate, a percentage which decreases along with income. Hence, it should be possible to use this population to study effects of financial knowledge, as it seems to vary considerably. Conversely, the possibility of conducting a study at EU level was ruled out for the challenges it posed. If it is true that all EU countries are part of a Single Market, the absence of previous studies of this kind for retail banking signals the heterogeneity among different markets and the limited level of integration when it comes to the retail banking industry. Lastly, Anderson et al. in 1976 have also
14
conducted a study in the US which could serve as a benchmark against which to analyse our results.
The questionnaire was administered to a sample of 248 US-based consumers, from different regions. The response rate, in terms of completed, valid questionnaires, was slightly above 61%, yielding a final sample of 152 respondents. A preliminary inspection of the corresponding data did not reveal any major incongruences in answers, or severe outlying observations. A sample size of 150 respondents is the minimum number considered generally acceptable in conjoint studies (Orme, 2010). A third party was payed $0.20 per questionnaire completed and offered accruable credits redeemable as shopping vouchers as further incentive, which likely explains the high response rate obtained.Given the method of questionnairedistribution, non-internet users in the population were naturally excluded. Therefore, more educated, young and middle-age people might be overrepresented in the final sample, due to self-selection (Grandcolas, Rettie & Marusenko, 2003).
3.2 Questionnaire
AppendicesA and B depict the online questionnaire administered, which was pre-tested with a comparable sample of respondents.It started with a number of questions designed to measure different banking habits and behaviours, which were followed by assessments of respondents’ financial knowledge. According to literature, the relative importance of choice criteria seems to be affected by the level of financial knowledge. Devlin (2002) used the highest level of educational attainment as a proxy for financial knowledge. This is not a direct measure and is based on assumptions, as the author himselfrecognized. On the other hand, Harrison (1994) used a one-item, self-reported scale to assess financial knowledge. However, such a question would assess financial knowledge subjectively, rather than objectively. This might represent a limit given that these two measures often differ, due to overconfidence bias (Chira, Adams & Thornton, 2008). In order to measure the financial knowledge of respondents as accurately as possible, first a self-evaluation question (they were asked to evaluate how
15
they perceived their level of financial knowledge on a scale from 0 to 10) was administered and subsequently respondents were asked to answer eight questions of varying complexity in order to assess their financial literacy (OECD INFE, 2011) (i.e., their objective knowledge). The education level of participants was also measured at the very end of the questionnaire, along other socio-demographic variables, to check Devlin (2002)’s assumption of it being a good proxy measure of financial knowledge.
The last section of the questionnaire was dedicated to the conjoint analysis task. Attributes and levels were selected in accordance to extant studies, particularly the more recent ones (Boyd, Leonard & White 1994; Devlin 2002; Ricci et al., 2014). Eleven relevant criteria were initially identified: branch location, image and reputation, low fees/overdraft charges(i.e., costs), amount and variety of services offered, interest rates paid, service quality, home banking option, recommendation, branch opening hours, incentives offered (e.g. gift or voucher) andfamily ties(bank used by parents or close relatives). Attributes like interest rate paid, home banking and branch opening hours were excluded due to the evolution of the retail banking industry. Interest rates are nowadays really low or absent in almost all current/checking accounts, so it seems reasonable to disregard this as key choice criterion. Meanwhile, home banking and mobile apps became standard features in most retail banks, so they were expected to hardly differentiate between them. Branch opening hours do not differ significantly across banks either. Some of the 11 attributes considered were finally merged to avoid overlap (e.g., recommendation and family relationship became just recommendation) and reduce the final set included to 7 (Table 1).
TABLE 1 – Attributes included in the conjoint analysis task
Branch location Quality of service
16
Product range Recommendation
Reputation Incentive offered
Running a full-profile conjoint analysis with orthogonal design for 7 attributes with 3 levels each meant asking the respondents to evaluate 18 profiles (See Appendix C). Giving the risk of information overload previously discussed, the use of this method was ruled out. Similarly, the choice-based method was excluded for the risk of both information and choice overload. One possibility was further reducing the number of attributes, but this would have meant taking away characteristics that were found relevant in previous studies. For this reason, a self-explicated conjoint approach was employed (Chrzan et al., 2000), the details of which are described in Appendix B.
3.3 Data analysis
Socio-demographic variables, banking behaviour and level of financial knowledge were first analysed using descriptive statistics. In order to create an overall measure of objective financial knowledge, answers to the corresponding 8 questions werescored 1 if they were correct and 0 if not, and subsequently summed to create an index score.
The results of the conjoint questions were used to assess the relevance of the different choice criteria. In order to obtain part-worth weights or utilities for each criteria, the levels of preference of each attribute-level (LOP) were multiplied by the utility constant sum score (UCP) of the attribute. This process generated the utility scores for each attribute-level (Srinivasan & Park, 1997). For example, if we had "Location" and the LOP for "Close to home" was 10 (most preferred level) and the CUS of Location 30, the utility of "Location close to home" would be 10*0.3= 3. The same process was followed for the other two levels of this attribute and for alllevels of other attributes. Next, the individual part-worth
17
weights of the attributes were obtained by dividing the sum of the utility scores of the levels of an attribute by the sum of all the utility scores of each respondent. For example, the utilities of Location (meaning the utility of the different levels: home, work, grocery) were summed up and divided by the sum of all the utilities for all the attributes. In this way, the part-worth utilities for each attribute for each respondent were obtained.Lastly, the mean of the individual part-worth weights was computed, giving the overall part-worth weights of each attribute.
In order to check for relationship among other variables and part-worth utilities for choice criteria, respondents should be grouped according to their preferences on those very criteria. A two-step cluster analysis on individual parth-worth utilities was hence performed (Hair, 2007). First, a hierarchical cluster analysis with Ward’s method helped identify the appropriate number of clusters, based on the coefficients of the agglomeration schedule. Thisanalysis started with the utilities of the 152 respondents and reiteratively merged the more similar ones into clusters until a one cluster solution was reached. In order to identify the optimal number of clusters, we hadto find the point of the agglomeration schedule where it was merging really heterogeneous groups of respondents. This wassignalled by a consistent and sudden increase in the coefficients of the agglomeration schedule, which could be better visualized through the dendogram and the agglomeration chart, where a jump was visible (Rokach, Lior, & Oded Maimon, 2005). The number of clusters suggestedby the hierarchical method was then used to run a k-means cluster analysis, given that this analysis requires setting the number of clusters ex-ante. The k-means cluster analysis assigned all the respondents to the most appropriate cluster.
The next step included investigatingthe existence of significant differences in means of socio-demographic characteristics and banking behaviour between clusters. To this end, we tested the existence of significant mean differences or differences in class proportions between clusters. For continuous variables, we used ANOVA if normality and homogeneity of variance assumptions weremet, and Kruskal-Wallis tests otherwise. Chi-Square tests were also employed in the case of nominal variables, like gender or employment status. Finally, we tested
18
the existence of significantdifferences in mean level of financial knowledge between clusters by a Kruskal-Wallis test, given that ANOVA’s requirements of normality and homogeneity of variance were again not met. Post-hoc tests were subsequently employed to test for the existence of significant mean differences among pairs of clusters.
4. Results and discussion
4.1 Socio-demographics and financial knowledge
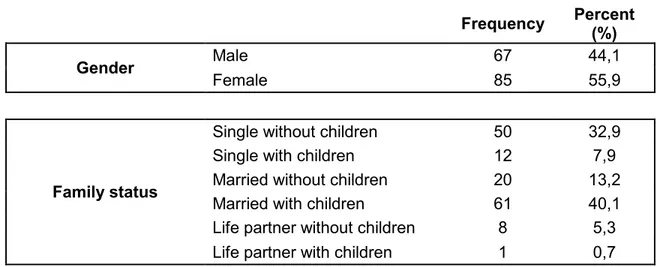
Table 2 presents the socio-demographic profile of the sample. About 59% of the respondents had completed university-level education and an additional 20% was either a university student, or received some kind of education at university level. This is not representative of the US population, where just one out of three people over 25 has a university degree (Ryan & Bauman,2016). This was likely due to a self-selection bias caused by the online distribution of the questionnaire.
TABLE 2 - Socio-demographiccharacteristics of respondents (N=152).
Frequency Percent (%) Gender Male 67 44,1
Female 85 55,9
Family status
Single without children 50 32,9
Single with children 12 7,9
Married without children 20 13,2
Married with children 61 40,1
Life partner without children 8 5,3 Life partner with children 1 0,7
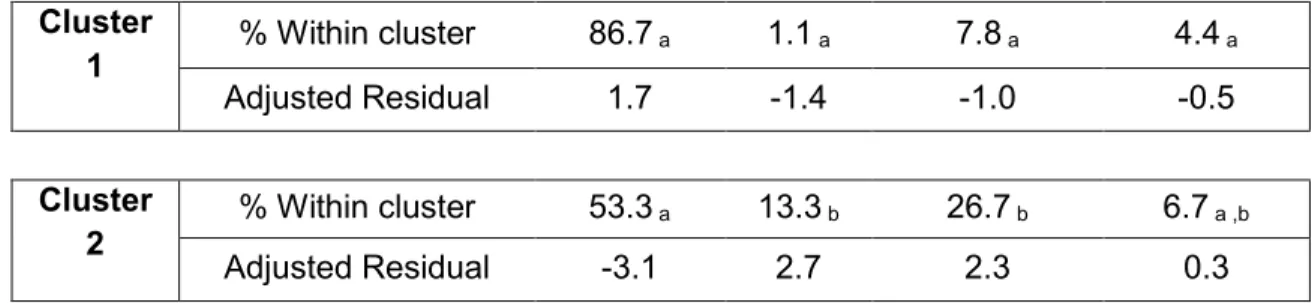
19 Annual household Income Below $51,900 95 57,6 Above $51,900 70 42,4 Community of residence
Village or rural area ( < 3 000) 14 9,2 Small town (3 000 - 15 000) 24 15,8
Town (15 000 - 100 000) 32 21,1
City (100 000 - 1 000 000) 50 32,9 Large city (over 1 000 000) 31 20,4
Highest level of education
Complete university-level
education 90 59,2
Some university-level
education (university students) 31 20,4 Complete secondary education 12 7,9 Complete technical/vocational
education 15 9,9
Complete primary school 4 2,0
No formal education 1 0,7
Employment
Work full or part time 125 82,2
Retired 4 2,6
Unemployed or out of
workforce 15 9,9
Student 8 5,3
Min Max Mean Standard deviation
Age 20 63 36.77 11.37
Mean level of objective financial knowledge was 4.5 (SD=2.1), whereas for subjective knowledge a mean of 6.2 (SD=2.3) was observed.Both distributionswere slightly skewed towards high values, being the means above the respective median point of the scales. A normality check was carried out, the results of which are depicted in Table 3.
TABLE 3 - Test of normality for perceived and objective financial knowledgeof
20 Statistic df Significance Perceived financial knowledge 0.167 152 0.000 Objective financial knowledge 0.130 152 0.000
Both variables are not normally distributed.An observation of the histograms of these variables also suggests that they are not normally distributed (Figure 1 a-b). This was confirmed by the performance of Kolmogorov-Smirnov tests, which were statistically significant at the .001 level in both cases.
Figure 1a-b – Histogramsof thelevel of subjectiveand objective financial knowledge of respondents (N=152).
Figures 1a-b also suggest important differences between knowledge measures, namely the bi-modal distribution of objective knowledge which is not apparent in subjective knowledge. This canlead to the conclusion that consumers do not have a realistic perception of their own level of financial knowledge. Moreover, having in mind the literature reviewed in chapter 2, rarely a study on choice criteria in retail banking contained both an objective and a perceived measure of
21
financial knowledge. Mostrelied on subjective measures of knowledge (Harrison, 1994) or on proxies, such as education (Devlin, 2002).
Having both measures of financial knowledge for our respondents, we checked whether the two werecorrelated. With a Spearman’s Rho of 0.294 (p<.001)we can rejected the null hypothesis, therefore the two variables were significantlycorrelated, although not nearly as strongly as one might expect (just above 8.5% of the variance was explained).This is consistent with what we observe in Figures 1a-b. When asked to rate their own knowledge,most respondents picked values just above the median. What the objective financial knowledge variable tells us is different though, with a group of them scoring high on the objective financial knowledge measure and another group scoring low. This confirms the assumption that the way consumers perceive their level of financial knowledge is not a reliable measure of their real abilities in this area.
4.2 Banking behaviour and choice criteria
Table 4 presents the results of respondent’s answers about their retail banking habits.Most respondents held more than one account in different banks, meaning that they probably used different accounts for different services. Moreover, Internet and apps were the most used channels to do banking, even though branches were still reportedly visited at least once a month by the majority of respondents.
TABLE 4 - Banking behaviourof respondents (N=152).
Min Max Mean Standard deviation Number of banks
patronized 1 5 2.16 1.04 Tenure (for checking account
bank - years) 0 40 10.15 7.63 Number of branch visits
(per month) 0 15 2.33 2.61 Number of access to mobile
22
Table 5 presents the main results of the conjoint analysis task: the mean part-worth weights for the attributes tested in the questionnaire.
TABLE 5 –Mean part-worth weights for retail banking choice criteria(N=152).
Mean Standard deviation Part-worth weights Branch location 0.317 0.21 Quality of service 0.150 0.11 Cost 0.145 0.16 Product range 0.117 0.09 Recommendation 0.100 0.07 Reputation 0.096 0.11 Incentive offered 0.075 0.08
Location of the branch wasthe main choice criterion for choosing a retail bank for our sample of respondents. This result is quite striking especially if we consider their banking behavior (Table 4): almost 70% of the sample visited a branch maximum twice a month. Nevertheless, thesefindings are consistent with others from studies placing branch location at the very top of the list of choice criteria (Stanley, Berry & Danko, 1980; Lewis, 1982; Devlin, 2002; Ricci et al., 2014).As far as the other criteria were concerned, quality of service and cost followed with almost similar importance, whichwas less than half that of branch location. It is worth noticing that incentives were at the bottom of the list, meaning that when it comes to retail financial services subscriptions offers and gifts seem not to be very much valued by consumers.
Table 6 presents the weighted levels preferences for the top three choice criteria of respondents.
TABLE 6 – Weighted levels preferences for the top three choice criteria of respondents (N=152) Mean Weighted preferences Branch location Close to home 0.533 Close to work 0.323 Close to grocery 0.144
23
Weighted preferences Quality of service
Top service – $5 / month 0.207 Fair service - $2.5 / month 0.308 Sufficient service - free 0.485
Weighted preferences Cost
High cost – Excellent service 0.142 Fair cost – Fair service 0.410 Low cost – Acceptable service 0.448
Results indicated that having a branch close to home was by far the attribute most valued by the respondents. Given that branches appeared to be seldom visited, it seems that having a branch close to home was more a matter of knowing that someone is there to help out when it is needed. It might be to discuss about a loan or a mortgage or solve a pressing issue. Moreover, it is worth noticing that almost 50% of the sample seemed to prefer a free and sufficient service, rather than paying a small fee and having a better service. The reason why this was the case may lie in how consumers perceive the banking industry. According to a report published by the consultancy firm PricewaterhouseCoopers in 2015, for the last few years the retail banking industry has witnessed an increased commoditization of products. This means that different banks and their products and services are perceived as similar, therefore customers will just go for the cheaper one. Quite interestingly this very same trend was highlighted by Anderson et al.in 1973.
4.3 Segmentation according to evaluations of choice
criteria
The results of the hierarchical cluster analysis with Ward’s method suggested a three-cluster solution. Figure 2 shows the corresponding agglomeration coefficient chart; the coefficients of the agglomeration schedule and dendogram are presented in Appendices D and E, respectively.
24
Figure 2 – Agglomeration coefficient chart of clusters (from 100 to 1 cluster) for respondents (N=152) according to theirevaluations ofretail banking choice criteria
Looking at Figure 2, we can see that the elbow point is at the value of 149; this suggests a 3-cluster solution, which is supported by the content of the dendogram as well. The elbow point means that moving from 3 clusters to 2 means aggregating fairly two heterogeneous groups of respondents.
Table 10 depicts the values of the cluster centres obtained when subsequently running a k-means cluster analysis on the solution obtained and identifies the clusters obtained.
TABLE 7 - Final Cluster Centers based on the evaluation of retail banking choice criteria byrespondents (N=152).
Cluster Balanced-Decision Cost-Driven Location-Driven Branch location ,21 ,13 ,58 Product range ,14 ,09 ,08 Quality of service ,18 ,08 ,11 Incentive offered ,09 ,06 ,05 Recommendation ,13 ,04 ,07 ,000 2,000 4,000 6,000 8,000 10,000 12,000 14,000 16,000 18,000 20,000 100102104106108110112114116118120122124126128130132134136138140142144146148150
25
Cost ,12 ,53 ,06
Reputation ,12 ,08 ,05
Number of cases 90 15 47
Cluster 1 entailed the biggestsegment uncovered(59% of the sample). People in this cluster deemed most of the criteria fairly important, with a slightly higher weighton Branch Location and a fairly lower one given to Incentive Offered. Their approach to the choice of a retail bank seems balanced and rational, therefore this cluster was named the “Balanced-Decision”segment. The second cluster wasmuch smaller (10% of the sample) and had a strong focus on service costs. It also has the lowest average parth-worth weight for the attribute quality of service among the three clusters identified. Consequently, it was named the “Cost-Driven” segment. Finally, cluster 3 representedroughly 31% of the sample. Its members seemed to have a clearly dominant criterion, location, so this cluster was named the “Location-Driven”segment.The cluster solution obtained yielded clusters of very different size. It seems reasonable that due to the self-selection of more educated consumers in our sample, the cost-oriented group might be under-represented, while the service oriented one might be over-represented. Having obtained a satisfactory cluster solution, itwas subsequently possible to profile respondents in each cluster according to their socio-demographic characteristics, banking behaviour and level of financial knowledge (subjective and objective). This further contributed to validate the cluster solution obtained and, most importantly, allowed for the investigation of meaningful differences across clusters in terms of consumer profiles, whichcould explain differences in the relative importance of choice criteria
Age (p=0.213), size of community of residence (p=0.338) and highest level of education (p=0.190) did not differ significantly across clusters. Frequency distributions of gender (p=0.229), annual household income (p=0.465) and family status (p=0.549) were also not statistically different between clusters. However, employment status was (p=0.28).Given that 66.7% of the cells hadexpected count less than 5, the assumptions for Pearson Chi-square werenot fulfilled and
26
hence a Fisher-Freeman-Halton test (Fisher’s Exact Test) was additionally conducted. With a significance level of 0.035 the null hypothesis was rejected, meaning that the distribution of work status categories across at least two clusters was statistically different. In order to understand among which categories and clusters the difference lies, a cross-tabulation with adjusted residuals and z-test was performed (Table 8).
According to these results, differences in employment status were significant between cost-oriented respondents and the remaining ones. Working respondents were severely under-represented in this cluster, while unemployed and retired ones were over-represented. This is quite reasonable, as it can be assumed that service costs might be more important to those with lower income, such as the unemployed. Only 4 respondents out of 152 reported to be retired. Nonetheless, they were spread across the clusters in a very different way if compared to other categories, with only one in the balanced-decision and location-focused groups respectively and two in the cost-oriented cluster. This means that 50% of the retirees prioritize cost, while this percentage is as low as 10% in the overall sample. We would expect to find a similar pattern for income, but due to the length of the questionnaire and the sensitive nature of the topic, the way the question was formulated provides limited information. The survey question on income just asked whether respondents were above or below the average US household income of approximately $ 51,900 (De Navas-Walt, C. & Proctor, B.D., 2015).
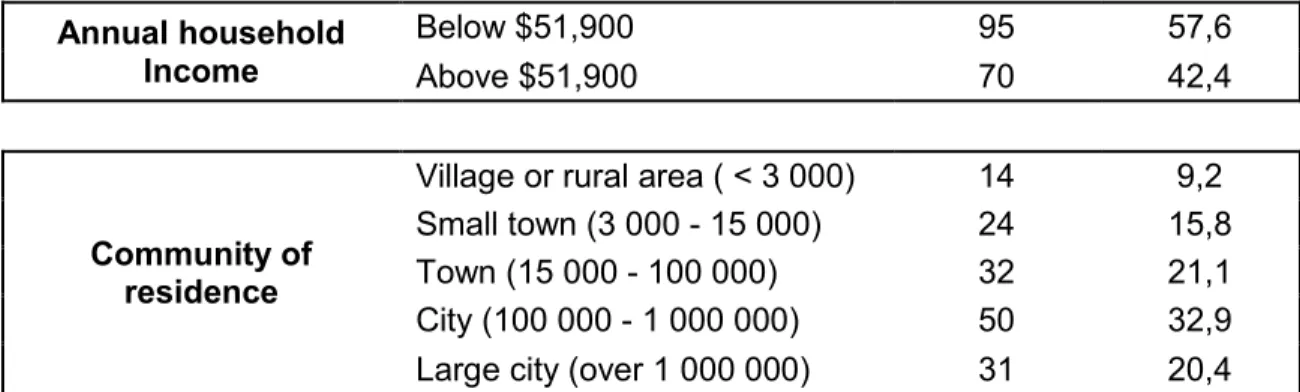
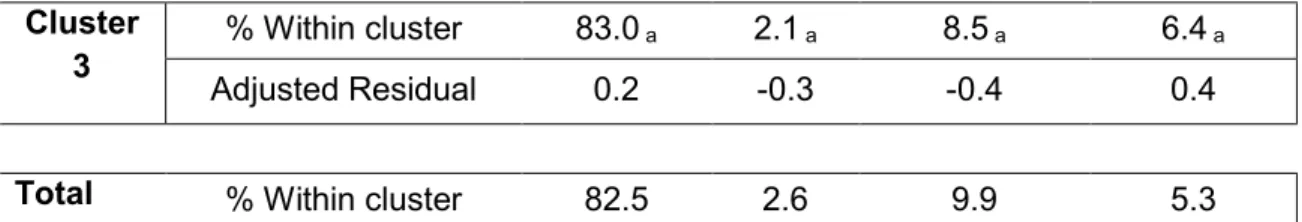
TABLE 8 - Cross-tabulation of cluster membership and Employment status for respondents (N=152).
Employed Retired Unemployed Student Cluster 1 % Within cluster 86.7 a 1.1 a 7.8 a 4.4 a Adjusted Residual 1.7 -1.4 -1.0 -0.5 Cluster 2 % Within cluster 53.3 a 13.3 b 26.7 b 6.7 a ,b Adjusted Residual -3.1 2.7 2.3 0.3
27
Cluster
3 % Within cluster 83.0 a 2.1 a 8.5 a 6.4 a
Adjusted Residual 0.2 -0.3 -0.4 0.4
Total % Within cluster 82.5 2.6 9.9 5.3
Each subscript letter denotes a subset of Employment status categories whose column proportions do not differ significantly from each other at the .05 level.
Results of the tests of significant differences in mean financial knowledge across clusters are provided in Appendices F-M. These showed that mean overall differences in objective knowledge were significant at p<.01. Table 10 presents the main findings of the post-hoc tests.
TABLE 10 – Pair-wise comparison: cluster membership and distribution of the objectivefinancial knowledge of respondents (N=152)
Pair of clusters T-stat Std. Error Std. T-stat Sig. Adj. Sig.
3-1 19.33 7.85 2.46 0.14 0.04
3-2 35.81 12.93 2.79 0.06 0.02
1-2 -16.48 12.16 -21.35 0.17 0.53
Each row tested the null hypothesis that the pair of clusters distributions werethe same. While there was no statistically significant difference in the level of objective knowledge between clusters 1 and 2, both had a significantly higher level of objective financial knowledge than cluster 3. This implies that balanced-decision customers and cost-oriented ones wereon average more knowledgeable than location-oriented ones. It was expectable that more thoughtful customers should be more financially literate than those heavily relying on only one criterion
28
(cost or location). However, finding out that cost-oriented customers had also a relatively high level of knowledge was somewhat surprising.
4.4 Discussion
We found that branch location was by far the most important criteria in the choice of a retail bank. Devlin (2002) reached a similar conclusion and also found that location was more relevant to those with a low level of financial knowledge. Accordingly, wefoundthat the segment relying more heavily on location had a significantly lowermean level of financial literacy than the remainder. Moreover, findings from conjoint analysis allowed us to understand that the most important level of this attribute is having a branch close to home. This is consistent with results from both Devlin (2002) and Ricci et al. (2013).
These findings carry an important implication for retails banks. Although the overwhelming majority of customers does not regularly visit branches anymore, due to increasing internet and mobile banking activity, there is still a relevant share of consumers who finds having a branch close to their homes as the most important reason why they choose a particular retail bank. In a period of frequent restructuring of branch networks, it is important that banks take reasoned decisions when it comes to closing down branches, as this might negatively impact the number of new customers or may be a reason for old customers to switch. A trade-off analysis should be carried out, with the savings generated by the closure on the one hand and the loss in new and old customers on the other one.
Nevertheless, our findings deviate from the analysis of trends carried out by Devlin et al. (2004), according to which location was decreasing in importance, despite being still at the top of the list of criteria. It is possible that our study captured a recent reversion in the trend. The reason why having a branch close to home seems to be so important for a relevant group of customers, despite not visiting it on a regular basis, might lie in the importance of face-to-face interaction when it comes to solving problems or taking complex choices, such as choosing a mortgage or other financial products. The branch represents a safety net,
29
reassuring customers of the fact that someone is there when they need it, or when they cannot solve things via internet banking or phone. This is also consistent with the fact that,in this cluster, respondents had the lowest mean level of financial knowledge. So it is natural that they consider having a branch close to home the most important criteria. On one hand, they need more help and rely more on the bank staff when choosing some banking products. On the other hand, it is more difficult for them to understand cost structure and other more complex criteria. This is likely to lead them to rely heavily on branch location.
Moreover, we found that there is another group of customers with a higher level of financial knowledge that takes into account more than one criteria when choosing a retail bank. Branch location still tops the list, but is followed at short distance by quality of service and product range. Alongside this cluster of customers, we have a smaller one prioritizing cost over all the other criteria. The two groups have in common a higher level of financial knowledge with respect to the location-oriented cluster. These findings are again consistent with Devlin (2002): segments with higher average financial knowledge take intrinsic attributes, such as service quality and cost, more into account than those with lower financial knowledge. It is also worth noticing how unemployed and retirees are significantly more represented in the cost-oriented cluster rather than in the other two.
Going back to the group taking into account several criteria with a fairly balanced approach, it is by far the most numerous of the three clusters in our sample. The existence of such a group of consumers valuing quality of service and product range means that the regulatory push towards more clarity on financial services conditions might have had a relevant impact on many consumers. Moreover, the industry trend of reducing product range and increasing transparency is worth the effort, as many people seem to rely on multiplecriteria affected by these choices.
30
research
In terms of theimplications for retail banks’ strategy, the main point is not to underestimate the role played by branches in terms of retaining existing customers and attracting new ones. However, if it is true that customers value having a branch close to home highly, it is also true that most of them seldom visit one. In this scenario,an approach might be to reduce to the minimum the staff working in branches as well as reducing opening hours. Moreover, the idea of a mobile branch for some areas is worth considering and it has already being implemented by the Royal Bank of Scotland in the UK. A mobile branch keeps the presence of the bank for some days a week, while reducing costs.
Another relevant implication of our study is that not all customers consider branch location in the same way. Therefore, closing a branch might have different effects depending on the customers it serves.Our study did not find any significant difference in the distribution of community size (rural, village, town, city, large city) across segments. However, further research might identify links between segments and particular geographical areas. This research could be carried out by a bank itself, administering a few questions to its customers in different areas in exchange for a voucher or a discount. Such a market research could highlight areas characterized by customers with a higher level of financial literacy. This in turn would mean that the negative impact of closing a branch there would be lower, as those customers take into account also other criteria.
It might also be useful to knowwhich incentives donot work well in the retail banking industry.According to our results, offering a fee-waiver for the first few months or a voucher upon opening a new account does not seem to be very appealing to consumers. The reason might be that financial services are seen in a different way when compared to other services and products, such as subscriptions to online streaming services or a gym. In a similar way, reputation, which was still more valued by respondents than incentives, seemed not to be really taken into account, especially by cost and location-oriented customers. The reason why this was the case might lie in the perception that the banking industry is already highly regulated. So, the chances of
31
losing one’s money are really low, with different mechanisms of deposit insurance guaranteeing a safety-net for customers in most countries.
The uneven distribution of respondents across the three segments identified signals one potential limitation of this study. With questionnaires being administered online, a self-selection bias may arise, excluding non-internet users from the sample (Grandcolas, Rettie & Marusenko, 2003). This in turn might lead to the over-representation of more educated people, likely to be in employment. Further evidence of this comes from our socio-demographics: an overwhelming majority of the sample is university-educated and in full or part-time employment, while just a minority has lower levels of formal education and is retired, unemployed or still in education. The main effect is a possible over-representation of the group taking a balanced decision and an under-representation of the cost-oriented group. This seems to be even more the case given the fact that the few unemployed and retired respondents are significantly more likely to be found in the cost-oriented group than those in employment. Despite this, our findings could provide a first useful basis for the development of tool for market segmentation of retail banking services by the industry. Nevertheless, it is important to remember that in the general population, cost-oriented and probably also location-oriented customers may be more numerous than our results suggest. This leaves room for future research addressing self-selection bias, maybe by trying different survey administration methods. A second limitation of this study is the use of a proxy in order to measure recommendation i.e. being elected bank of the year by a consumer association. This is clearly not the same as having a friend or a relative giving a positive feedback on a bank, therefore other approaches could better assess the role played by this criterion. Moreover,the role of income is still to be defined. Lastly we focus only on a US sample, therefore further studies in other countries are needed in order to see whether our findings are fully applicable also elsewhere, maybe with a bigger sample size.
32
39
Appendix A
Questionnaire
Q0
Informed Consent Form
Welcome to our questionnaire! Thank you for choosing to participate in this survey. We value your opinion and your honest feedback.
Procedures
This questionnaire will take from 5 to 10 minutes, please take all the time that you need to answer the questions.
Confidentiality
All data obtained from participants will be kept confidential and will only be reported in an aggregate format (by reporting only combined results and not individual ones).
Q1
How many bank(s) are you customer of? ______ Number of banks
Q2
For how many years have you been with your current checking account bank? (If you have accounts in several banks, please consider the bank where you have your main checking account, that is, the account where you receive your salary and/or from which you pay your bills)
______ Number of years
Q3
How would you define your level of financial knowledge (awareness, knowledge, skill, attitude and behaviour necessary to make sound financial decisions) on a scale from 0 (very low) to 10 (very high)?
40
Q4
Buying a single company stock usually provides a safer return than a stock mutual fund True
False Don't know
Q5
Imagine that five brothers are given a gift of $ 1,000. The brothers have to share the money equally. Now imagine that the brothers have to wait one year to get their share of the $ 1,000 and inflation stays at 5%. In one year's time they will be able to buy: More with their share of the money that they could today (1)
The same amount
Less than they could today Don't know
Q6
Suppose you put $ 100 into a savings account with a guaranteed interest rate of 2% per year. You don't make any further payments into this account and you don't withdraw any money. How much would be in the account at the end of the first year, once the interest payments is made? Please write the number (without currency) below. Leave blank if you don't know.
Q7
Suppose you put $ 1,000 into a savings account with a guaranteed interest rate of 2% per year. You don't make any further payments into this account and you don't withdraw any money. How much would be in the account at the end of the second year, once the first and second interest payments are made? Please write the number (without
currency) below. Leave blank if you don't know. $ 1,038.5
$ 1,040.4 $ 1,040 $ 1,044 Don't know
41
Q8
And how much would it be in the account at the end of five years? More than $ 1,100
Exactly $ 1,100 Less than $ 1,100
It is impossible to tell from the information given Don't know
Q9
Let’s assume that you took a bank credit of $ 10,000 to be paid back during a year in equal monthly payments. The credit charge is $ 600.Give a rough estimate of the annual interest rate on your credit.
3% 6% 9% 0,6%
I cannot estimate it even roughly
Q10
If interest rates rise, what will typically happen to bond prices? Fall
Rise
Stay the same or no relationship I don't know
Q11
Given that you borrow the same amount at the beginning, a 15-year mortgage typically requires higher monthly payments than a 30-year mortgage but the total interest over the life of the loan will be less.
True False Don't know
Q12
How frequently do you visit your bank branch per month? ______ Average number of visits per month
42
Q13
How frequently do you use Internet banking services or mobile apps per month (for example balance inquiry, transfers, etc.)?
______ Average number of accesses per month
Q14 - Conjoint analysis (See Appendix B)
Q15
What is your gender? Male
Female
Q16
How old are you? ______ Years
Q17
Please indicate your family status Single without children
Single with children Married without children Married with children
Life partner without children Life partner with children
Q18
Which of these best describes the community you live in? Village or rural area (fewer than 3 000 people)
Small town (3 000 - 15 000 people) Town (15 000 - 100 000)
City (100 000 - 1 000 000) Large city (over 1 000 000)
43
Q19
What is the highest level of education you have completed? Complete university-level education
Some university-level education (university students) Complete secondary education
Complete technical/vocational education Complete primary school
No formal education
Q20
What is your current work status? Work full or part time
Retired
Unemployed or out of workforce Student
Q21
What is your annual household income? Below $51,900
Above $51,900
Q22
Thank you for your contribution to our study, we very much appreciate it! Please include your MTurk ID to receive full credit.
44
Appendix B
46
Appendix C
Orthogonal design for fractional factorial design
Card Location Range Quality Incentive Recomm Cost Image
1 3 3 1 1 2 2 2 2 1 1 1 1 1 1 1 3 3 2 1 3 1 1 3 4 2 1 1 2 3 2 3 5 3 1 2 2 3 1 2 6 1 3 2 2 1 2 1 7 2 3 1 3 3 3 1 8 3 2 2 1 3 3 1 9 1 1 2 3 2 3 3 10 1 2 3 1 3 2 3 11 3 3 3 2 1 3 3 12 2 1 3 1 1 3 2 13 1 3 3 3 3 1 2 14 3 1 3 3 2 2 1 15 2 2 3 2 2 1 1 16 1 2 1 2 2 3 2 17 2 2 2 3 1 2 2 18 2 3 2 1 2 1 3