EDP and Naturgy:
Merger in Utilities
Francisco Rocha
Dissertation written under the supervision of António
Borges de Assunção
Abstract
When I chose the Mergers and Acquisitions (M&A) seminar for my thesis, I did so due to the internship I was attending at the time in a M&A department. There, I was allocated to the Technology, Media and Telecoms (TMT) and the Energy sectors, hence my choice. At the time, rumors started on a possible merger between Naturgy (ex-GNF) and EDP – Energias de Portugal, which didn’t amount to anything. My internship reached its end, but not my interest in the merger possibility and the sector.
Throughout this thesis, I intend to learn if the merger would make sense for both sides, and which obstacles would Naturgy face if it had continued with their merger proposition.
However, in May, China Three Gorges, a shareholder of EDP, decided to make an acquisition offer for the rest of the shares. This event added questions to my thesis: How did it affect EDP, and how would it influence a merger proposition from Naturgy?
After a literature review on valuation and M&A, and an industry and company overview, I reached a valuation for both and a merger proposal, along with the respective analysis. I also give an insight on China Three Gorges’ offer.
Abstracto
Quando escolhi o seminário de Mergers and Aquisitions (M&A) para fazer a minha tese, fi-lo porque me encontrava na altura a estagiar num departamento de M&A. Aqui estava alocado aos sectores de Tecnologia, Média e Telecomunicações (TMT) e de Energia, daí a minha escolha do sector energético. Durante o estágio, surgiram rumores de uma possível fusão entre a Naturgy (ex-GNF) e a EDP – Energias de Portugal, que acabou por não se concretizar. O estágio terminou mas o meu interesse na possibilidade da fusão e no sector não.
Com esta tese, tenciono averiguar se esta fusão faria sentido para ambas as partes, e quais os obstáculos que a Naturgy iria encontrar se tivesse prosseguido com a proposta de fusão. Em Maio, no entanto, a China Three Gorges, accionista da EDP, decidiu fazer uma Oferta Pública de Aquisição (OPA) ao resto das acções que não possuía. Este evento acrescentou perguntas à minha tese: Como é que este evento afectou a EDP, e como influenciaria uma proposta de fusão por parte da Naturgy.
Através de uma revisão da literatura existente sobre avaliação e M&A, análises do sector energético e das empresas mencionadas, chego a uma avaliação para cada uma e a propostas de fusões com as análises respectivas. Acabo também por dar um “insight” sobre a oferta da China Three Gorges.
Acknowledgments
I would like to thank my seminar supervisor, Professor António Borges de Assunção, for his precious insights and round-the-clock availability.
Throughout the thesis semester, I had constant company and support from friends and family, for which I’m thankful. I would like to thank in particular Catarina Rocha, Diogo Góis, Diogo Dinis, Gonçalo Cardal, Gonçalo Rocha, Maria Cristina Rocha, Maria Sena Esteves, Richard Krieg, Rita Rocha, Rita Sampaio and Salvador Murteira for their support and pointers.
Table of Contents List of Figures 8 List of Tables 10 List of Equations 11 List of Abbreviations 12 Introduction 14 Literature Review 15 Firm Valuation 15 Valuation Models 15
Mergers and Acquisitions 17
Does It Create Value? 17
Strategy 18
Synergies 18
Control 19
Payment Method 19
Cross-Border Mergers and Acquisitions 20
Industry Overview 21 Energy 21 Electricity 22 Natural Gas 23 Renewables 24 Portugal 25 Spain 27
Future Growth Projections 30
Electricity 30
Gas 30
Energy Sector M&A Activity 30
Company Overview 33
EDP – Energias de Portugal 33
Background 33 Shareholder Structure 33 Operations 35 Strategy 40 Financial Performance 42 Naturgy 45 Background 45 Shareholder Structure 45 Operations 46
Competition Analysis 54
Portuguese Electricity Supply 54
Share Performance Comparison 55
Firm Valuation 56 Projection Methodology 56 Revenue Division 58 DCF Model Inputs 58 Final Valuation 62 EDP 62 Naturgy 63 Combined Valuation 63 Sensitivity Analysis 64 Relative Valuation 65 Naturgy/EDP Deal 69
China Three Gorges New Bid 69
Deal Rationale 72
Deal Format 73
Payment Method 73
Conclusion 76
References 77
Annex 1 – E.ON/RWE Deal 81
Annex 2 – E.ON/RWE Deal (2) 82
Annex 3 – E.ON/RWE Deal (3) 83
Annex 4 – E.ON/RWE Deal (4) 84
Annex 5 – EDP’s Income Statement 85
Annex 6 – EDP’s Balance Sheet (Assets) 87
Annex 7 – EDP’s Balance Sheet (Equity and Liabilities) 88
Annex 8 – Naturgy’s Income Statement 89
Annex 9 – Naturgy’s Balance Sheet (Assets) 90
Annex 10 – Naturgy’s Balance Sheet (Equity and Liabilities) 91
Annex 11 – EDP Growth Rates 92
Annex 12 – Naturgy Growth Rates 92
Annex 13 – Correlations EDP 92
Annex 14 – Correlations Naturgy 92
Annex 17 – Peers’ Ratios 94
List of Figures
Figure 1 - Capabilities / Market Access Matrix and Synergy Mix ... 18
Figure 2 - Net Capacity Additions. Source: World Energy Outlook 2017 ... 22
Figure 3 - Global Electricity Demand Forecast. Source: World Energy Outlook 2017 ... 22
Figure 4 - World Electric Car Fleet Forecast. Source: World Energy Outlook 2017 ... 23
Figure 5 - Gas Imports' Change. Source: World Energy Outlook 2017 ... 24
Figure 6 - Portuguese Monthly Electricity Consumption. Source: ERSE ... 26
Figure 7 - Portuguese Monthly Gas Consumption. Source: ERSE ... 27
Figure 8 - Spanish Electricity Consumption Weight by Segment. Source: MINETAD ... 28
Figure 9 - Historical Spanish Gas Demand. Source: CNMC ... 29
Figure 10 - Spanish Gas Consumption Weights by Segment. Source: CNMC ... 29
Figure 11 - Historical European Deal Values and Volumes. Source: EY ... 31
Figure 12 - EDP's Shareholders. Source: EDP's website ... 34
Figure 13 - EDPR's Shareholders. Source: EDP's website ... 34
Figure 14 - EDP Brazil's shareholders. Source: EDP's website ... 35
Figure 15 - Historical installed capacity EDP ... 36
Figure 16 - Historical generation EDP ... 36
Figure 17 - Historical distribution levels EDP ... 37
Figure 18 - Electricity supply levels EDP ... 38
Figure 19 - Supply by country EDP ... 39
Figure 20 - Gas supply levels EDP ... 40
Figure 21 - Projected installed capacity EDP ... 41
Figure 22 - EBITDA contribution EDP ... 42
Figure 23 - EDP's financial metrics ... 43
Figure 24 - Leverage EDP 1 ... 43
Figure 25 - Leverage EDP 2 ... 44
Figure 26 - Share performance EDP. Source: Reuters ... 44
Figure 27 - Naturgy's shareholders. Source: Naturgy's website ... 46
Figure 28 - Installed capacity Naturgy ... 47
Figure 29 - Electricity generation Naturgy ... 47
Figure 30 - Electricity distribution levels Naturgy ... 48
Figure 31 - Gas distribution levels Naturgy ... 49
Figure 32 - Electricity Supply levels Naturgy ... 49
Figure 33 - Gas supply levels Naturgy ... 50
Figure 34 - EBITDA contribution Naturgy ... 51
Figure 35 - Naturgy's financial metrics ... 52
Figure 36 - Leverage Naturgy 1 ... 53
Figure 37 - Leverage Naturgy 2 ... 53
Figure 38 - Share Performance Naturgy. Source: Reuters ... 54
Figure 39 - Share performance comparison. Source: Reuters ... 56
Figure 40 - Share price change EDP. Source: Reuters ... 70
Figure 43 - New shareholder structure 1 ... 73 Figure 45 - New shareholder structure 2 ... 74
List of Tables
Table 1 - EDP's growth rates ... 59
Table 2 - Naturgy's growth rates ... 60
Table 3 - Inputs for EDP and Naturgy ... 60
Table 4 - EDP Valuation ... 62
Table 5 - Naturgy Valuation ... 63
Table 6 - Combined Valuation ... 64
Table 7 - EDP's sensitivity analysis ... 64
Table 8 - Naturgy's sensitivity analysis ... 65
Table 9 - EDP market multiples valuation ... 66
Table 10 - Naturgy market multiples valuation ... 66
Table 11 - Transaction multiples ... 67
Table 12 - Transaction multiples valuation ... 67
Table 13 - Combined valuation with synergies ... 69
List of Equations
Equation 1 - WACC Model Formulas - Enterprise Value ... 16 Equation 2 - WACC Model Formulas - Terminal Value ... 16
List of Abbreviations
APV - Adjusted Present Value
CCGT - Combined-Cycle Gas Turbine
CLSBE - Catolica Lisbon School of Business and Economics CMVM - Comissão do Mercado de Valores Mobiliários CNIC - CNIC Corporation
CNMC - Comisión Nacional de los Mercados y la Competencia COD - Commercial Operations Date
CRP - Country Risk Premium
CTG - The China Three Gorges Corporation CVC - CVC Capital Partners
DCF - Discounted Cas-Flows
EBIT - Earnings before Interest and Taxes
EBITDA - Earnings before Interests, Taxes, Depreciations and Amortizations EDP - Energias de Portugal
EDPR - EDP Renováveis
EIA – Energy Information Administration
ERSE - Entidade Reguladora dos Serviços Energéticos EV - Enterprise Value
EY - Ernst and Young
FCFF - Free Cash-Flow to the Firm GNF - Gas Natural Fenosa
GW - Gigawatts
GWh - Gigawatts per hour
kWh - Kylowatts per hour LNG - Liquified Natural Gas M&A - Mergers and Acquisitions
MINETAD - Ministério de la Energía, Turismo y Agenda Digital MRP - Market Risk Premium
MW - Megawatts
OECD - Organization for Economic Co-operation and Development OPA - Oferta Pública de Acquisição
P&U - Power and Utilities
PVPV - Precio Voluntário al Pequeño Consumidor R&D - Research and Development
REE - Red Eléctrica de España Rf - Risk-Free
Tc - Corporate Tax
TMT - Technology, Media and Telecoms TV - Terminal Value
TWh - Terawatts per hour
Introduction
My objective with this thesis is to understand and value the benefits of a possible merger between two leading firms in the competitive energy sector, while also taking into account the specificities and current developments in each one.
To do so, I will review the literature in Mergers and Acquisitions (M&A) deals and valuation and thoroughly analyze the energy sector, as well as each firm. After their standalone valuation, I will value the merged entity and its possible sinergies.
Lastly, I will present different offer possibilities from Naturgy and CTG, as well as the nuances that affect each one’s feasibility.
Literature Review
“If I have seen further it is by standing on the shoulders of giants.” – Sir Isaac Newton, February 15, 1676 in a letter to Robert Hooke Even though Sir Isaac Newton never dwelled in the financial sector, to my knowledge, I believe there’s no better quote to summarize the motive for a literature review. By supporting myself on top of the findings of researchers, I will be able to deliver a more complete work.
The following review will be a starting point for my thesis, standing as a collection of information from past researchers on the Valuation and M&A fields from relevant financial journals.
Firm Valuation
“Understanding what determines the value of a firm and how to estimate that value seems to be a prerequisite for making sensible decisions” - Damodaran, 2006 In this section, I will be introducing the possible valuation models to be used in firm valuation, as well as tackling the various inputs required for the computation of the model I will choose.
Valuation Models
According to Damodaran, there are four types of methods to make a valuation: discounted cash-flows (DCF) valuation, relative valuation, accounting and liquidation valuation and option pricing valuation.
DCF Valuation
Two models standout in this type of valuation: the weighted average cost of capital based (WACC-based) and the adjusted present value (APV).
In both cases, we will be discounting all future expected cash flows of the firm to a present value with a rate that is defined by the risk adjacent to that firm, thus reaching the enterprise value (Damodaran, 2006).
The difference here is the way we discount said cash flows.
In the first model, we discount the cash flows through a “risk-adjusted discount rate” (Damodaran 2006) that has as inputs the firm’s cost of debt (interest rate at which the firm can
Equation 1 - WACC Model Formulas - Enterprise Value
Equation 2 - WACC Model Formulas - Terminal Value Where:
EV – Enterprise Value TV – Terminal Value
FCFF – Annual Free Cash-Flows
WACC – Weighted Average Cost of Capital (or Discount Rate) g – Long Term Growth Rate
n – Number of Periods
In APV, we value the firm’s operations as it is, and then we subtract all financing effects related to the firm (Luehrman, 1997). According to another article from Luehrman, he sees APV as a better valuation tool than WACC, if we intend to value the company by parts instead of as a whole, and if the financial structure of the firm tends to change from period to period (this would imply a correction of the WACC in every period).
In a more formal approach to the DCF valuation (Luehrman, 1997), one can employ a Monte Carlo simulation to compute the expected cash flows of a firm, thus reaching the expected values with a smaller error margin (Samis and Davis, 2014).
Relative Valuation
“In relative valuation, we value an asset based upon how similar assets are priced in the market” (Damodaran, 2006). We can use market multiples from similar firms to value ours, or use the value of comparable transactions to assign a price to our firm. Due to the complexity of these deals and the significant variants of each one, one can understand that this model is very limited.
Nevertheless, a study by Dittmann and Weiner concluded that the error could be minimized, in the Portuguese case, by selecting comparable firms from the top 15 European countries or from the OECD.
Based on a study of 51 transactions, Kaplan and Ruback found that the estimates of DCF valuation perform better than a relative valuation, be it through multiples or comparable transactions. However, it was also found that the best estimates came from the employment of both DCF and relative valuation combined, which I’ll be using in my thesis.
Other Methods
Accounting and liquidation valuation are possible ways to value a company, but they’re faulty by nature. Since they are made by valuing only the present assets or by valuing the assets if sold at the present time, respectively (Damodaran, 2006), the value of the firm will be smaller compared to a DCF valuation, as it will imply either disregarding future investments or selling at a discount.
Options-based models are also possible, being mostly used for future investments or individual projects (Luehrman 1997).
Mergers and Acquisitions Does It Create Value?
According to Bruner, “the fashionable view seems to be that M&A is a loser’s game”. However, the searches he made revealed very few indications of this assumption.
There are, of course, reasons for this way of thinking. Often there are misevaluations of synergies (Sirower and Sahni, 2006), or managing teams that suffer from the “fever” of the deal and end up paying too high of a premium for a particular deal.
In his research, however, Bruner finds that M&A does pay. After screening numerous studies, he finds positive returns for the target firm (as expected), for the acquirer firm (77% of studies analyzed showed “value preservation and value creation”) (Bruner, 2004) and for the combined firm (all 24 studies screened showed positive returns).
The next step is to find the drivers of this positive return and how they manifest in the new merged entity.
Strategy
If there is an M&A deal taking place, there is a strategy behind it. Managers often use the strategic rationale argument to back the deals they intend to make (Eccles et al., 1999), but doing so should need an appropriate structure of tought (Sirower and Sahni, 2006).
Sirower and Sahni provide a “Capabilities/Market Access Matrix” and a “Synergy Mix” graph.
Figure 1 - Capabilities / Market Access Matrix and Synergy Mix
Within this framework, a manager can support and explain the rationale for each deal, and where synergies come from.
Synergies
“Synergy is the additional value that is generated by combining two firms, creating opportunities that would not be available to these firms operating independently.” - (Damodaran, 2005) However, they often aren’t achieved through M&A due to misevaluations (Sirower and Sahni, 2006), over optimism, poor planning (Damodaran, 2005) or an “irrational exuberance about the strategic importance of the deal” (Eccles et al., 1999).
Hence, knowing when it appears and in what form, is critical for a proper valuation of the target firm. In his research, Damodaran highlighted three types of value created: Operating synergies, financial synergies and the value of control. I will now analyze each in greater detail.
Operating Synergies
such as facility optimization and elimination of duplicate functions and revenues, that could come from using the new channel provided by the target firm to distribute current or future products. (Cullinan et al., 2004)
Mergers can also promote a growth in economies of scale, promote pricing strength due to a competition decrease or increase the growth potential of the firm, both in volume and time period (Damodaran, 2005).
Financial Synergies
“When considering financial synergies, one should be careful and skeptical” - António Borges de Assunção, February 15, 2018 during the M&A thesis seminar at CLSBE Besides possible tax benefits, other synergies mentioned in the literature such as financial engineering (Eccles et al., 1999), diversification benefits or a higher debt capacity (Damodaran, 2005) are difficult to be computed with significant accuracy and might affect the final valuation with biased assumptions. Hence, in my work, I will refrain from considering them.
Control
In a paper by Dyck and Zingales, a study was made to infer the value of private benefits of control. Based on 393 transactions across 39 countries between 1990 and 2000, they found that “on average, corporate control is worth 14 percent of the equity value of a firm”. Even though the transactions occurred quite in the past, an argument is made regarding the importance of computing the value of control.
This value comes from the power of influencing the investment policy (having the choice of investing in projects that will be rewarding and cutting off the ones which failed), the financing policy (being able to change the capital structure to its optimal setting) and the dividend policy (the power of returning extra cash to the investors that wasn’t used due to lack of profitable projects) (Damodaran, 2005).
Payment Method
When defining the payment method, one can use cash, stock, a mix of both (Faccio and Masulis, 2005) or earnout contracts (Zenner et al., 2008).
is chosen if there are risks of bankruptcy due to high leverage. Also, in Cross-border cases, stock is less likely to be chosen due to “equity flowback”, which can be defined as limitations by regulation or by the target’s shareholders acceptance of the acquirer’s stock (Zenner et al., 2008).
Cross-Border Mergers and Acquisitions
Cross-Border M&A has been on the rise since the beginning of the century (Zenner et al., 2008) and it’s easy to grasp why: the power of globalization, the need of well-established firms for geographic diversification and the decreasing trend of protective regulation towards international trade (Zenner et al., 2008) act as long-term catalysts for such a rise.
This type of deals are also powered by the very characteristics of the firms involved: cultural and geographic distance, the increase in the quality of accounting disclosure, the difference in tax rates and the economy performance all play a part (Erel et al., 2012).
Implications
When performing cross-border deals, several parameters must be analyzed in order to fully grasp the implications of this type of deal.
Firstly, the financing will be affected, as new options appear. With a cross-border deal, the acquiring firm will now have better access to foreign financing (both equity and debt) and will be able to profit from a wider selection of financing possibilities (Zenner et al. 2008).
Secondly, we should also look into corporate governance. “Corporate governance concerns the enhancement of corporate performance via the supervision, or monitoring, of management performance and ensures the accountability of management to investors” (Kasey and Wright, 1997) and, in these cases, the merged company “will share features of the corporate governance systems” (Bris and Cabolis, 2004). Thus, the value of the firm may be affected due to these changes.
“When global investors look at deals, particularly cross-border deals, they will often factor corporate governance issues into the equation, and these may have a practical effect on price and value.” – Peter Clapman, Senior Vice-president and Chief Counsel Investments, TIAA-CREF (from Alexander, 2000)
Lastly, the valuation of the firm will also be affected by tax changes, accounting differences and different risks inherent to each country of origin (Zenner et al., 2008), such as political, economic and currency risk.
Industry Overview
In this chapter, I’ll be giving a broad analysis on the energy sector, where both companies that are being studied have their operations, and then focusing on their home countries and the types of energy sources they possess. I will then give a projection of the expected future for each type of energy source and, lastly, an analysis of the M&A activity in this sector will take place, complemented with an analysis of the recent RWE/E.ON deal in Germany, this latter one present in Annexes 1, 2, 3 and 4.
I will be focusing on the electricity and gas sectors, both distribution and network access, as well as renewable energy sources such as wind and solar power.
Energy
According to the World Bank, the energy sector has been growing throughout the years at a steady pace, with consumption levels and global energy access rates maintaining their upward trend. Being a crucial sector, and with urbanization levels rising, this steady increase in consumption is to be expected.
What makes this sector so interesting is the constant change it faces regarding the energy source used for the production of electricity, now looking towards natural gas and renewables, powered by technological advances and governmental policies. Based on the World Energy Outlook made by the International Energy Agency (IEA), the main energy source until 2040 will be natural gas, and renewables will experience a 40% increase in demand. Coal demand shall decrease and oil demand will keep growing, but at a decreasing rate. (IEA, 2017)
The price of renewables is set to become more competitive, as economies of scale decrease the production cost and technological breakthroughs promote efficiency.
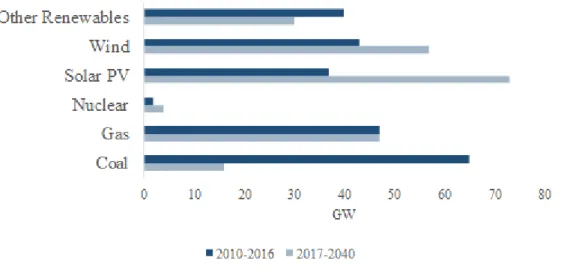
The objective for governments and international associations is for a decarbonization of the energy sector, replacing coal-powered plants with other sources (Figure 1), such as natural gas, renewables and nuclear energy, the latter also starting to be frowned upon due to waste
further and are currently discussing a potential increase to 35%” (Wilson and Evans, 2018) proving the importance of energy firms to step up and invest heavily in the sector.
Figure 2 - Net Capacity Additions. Source: World Energy Outlook 2017
Electricity
An essential commodity, the electricity industry is expected to experience a rise in consumption, reaching 40% of the final energy consumption in 2040, as world development continues and urbanization levels rise. (IEA, 2017) The countries promoting this increase in demand are mainly China and India, with Europe maintaining a slow increasing pace. (Figure 3)
Another important factor for this increase in consumption is the development and growing adoption of hybrid and electric cars. In fact, by 2040, the world car fleet is expected to reach 280 million, from only 2 million today. The main driver of this exponential increase will be China, followed by the European Union, as we can see in the following graph by the World Energy Outlook 2017.
Figure 4 - World Electric Car Fleet Forecast. Source: World Energy Outlook 2017 The electricity industry proves to be an appealing one, with worldwide investment surpassing oil and gas in 2016. (IEA, 2017) Also, this investment promotes development in efficiency and cost reductions, increasing the possible profitability of the players in the market.
Natural Gas
As mentioned before, natural gas will play a pivotal role in the energy sector for the coming years, representing 25% of world energy demand by 2040 and becoming the main fuel consumed in the world after oil, according to the 2017 World Energy Outlook’s predictions.
“This reflects the fact that gas looks a good fit for policy priorities (…) generating heat, power and mobility with fewer CO2 and pollutant emissions than other fossil fuels, helping to address widespread concerns over air quality” – International Energy Agency in the 2017 World Energy Outlook
Regarding the LNG (liquid natural gas) market, it is expected to grow through 2030 with China, India and Pakistan as the main importers, representing 80% of projected growth in the sector. Europe should maintain a “steady upward trend”. (Rossano and Filatov, 2018)
The key words one should take into account for this sector in the short and medium-term are Asia and LNG. Asian countries mentioned before, alongside a few others, will keep investing heavily in this sector to combat antipollution directives, standing as the drivers of the natural gas industry in the following years. This fact will also proppel the LNG market, to account for the increase in demand, thus discarding previous market reports that expected the LNG market to be in oversupply until 2025.
Figure 5 - Gas Imports' Change. Source: World Energy Outlook 2017
Renewables
“Solar and wind energy offer the greatest growth potential of any power technology in the longer-term, as costs continue to fall.” – Bloomberg Intelligence The renewable energy sector is undoubtedly the most exciting one from the sectors mentioned, due to the need of sustainable energy sources and the increasing profitability of these types of energy.
It is expected that, by 2030, 80% of new capacity created will be of renewable energy sources, with wind power as the main one and, by 2040, 2/3 of the world investment in energy will be towards renewables, according to the World Energy Outlook 2017.
The two renewable energy sources I will be focusing on will be wind and solar power, due to the firms’ operations.
According to Bloomberg Intelligence, “price declines per watt for solar and wind energy will continue, as scale lowers costs and technology drives efficiency gains”. (Wilson and Evans, 2018)
Regarding wind power, both onshore and offshore wind costs are expected to fall by 47% and 71% respectively, thanks to more efficient turbines and economies of scale, among other factors, says Bloomberg Intelligence.
All in all, with a consistent expected growth in profitability and a more low-carbon concern of governments and communities, having a strong presence in renewable energy sources proves to be crucial for any energy firm.
Portugal
Like the majority of the European countries, the Portuguese electricity market was progressively turned into a liberalized market, between 1995 to 2006, accounting for 93% of the total electricity market, as of January 2018. (ERSE, 2018)
With a liberalized market, consumers get to choose their electricity supplier, instead of having to settle for the supplier who was present in the area. Now, suppliers enlist on the liberalized market and compete for the consumers’ choice. With this setup, the Portuguese government aimed to achieve a more competitive market, with a bigger focus of the suppliers on price and quality competitivity, hence providing a better service to the client.
ERSE, the Portuguese energetic services regulator, divides the liberalized market into four different segments: Big Consumers, Domestics, Industrials and Small Businesses. According to the following figure, Domestic and Industrial clients account for 70% of the market (35% each), followed by Big Consumers (22%) and Small Businesses (8%).
Figure 6 - Portuguese Monthly Electricity Consumption. Source: ERSE
With 4,97 million clients and 42.907 GWh consumed, as of January 2018, according to ERSE, the liberalized market experienced a growth in 2017 of 4,4% in number of clients and 3% in annualized consumption. The entity expects the market to maintain its pace both through increased consumption and by gaining market share from regulated markets, which only account for 7% of the total market.
Just like the electricity sector, the natural gas market has also been gradually liberalized, standing at 1,14 million clients in January 2018, accounting for 97% of the entire Portuguese market. (Dinheiro Vivo)
The same four segments apply for the natural gas market, with Big Consumers accounting for the majority of the consumption (about 84%), followed by Industrials (9%), Domestics (4,9%) and Small Businesses with 1,8%.
Figure 7 - Portuguese Monthly Gas Consumption. Source: ERSE
With a total consumption of 40.804 GWh, the liberalized market has grown 9,5% in 2017 in terms of consumption and 6,3% in term of number of clients. (ERSE, 2017)
The major players in each market shall be addressed later on, when analyzing the competitors of each company.
Spain
Just like Portugal, the Spanish energy market has also been gradually liberalized, since 1997, and reaching its final setup in 2013. According to the MINETAD (Ministério de la Energía, Turismo y Agenda Digital), this new structure, where consumers can opt between the liberalized market and the PVPC (Precio Voluntário al Pequeño Consumidor). In the PVPC, the price paid by the consumer varies every hour of every day depending on the offer and demand of energy, and one can only join if the contracted power does not surpass 10kW.
The most recent data provided by the Spanish government indicates that, in 2016, the liberalized market accounted for 87,5% of the electricity market, totaling 205 GWh of electricity consumed shared amongst around 17 million consumers. This consumption suffered an annual increase of 0,8%, with a slight decrease in the production through renewable sources and an increase through nuclear energy.
Figure 8 - Spanish Electricity Consumption Weight by Segment. Source: MINETAD Regarding consumer segments, MINETAD has 34 different ones, which I was able to agglomerate into four: Industry (41%), Domestics (29%), Services (20%) and Public Administration (10%).
In the natural gas sector, the liberalized market accounted for 98% of total consumption, at the end of 2016, according to the CNMC (Comisión Nacional de los Mercados y la Competencia). Experiencing an increasing trend since 2014, the total market situates at 7,62 million consumers, reaching a total consumption of 321.009 GWh in 2016, a growth of 2,1% in regard to 2015.
Figure 9 - Historical Spanish Gas Demand. Source: CNMC
CNMC divides the gas sector in three different segments: Industry (61%), Domestic-Comercial (21%) and Energy Generation (18%).
Figure 10 - Spanish Gas Consumption Weights by Segment. Source: CNMC The first two have experienced a growth from 2015, 2,7% and 6,5%, respectively, while the latter decreased in the same period about 3,9%.
Future Growth Projections
The International Energy Outlook 2017, a study made by the Energy Information Administration with conclusions very in line with the World Energy Outlook 2017 previously mentioned, also provides expected annual growth rates for various energy sources and sectors until 2040.
I decided to collect the most relevant ones, which I used, alongside the firms’ analysis in the next chapter, to reach appropriate future growth rates in the valuation chapter. (EIA, 2017)
Electricity
- Domestic consumption in OECD countries to increase 0,3% per year - Domestic consumption in non-OECD countries to increase 1% per year - Industrial consumption in OECD countries to increase 0,5% per year - Industrial consumption in non-OECD countries to increase 1% per year - World gas-based generation to increase 2,1% per year
- World coal-based generation to decrease 1% per year
- World renewable-based generation to increase 2,8% per year
Gas
- Natural gas world consumption to increase 1,4% per year
- Natural gas consumption in OECD countries to increase 0,9% per year - Natural gas consumption in non-OECD countries to increase 1,9% per year - LNG demand is also expected to triple by 2040
Energy Sector M&A Activity
“2017 was a formative year in power and utilities transactional activity, (…) investments in the conventional energy sector were dominated by the changing generation mix, as renewable energy continued to account for an increasing proportion of the system, and low interest rates again drove yield capital toward regulated networks.” – Matt Rennie, EY Global P&U Transactions Leader on EY’s Power Transaction and Trends Q4 2017 Report
According to EY’s report, during 2017, M&A deals at a global level reached an “8-year high in terms of both value (…) and volume”, €166 billion and 516, respectively.
These values represent a 10% increase from 2016 in terms of volume, mainly supported by a 28% increase in the volume of deals in renewables, which account for 21,4% of the total deal volume.
On a European setting, deal volume increased 11% but total value decreased 1% from 2017 to €42 billion. EY connected these results to an overall flat energy demand and low pool prices. Looking into the steps in the value chain where the investment took place (Figure 10), we can see a clear focus in the renewables, with 120 deals made in 2017 (56% of total deal volume). However, in deal value, it stays on the same level of investments in networks and generation. This fact takes place since renewable investments are more usually done in stand-alone projects, and not in complete firm fusions and acquisitions.
Figure 11 - Historical European Deal Values and Volumes. Source: EY
The strategies for these investments vary from company to company, but there are trends that can be perceived. A.T. Kearney in its M&A Utilities 2017 Report and EY in its Power Transactions & Trends Q4 2017 Report highlight various rationales for these deals, which I divided into five main ones.
De-carbonization/Nuclear phaseout promote Renewables & Gas
Due to European regulations to decrease carbon emissions and the German government’s decision to abandon nuclear energy, European utilities need to turn to alternative sources of
increasing rate in profitability, promoting it on both sides of the equation (increasing revenues and continuously decreasing costs), this type of energy will not be overlooked, being the main target of future expected investments alongside natural gas.
According to EY, gas will “support system flexibility and reliability”, as it is easily stored and transported, either through existing pipelines or in LNG (Liquefied Natural Gas) form.
Retail Consolidation and Sector Convergence
Threats of tariff ceilings and cuts in the U.K. have hit the margins of the operators in the market, which now look into European utilities with presence in the U.K. for market consolidation. Another alternative expected to happen will be the bet on diversifying the portfolio of the company, by either entering or gaining exposure to energy sectors where it was not present. For example, in September 2017, Total, originally an oil and gas firm, bought 23% of Eren, a renewables firm.
Financial Investors’ Appetite Matches Firms’ Financial Needs
In a scenario of low interest rates and the expectancy of financial institutions’ clients to receive returns, financial investors look into “utility infrastructure for its higher return”. Promoting this investment, governments, who usually have high participations in national utility infrastructures, can use the sale of these assets to reduce public debt without compromising the “status quo” of the country.
Focus on the Known and the on the Profitable
Decreasing margins and political insecurities often force companies to focus on what they do best and where they do it. This trend was visible in 2017 and promises to continue in the following years, as we can see in the recent E.ON/RWE deal, where, in a complex transaction, the firms swapped various assets between themselves in order to focus on a determinate business.
According to A.T. Kearney, the energy industries that show higher returns are retail and renewables, which explains the exponential increase in renewables investment, as seen before. Examples of this choice are “Italian firm Enel (…) integrated recently with Enel Green
Power, while London-based EDF has acquired a wind farm from E.ON in the United Kingdom.”
New Energy Business Models
In an increasingly competitive market where, more often that not, margins get hit by governments policies and market liberalization, utilities need to improve their value offer if they intend to increase, or even maintain, their market share.
Investments in new energy models such as EV charging stations or battery storages present themselves as reliable value adding options to provide that extra hedge to a competitive utility. This fact also benefits new up-and-coming companies developing these exact services. In a win-win situation, leading energy firms acquire know how and the technology without going through costly and uncertain R&D projects, while these startups get the funding and the customer base they need.
Company Overview
EDP – Energias de Portugal Background
EDP – Energias de Portugal, the acquiree in this scenario, has been present in the Portuguese energy industry scene since 1976, when it started as a government-owned company. In time, it grew into a multinational firm present in 14 countries across 4 continents, having operations in every step of the electricity value chain. (Generation, distribution and supply)
It is known for its clean energy focus, being proud to confirm in their corporate website that 74% of the electricity generation of EDP comes from a renewable source. The wind and solar generation operations are present in EDP’s main subsidiary, EDP Renováveis (It will be mentioned as EDPR hereafter), headquartered in Spain. The hydro and non-renewable sources are present in the main group.
In 2011, the Portuguese government decided to sell it’s remaining stake in the electrical to the Chinese government, through a power company it controls, The China Three Gorges Corporation. (It will be mentioned as CTG from hereafter)
Shareholder Structure
In terms of EDP’s shareholder structure, and as mentioned before, the main shareholder in the firm is CTG, with a 23,27% stake in the utility.
Figure 12 - EDP's Shareholders. Source: EDP's website
The Chinese government, however, actually owns 28,25% of EDP, as CNIC, a Chinese investment fund, is also owned by the Chinese.
Regarding EDP’s control in its main subsidiaries, EDPR and EDP Brasil, Edp has 82,6% of the total share amount of EDPR. Besides other small shareholders, MFS Investment Management, a Massachusetts-based investment manager.
In EDP Brasil, EDP’s stake stands slightly above the minimim required for assured control of the firm, 51,2%. The rest of the shares are either treasury stock or belong to various American and European investment funds.
Figure 14 - EDP Brazil's shareholders. Source: EDP's website These subsidiaries will receive a closer look in the following sub-chapter.
Operations
Generation
The first step in the energy value chain is generation, and EDP is present all around the globe, having a strong presence in Portugal (electricity generation leader), Iberian Península (3rd largest) and Brazil (5th largest), according to EDP’s website.
Also, tha main sources of generation used by EDP in 2017 were: Wind (39%), Coal (31%), Hydro (16%), Combined-cycle gas turbine (CCGT) (11%), Nuclear (2%) and Solar (0,2%). In total, these add up to 26.753 MW of installed capacity, generating a whopping 70.000 GWh of electricity in 2017.
Figure 15 - Historical installed capacity EDP
As we can see from the graph above, EDP has gradually increased its total generation capacity throughout time, having already a pipeline approved until 2023.
Even though the growth of capacity seems smooth, the actual electricity generated does not follow the same trend.
Figure 16 - Historical generation EDP
As we can see, there’s a “jump” from 2015 to 2016 and a slight decrease to 2017, even though the capacity has been always growing.
According to EDP’s annual reports, 2016 experienced one of the best weather conditions ever for hydro-sourced generation, while 2017 registered one of the worst, thus explaining these results.
Distribution
Inbetween generation and supply, the distribution operations of EDP are stationed in Portugal, Spain (only in some communities in and near the Astúrias region) and in the states of São Paulo and Espírito Santo of Brazil.
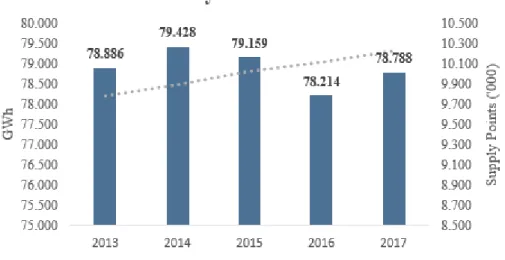
All together, EDP distributed 78.788 GWh in 2017 across its entire network of more than 245 thousand kilometres.
In 2017, EDP alienated its gas distribution operations, through the sale of EDP Gás Distribuição (Portugal) and Naturgás (Spain), keeping only its gas supply operations.
Figure 17 - Historical distribution levels EDP
Analyzing recent years, we see a clear decrease in 2016 of electricity distribution, mainly due to new regulation in the Spanish market and the situation at the time in Brazil. In a degrading economy, not only consumption fell, but new tariffs were imposed, which “led to the migration of customers to the free market in 2015 and 2016, leaving the distributors in a scenario of energy contracted higher than necessary to meet the demand”. (EDP 2016 Annual Report, 2017)
Supply
Lastly, the supply operations reside in the same geography as the distribution operations, being divided in electricity and gas supply.
Electricity
In Portugal, EDP basks in a market leader position, having, according to its annual report, 87,34% of the total market share (4,15 million consumers). However, and as mentioned in the industry overview, the market in Portugal is almost completely liberalized, preventing EDP from increasing its price. They can, still, use price decreases to clear the competition, but the margin loss wouldn’t compensate due to the duration and specificities of energy contracts. In total, the electricity supplied in Portugal amounts to 21.489 GWh.
In Spain, their market share is around 4%, about 1,1 million consumers, with the market presenting the same characteristics as the Portuguese one.
In Brazil, the market is either free or regulated, with the criteria to be free being a consumption level higher than 3000 kWh. EDP serves 3,3 million consumers in Brazil, totalling 31.501 GWh. Consequently, even though 99,99% of the customers are present in the regulated market, they only account for 43,5% of total electricity supplied.
Figure 18 - Electricity supply levels EDP
Due to the Brazilian crisis aforementioned, the decrease in the 2015 is more pronounced than in previous years. EDP managed to increase the amount supplied in the following years, but at
a slow rate. According to EDP’s annual reports, the migration of customers from the regulated to liberalized market and good weather conditions “harmed” EDP’s growth.
Figure 19 - Supply by country EDP
Regarding regions, EDP is fairly distributed between Portugal, Spain and Brazil, mitigating its dependency risk in this segment.
Gas
The remaining gas operations of EDP are the supply ones, based in Portugal and Spain, supplying 18.642 GWh in 2017.
With a total of 1,54 million customers in the Iberian Peninsula, divided in a 43/57 ratio between Portugal and Spain, respectively. Even so, 80,5% of total GWh supplied refers to the Spanish side.
Figure 20 - Gas supply levels EDP
The amount of gas supplied has been decreasing since 2015, even though the amount of customers increased for the entire time frame. According to EDP, this can be explained by a decrease in big customers’ consumption, and the new customers being domestic ones.
Other Operations
Finally, representing solely 1% of the firm’s operational revenue, we reach EDP’s consulting side.
Here, EDP provides advisory services for efficiency and development projects across the globe and throughout the energy value chain, as well as in “training, sustainable management, regulatory modelling & legal Framework and act as a Center for Technical Excellence”. (EDP’s corporate website)
From generation studies in Latin America, to distribution network development in Angola and training services in China, EDP provides these and other international services through its subsidiary EDP International.
Strategy
According to EDP’s website, EDP’s long-term stategy is composed of three main pillars: “Oriented Growth”, “Superior Efficiency” and “Controlled Risk”.
In its “Oriented Growth” pillar, the main focus is renewable energy, specifically wind, solar and hydro, but with a bigger emphasys on the wind source.
Looking into 2020 EDP Objectives investor presentation, the goal is to “achieve 75% of clean capacity”, allocate €200 million to “innovative projects” and promote energy efficiency in its products in order to “reduce overall consumption by 1 TWh”. By 2030, EDP also intends to have 90% of smart meters in Iberia.
EDP’s current clean capacity stands at 74%, so the first objective seems easily attainable. With an increase in installed capacity of already 0.8 GW in renewable-sourced projects secured for 2018, and another 0.88 GW until 2020, as seen in the following graph. A “problem-free” scenario would allow for an increase of 4,7% in clean capacity by 2020. (Investor Presentation, 2018)
Figure 21 - Projected installed capacity EDP
The majority of this increase is related to American markets (U.S., Canada and Brazil), where EDP will focus its investment in coming years. EDP already has secured projects for the U.K. and France with a total of 1.16 GW capacity, but with an expected COD (Commercial operations date) of 2022 and 2023/24, respectively.
Besides generation, EDP is also focused on growth in the Brazilian regulated networks, with 5 Greenfield transmission lines built until 2021/22 and a stake on a distribution concession in the state of Santa Catarina.
The 2nd pillar’s definition actualy includes the 3rd one, “Controlled Risk”, which focus on environmental awareness in its innovation processes and energy savings, already stresses in the 2020 EDP Objectives.
Regarding EDP’s innovation, its sight is set in 5 “Key Areas”: “Clean Energy”, “Smart Grids”, “Customer Solutions”, “Digital Innovation” and “Energy Storage”. (EDP’s company website)
Financial Performance
Looking into EDP’s financials, we can understand the weights of each operation in EDP’s business.
Taking into consideration the past 2 years, we see a clear increase in contribution from EDPR, mainly due to higher capacity and improvements in operatings costs.
Figure 22 - EBITDA contribution EDP
All other segments also move due to the previous explanations: Generation decreased with a bad hydro year and supply and distribution were affected by a loss in big consumers moving from regulated to liberalized markets.
On a broader view, the following graph displays the evolution of EDP’s main financial metrics from 2013 to 2017.
Figure 23 - EDP's financial metrics
The revenue item has been decreasing since 2014, making a strong recovery in 2017, powered by EDPR’s performance. The cost of sales has also been decreasing, with an extraordinary low point in 2016, since, in contrast to 2017, 2016 was one of the best for hydro-powered generation, thus decreasing the costs for the firm, that didn’t have to rely as much on coal and CCGT. These resulted in a slow-paced increase throught time for the EBITDA metric, while net income only recovered in 2017, with most of the recovery due to the disposal of the gas distribution assets in Portugal and Spain.
Regarding Net Debt, which consists on long-term debt net of cash and equivalents, its value was fairly stable until 2015, and then it started decreasing in the two following years. A part of EDP’s 2016-2020 plan consisted on decreasing its Net Debt/EBITDA ratio to 3x by 2020 and, with 70% of the work done in the first 2 years, it is plausible that EDP will be successful in achieving this goal in the three remaining years.
Figure 25 - Leverage EDP 2
Another leverage indicator is the amount of debt-funded assets in the firm. With the equity value increasing throughout time and the debt amount remaining fairly unchanged, EDP’s reliance on debt has been slightly dimished.
In the financial market, EDP’s share is part of the PSI-20, the top 20 Portuguese companies index. Its performance almost mimicked PSI-20’s variation until the 1st quarter of 2014. Afterwards, EDP managed to beat the Portuguese market until now.
The fact that EDP is a utility explains this fact in part, due to the growth in both utility and tech industries.
Naturgy Background
The acquirer, Naturgy, only sports this designation since 2009. In 1991, the at the time Catalana de Gas merged with Gas Madrid, creating Gas Natural, and in 2009 it finalized Unión Fenosa’s acquisition through a merger, thus creating GNF. In 2018 it changed its denomination to Naturgy.
After the 1991 merger, Naturgy started its international expansion, mainly in Europe and Latin America. Currently it operates in over 30 countries, in every step of the value chain of the electricity and gas sectors. (GNF’s 2017 Annual Report) (Naturgy’s reports are mentioned as GNF’s since the naming of past reports wasn’t changed)
The main focus of the company resides on the gas market, where it leads the Spanish and Chilean gas markets, having also a “strong presence in the energy markets of (...) México, Brazil, (...) Argentina and Peru.” (Naturgy’s corporate website)
All historical values are sourced from Naturgy’s annual accounts.
Shareholder Structure
Naturgy’s top shareholders are Criteria Caixa, one of the largest banks in Catalunia, which is ultimately owned by Fundación Bancária Caixa D’Estalvis i Pensions de Barcelona La Caixa, a Mallorca-based pension fund, CVC Capital Partners, an european private equity firm, GIP, an American infrastructure fund and Sonatrach, a power firm owned by the Algerian government, according to Reuters.
Figure 27 - Naturgy's shareholders. Source: Naturgy's website
CVC Capital Partners only became effectively Naturgy’s shareholder in the 18th of May, two months after Repsol’s decision to sell its stake to CVC.
According to The Financial Times, Repsol decided to terminate its connection to Naturgy to use the amount received to “try and compete in the Spanish energy retail market, as well as share buybacks”. The oil company could not enter these markets before due to its stake in Naturgy, a top player in these markets.
Operations
Generation
Just like EDP, Naturgy is also present in every step of the energy value chain. Starting with generation, we can see in the graph below that most of Naturgy’s generation capacity is present in Spain. The rest of the installed capacity is agglomerated in the Global Power Generation, Naturgy’s foreign generation vehicle operating in Latin America. (Naturgy’s corporate website)
Figure 28 - Installed capacity Naturgy
The generation mix is as follows: 58,89% CCGT, 22,65% renewables, 14,89% termal and 3,88% nuclear.
Naturgy has continuously invested in new capacity, however, is has decreased its capacity in Spain. According to GNF 2016-2020 strategic plan, future installed capacity will preferebly be built in Spain and Latin America, with a possibility of going to India or Southeast Asia. The “ambition for 2020”, according to GNF’s 2016 annual report, is to reach 13,6 GW of capacity in Spain, and 5,4 GW abroad.
Figure 29 - Electricity generation Naturgy
Regading actual generation, Naturgy has been increasing its output internationaly, but failed to do so at home. Even though Naturgy doesn’t dive into its analysis in the reports, the main
European Union’s focus on renewables and its new policies, Spain will have to increase its renewable proportion in the generation mix, which could be a turning point for the generation market. (GNF 2016 Annual Report)
Distribution
Electricity
According to Naturgy’s corporate website, the electricity distribution segment operates in Spain, where it holds the 3rd spot in the podium, behind only Endesa and Iberdrola.
It also operates in Argentina, Chile and Panama.
Figure 30 - Electricity distribution levels Naturgy
According to Naturgy, 2015 was a year with high demand of electricity in Spain, as well as Colombia and Panama. The acquisition of CGE, a Chilean electricity distributor, in December 2014 also contributed to the 2015 “jump”.
The decrease in 2017 came from a loss of consumption market share in Spain, due to Naturgy’s positioning (small consumers focus) and the divestment of the distribution assets in Moldova. Gas
In the gas sector, besides leading the Spanish market, it also has a strong position in Latin America, specifically “Argentina, Brazil, Chile, Mexico and Peru”. (Naturgy’s corporate
Figure 31 - Gas distribution levels Naturgy
Even though Naturgy sold its gas distribution operations in Italy and Colombia in 2017, it still managed to slightly increase its total GWh distributed, mainly due to a 14,7% increase in demand from Latin America.
Supply
Electricity
Moving on to the supply section, Naturgy serves electricity customers in Spain, sporting a 15% of market share in 2016, as well as Argentina, Chile and Panama.
Having been growing every year, the amount supplied only decreased in 2017, due to a decrease in its consumption market share, where its focus is on the domestic market and to an increase in electricity prices in Spain, according to REE (Red Eléctrica de España).
Gas
Here I include every step of the gas market process except distribution, equal to Naturgy’s own division, named Gas Infrastructure and Supply.
Naturgy has a strong procurement department, with various international contracts ensuring its safety of supply. Transport-wise, it possesses 9 LNG tankers for maritime transport and 2 gas pipelines for land. To change from natural gas to LNG and vice-versa, Naturgy also has interests in regasification plants and owns 2 liquefaction plants. (Naturgy’s corporate website)
Combining natural gas and LNG, Naturgy currently supplies around 360.000 GWh in 11 different countries, being the market leader in Spain.
Figure 33 - Gas supply levels Naturgy
In the previous graph we can see a clear trend for both regions, with Spain decreasing its consumption amount and the foreign consumption levels rising steadily.
Again, Naturgy’s positioning explains the reduction in Spain. Even with more customers every year, these are mainly domestics, instead of industrials and big consumers.
The emerging markets in Latin America combined with the international LNG sales supported the strong increase in 2017, according to Naturgy.
Strategy
The 2016-2020 strategic plan starts by listing the “three main trends” for the energy sector, which I mention in the Industry Overview chapter: focus on emerging markets, growth in renewables and gas and new energy.
Company-wise, Naturgy intends to focus its investment in networks and renewables, with a “cumulative net €14 billion investment during the period”.
On a more specific view, Naturgy intends to develop new renewables in Spain and increase its foreign generation operations, with already 4 GW of installed capacity under construction just in the Global Power Generation vehicle, increase its network reach in Chile and accelerate the growth in its other regions, invest in tankers and FSRUs (floating storage regasification unit, consisting in a tanker that can also employ regasification operations) and improve the firm’s digitalization.
Financial Performance
On to Naturgy’s financials, we start by looking in the graph below into each operation segment’s contribution to the group EBITDA (earnings before interests, taxes, depreciation and amortization).
Figure 34 - EBITDA contribution Naturgy
mentioned above, Moldova assets disposal and loss of market share, along with a bad generation year resulting in the necessity of using costier sources of generation.
Figure 35 - Naturgy's financial metrics
In the graph above, we have a snapshot of the evolution of Naturgy’s key metrics, where the standout point is the significant increase in cost of sales in 2017 (more €1.259 million compared to 2016), combined with a weak increase in the revenues (more €122 million compared to the previous year).
Naturgy disregards concerns over this situation, arguing that its a one-off situation, directly correlated to the various assets disposals during the year and “a new efficiency (...) which led to non-recurring capture costs of 110 million euros in 2017”. (Naturgy’s corporate website) The EBITDA situation will also affect the next graph, where we visualize the Net Debt/EBITDA ratio.
Figure 36 - Leverage Naturgy 1
The net debt amount has been fairly stable for the last 3 years, while the EBITDA suffered the previously explained decrease in 2017. Nevertheless, Naturgy still has a heathy leverage ratio, which will certainly fall next year, if no other one-time situations occur.
Figure 37 - Leverage Naturgy 2
Naturgy’s funding mix was stable in recent years, always around a 70/30 ratio for Debt and Equity, respectively.
Figure 38 - Share Performance Naturgy. Source: Reuters
The correlation between the two is extremely high, with Naturgy still managing to beat the index for 5 years running, showing the effect of Naturgy in the Ibex 35 and the healthy moment of the utilities sector.
Competition Analysis
Portuguese Electricity Supply
Even though EDP has around 83% of the market share of Portuguese customers, in terms of consumption it only holds 42% of the market share. This fact reflects EDP positioning, being more focused in domestic customers. EDP serves 79% of the domestic customers, but only 18% of the Industrials and 22% of Big Consumers, according to ERSE.
In total terms, EDP still leads in Portugal, with Endesa and Iberdrola (two of the main electric utilities in Spain, running close. (18% and 16% of overall market share, respectively) Naturgy’s market share stands only at 2,9% of total consumption.
EDP has been able to maintain its market share, having only decreased its position in 0,6% from 2016 to 2017. (Interms of consumption) In the same time frame, Naturgy increased its position in 0,2%.
Portuguese Gas Supply
In terms of number of customers, EDP also leads this market (57%) with Galp (24%) and Goldenergy (14%) nearby. However, regarding consumption, the one leading is Galp (59%),
while the others are nowhere near this value. (Endesa with 12%, Naturgy with 8,8%, EDP with 8% and Goldenergy with 3,9%) (ERSE, 2018)
These values represent a 2% decrease in consumption market share for EDP and a 3,2% decrease for Naturgy.
Regarding segments, EDP leads the Domestic and Small Businesses ones, with 58% and 53% market share, respectively. In the Big Consumers one, Naturgy has 9,2% of market share in the Big Consumers segment and 6,5% in the Industrials one. (ERSE, 2018)
The market positioning explains once more the difference from number of customers to consumption.
Spanish Electricity Supply
As explained in the industry review, there is still no data available for 2017, so I can only analyse 2016 market shares. There is a top 5 in this market, with Endesa leading with 32,5%, followed by Iberdrola with 22% and Naturgy with 15%. EDP and Viesgo both have around 10% market share. Naturgy has been losing market share year after year. In 2014, their market share was 21,9%. EDP has been moving in the opposite direction, coming from an 8% market share in 2014.
Spanish Gas Supply
In terms of gas consumption, the clear leader is Naturgy, with a 43,87% market share, followed by Endesa (16,81%), UFG (7,9%) and Iberdrola (7,49%). EDP plays a small part in this market, with only a 2,34% stake in the market. In terms of customers, EDP has a bigger share, 11,09%, while Naturgy has 55,73% of the customers.
Naturgy’s share of the market has been slighlty decreasing since 2014 (46%), while EDP’s share decreased from 4% in 2014. Again the market positioning takes it toll.
Share Performance Comparison
In terms of share performance, I decided to compare the previously shown EDP and Naturgy ones with the EURO STOXX Utilities Index, an utilities index tracking the performance of 21 European utilities, including EDP and Naturgy.
Figure 39 - Share performance comparison. Source: Reuters
As we can see, EDP’s performance is quite similar to Naturgy’s one, the latter having a slight advantage.
Comparing with EURO STOXX Utilities Index, both firms were able to continuously outperform the index, even though they are still highly correlated, as it’s visible in the previous graph.
Firm Valuation
Having made an “X-Ray” of both EDP and Naturgy, and thoroughly analyzed the industry and sector where these companies operate, we are now prepared to step into the valuation chapter of this thesis.
In this chapter, an individual valuation of each company will take place, as well as a valuation of the various types of synergies this M&A deal will expectedly create. Finally I will arrive at a combined firm value, as well as an analysis of the pros and cons of the deal.
Projection Methodology
The items being projected in my valuation will be as follows: Electricity Sales, Gas Sales, Others Sales, Cost of Sales, Personnel Costs, Net Other Results, Depreciation and Long-Term Investments.
With these, other items made possible due to them (Working Capital and Investment in Working Capital), and the values mentioned in the “Projection Inputs” of each firm, I will arrive at the values necessary for the FCFF (Free Cash Flow to the Firm) computation.
The projections per-se will be made possible through Monte Carlo Simulation.
Quoting Peter Dizikes, member of the MIT News Office in an artcle of the same publisher: Monte Carlo Simulation is a “statistical technique used to model probabilistic (or “stochastic”) systems and establish the odds for a variety of outcomes.”
In a more approachable definition, “a Monte Carlo Simulation uses essentially random inputs (within realistic limits) to model the system and produce probable outcomes.”(MIT News Office, 2010)
For my valuation, I decided on 5000 iterations per item, along 10 periods, each equaling one full reporting year. Even though a higher number of iterations would decrease the marginal error of these projections and thus increase its quality, a bigger data set would compromise the stability and efficiency of the Excel file where it was computed.
At a starting point, the random factor mentioned before will be inserted in the computations through a “Random Numbers” matrix. This 5000x10 matrix will be filled with random numbers between -1 and 1, ensuring a random factor with some degree of plausibility, the “within realistic limits” assurance.
This is achieved by writing in each cell of the matrix a Rand function (which delivers a random number between 0 and 1) inside a Norm.s.inv function (that returns the inverse of the standard normal cumulative distribution).
With that settled, we move on to the 7 items mentioned earlier. Each item will have two matrices. One with the log-value of the 2017 value of the respective item in period 0, and the formula for the projected random variations in the following periods, and another where I do the exponential of that matrix to arrive at the projected values of each item, in each period, for every iteration.
It’s in the formula for the log-value that I include some of the “Projection Inputs” mentioned earlier, specifically the ones related to expected variations of each item. The average of each
The following steps consist in your run-of-the-mill DCF calculations, but in matrix format.
Revenue Division
The projection of the revenues of EDP and Naturgy will be divided by energy sector: Electricity, Gas and Others. The first two also include network access revenues in that sector and the latter corresponds to the company’s remaining services, analyzed previously in the Company Overview chapter.
DCF Model Inputs
Projection Inputs
As mentioned before, the formula used for the projections uses expected growth rates in line with industry and margin projections, as well as the weights of each item in regard to total revenues and the standard deviations of each one. (Annexes 11 and 12)
The latter are calculated by computing the average and standard deviation of the corresponding values of weights from 2013 to 2017, present in both firms’ Income Statement (Annexes 5 and 8)
The projection formula also uses the correlation of each item’s growth rate to the growth rate of Total Revenues, thus ensuring projections that somewhat maintain the operational structure. (Annexes 13 and 14)
EDP
Table 1 - EDP's growth rates
Due to the random factor in the model that allows my projections to take in account unexpected exterior effects, the growth rates change throughout the years but always keeping a stable level of consistency.
Here, and using the projections of the Industry Overview, I arrived at growth rates that somewhat stay in the same course. An increase in electricity consumption, both in Europe and in Brazil, and a bigger demand for renewable-sourced energy support the 0,9% growth rate for electricity. Gas sales are expected to continue decreasing due to EDP’s strategy, thus the -0,5% rate.
The cost of sales growth rate outweighs the revenue growth, since a decrease in the company’s margins is to be expected. (Garrido, 2017) The depreciation and long-term investments increase at similar speeds, accompanying EDP’s sales growth.
Naturgy