“Sonaecom, SGPS-SA: Time to face the challenges… as always”
David Manuel Campo Maior Serra, nº 73
A Project carried out on the Equity Research course, with the supervision of:
Prof. Rosário André
THIS DOCUMENT WAS PRODUCED TO BE USED INTERNALLY AT FEUNL.
DISCLOSURES AND DISCLAIMER AT THE END OF THE DOCUMENT PAGE 1/29 SEE MORE INFORMATION AT WWW.FE.UNL.PT
Using my valuation model, I reached a target price of 1.77€. Given the current market price of 1.82€ this gives an
downside potential of 2.5% which corresponds to an hold
recommendation.
Despite the difficulties of being a small operator, Sonaecom has been able to stay above the waterline: FY08
consolidated results showed a net profit of 5 million euros and
1Q09 net profit was of 0,4 million euros. Taking into account the
actual economic conjuncture those are good news and put in
perspective a reasonable year 2009 in terms of business. I
estimate for FY09 a positive net income of 5,7 million euros.
In an industry that faces cyclically technological revolutions like the Telecom Industry, we are now assisting to the next “big
thing” in several businesses at several dimensions: Next
Generation Networks (NGN), 3G and 4G networks,
Fixed-to-Mobile convergence. This represents at the same time challenges
and threats to Sonaecom.
In addition there is a scenario of a merger with ZON that gives good perspectives about the future of Sonaecom. My
estimates provide potential synergies of about 600 million euros.
Company description
Sonaecom is a Portuguese telecom that started its business by being the third mobile operator and further expanded its businesses to the Wireline segment. Nowadays besides that it has businesses in the media sector with newspaper Público and in the information and technologies sector with SSI. Sonaecom is owned by Sonae, SGPS one of the biggest and most successful Portuguese economic group.
12JUNE 2009
S
ONAECOM
,
SGPS
–
SA
I
NVESTMENT
R
ECOMMENDATION
T
ELECOMMUNICATIONSA
NALYST:
D
AVIDS
ERRA[email protected]
Time to face the challenges…
…as always
Fair Value (Current): 1.77 €
Downside potential 2.5%
Price (as of 12-Jun-09) 1.82 €
Reuters: SNC.LS, Bloomberg: SNC PL
52-week range (€) 0.96-2.30 Daily avg. trad. Vol. 12mth 414 Market Cap (€m) 717.8 Outstanding Shares (m) 366 Free Float 17,35% Source: Euronext
SNC vs. PSI20
0,00 0,20 0,40 0,60 0,80 1,00 1,20
09-06-08 07-09-08 06-12-08 06-03-09 04-06-09 PSI20 Sonaecom
Source: Euronext
(Values in € millions) 2008 2009E 2010E Turnover 1008,5 1012 1031
EBITDA 180,4 177,6 155,7 EBITDA mg 18,5 17,5 15,1
Net Profit 5,5 -0,9 -1,5 ROE 0,06 -0,001 -0,001 Net Debt 319,7 312,5 316,5 Debt/Equity 46% 46% 35% Int. Cover 11,6 11,6 16 EV/Turnover 1,33 1,9 1,9
EV/EBITDA 7,15 10,9 12,7 P/E 0,32 nm nm
PAGE 2/29
Table of Contents
Executive Summary………3
Methodology…...3
Valuation Summary……….4
Valuation Inputs………4
Sensitivity Analysis……….5
Multiple Comparison………7
Company Overview………..9
Shareholder Structure……….10
Company Description and Forecasts……….11
Mobile………...11
Fixed…...14
SSI………...19
Media………....20
The European Telecom Market..……….22
Overview………..22
The Portuguese Telecom Market……….23
Mobile………..23
Broadband………..24
Pay-TV………..24
Fixed……….24
Merger ZON-Sonaecom – “ZONAECOM”………..25
PAGE 3/29
Executive summary
The very purpose of this report is to reach to the fair value of Sonaecom equity.
To accomplish that purpose we have to start by looking at what Sonaecom’s
businesses are and how do they make it. Secondly we have to understand who
else is in the market and how it is organised. From the first two steps, we can
understand what the major trends in the industry are and what the key value
drivers for the company are. This is very important for the next step: built a model
that captures all our assumptions about the future performance of Sonaecom and
get our so desired result: the fair value.
Methodology
The model built for the evaluation process consists in a Discounted Cash Flow
(DCF) model were the cash flows discounted are the free cash flows to the firm
(FCFF) with five years of explicit forecasts until 2014 being the rest of the cash
flows represented in the form of perpetuity. The discount rate used is the
Weighted Average Cost of Capital (WACC) and the betas are calculated by a
simple average of the industry unlevered betas. All the assumptions about the
industry are included in my forecasts of the different business segments. It is
worth to mention that for telecoms is usual the terminal value has a great weight
in the value of the company. This happens because this is an Industry with high
levels of investment in the initial years and so we expect that the cash inflows
PAGE 4/29
Valuation Summary
In table 1, below you can see a summary of the valuation components and in
table 2 a summary of the valuation inputs by segment.
Table 1: Valuation
Business EV (€m) Sonaecom stake (%) Weight (%)
Optimus Mobile 925,22 100% 87,9%
Sonae Fixed Wireline 50,48 100% 4,8%
Público Newspaper 0,13 100% 0,0%
SSI IT 76,60 100% 7,3%
Total EV (m) 1.052,4 100,0%
Debt FY09 402,54
Equity Value (m) 649,9
# shares 366,2
Per share € 1,77
Current Price € 1,82
Upside/(downside) (2,5%)
Source: Analyst Estimates
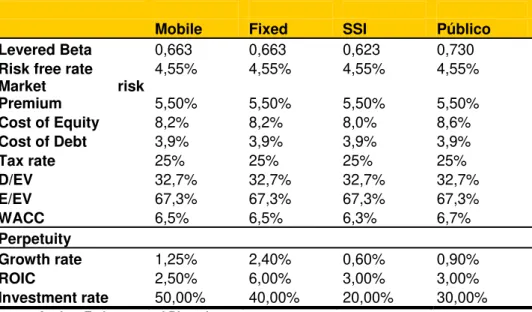
Valuation Inputs
Table 2: Valuation Inputs
Mobile Fixed SSI Público Levered Beta 0,663 0,663 0,623 0,730
Risk free rate 4,55% 4,55% 4,55% 4,55%
Market risk
Premium 5,50% 5,50% 5,50% 5,50%
Cost of Equity 8,2% 8,2% 8,0% 8,6%
Cost of Debt 3,9% 3,9% 3,9% 3,9%
Tax rate 25% 25% 25% 25%
D/EV 32,7% 32,7% 32,7% 32,7%
E/EV 67,3% 67,3% 67,3% 67,3%
WACC 6,5% 6,5% 6,3% 6,7%
Perpetuity
Growth rate 1,25% 2,40% 0,60% 0,90%
ROIC 2,50% 6,00% 3,00% 3,00%
Investment rate 50,00% 40,00% 20,00% 30,00%
PAGE 5/29
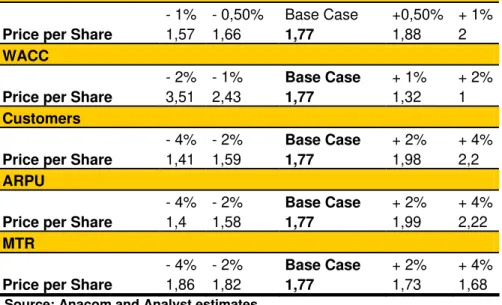
Sensitivity Analysis
Table 3: Mobile Segment ROIC
- 1% - 0,50% Base Case +0,50% + 1%
Price per Share 1,57 1,66 1,77 1,88 2
WACC
- 2% - 1% Base Case + 1% + 2%
Price per Share 3,51 2,43 1,77 1,32 1
Customers
- 4% - 2% Base Case + 2% + 4%
Price per Share 1,41 1,59 1,77 1,98 2,2
ARPU
- 4% - 2% Base Case + 2% + 4%
Price per Share 1,4 1,58 1,77 1,99 2,22
MTR
- 4% - 2% Base Case + 2% + 4%
Price per Share 1,86 1,82 1,77 1,73 1,68
Source: Anacom and Analyst estimates
Table 4: Fixed Segment ROIC
-1% -0,50% Base Case +0,50% +1%
Price per Share 1,71 1,74 1,77 1,8 1,83
WACC
-2% -1% Base Case +1% +2%
Price per Share 2,44 1,99 1,77 1,64 1,55
Direct Servicing costs
-4% -2% Base Case +2% +4%
Price per Share 2,2 1,98 1,77 1,55 1,34
Customer Revenue per Access
-4% -2% Base Case +2% +4%
Price per Share 1,76 1,76 1,77 1,77 1,78
Source: Anacom and Analyst estimates
In what concern telecoms we can see a great sensitivity to the discount rate
which we already expected. Another thing curious to note is the high sensitivity of
both segments to the direct costs and MTR (in mobile case). This indicates us
the importance that they have in cost structure of Sonaecom. Also note the how
important is for Sonaecom to have a large customer base, the larger it is the
PAGE 6/29
Table 5: SSI segment ROIC
-1% -0,50% Base Case +0,50% +1% Price per Share 1,76 1,76 1,77 1,77 1,77
WAAC
-2% -1% Base Case +1% +2% Price per Share 1,88 1,81 1,77 1,74 1,71
Turnover growth rate
-4% -2% Base Case +2% +4% Price per Share 1,72 1,74 1,77 1,79 1,82
Source: Analyst estimates
Table 6: Newspaper Segment ROIC
-1% -0,50% Base Case +0,50% +1% Price per Share 1,77 1,77 1,77 1,77 1,77
WACC
-2% -1% Base Case +1% +2% Price per Share 1,78 1,77 1,77 1,76 1,76
Turnover growth rate
-4% -2% Base Case +2% +4% Price per Share 1,76 1,76 1,77 1,77 1,77
PAGE 7/29
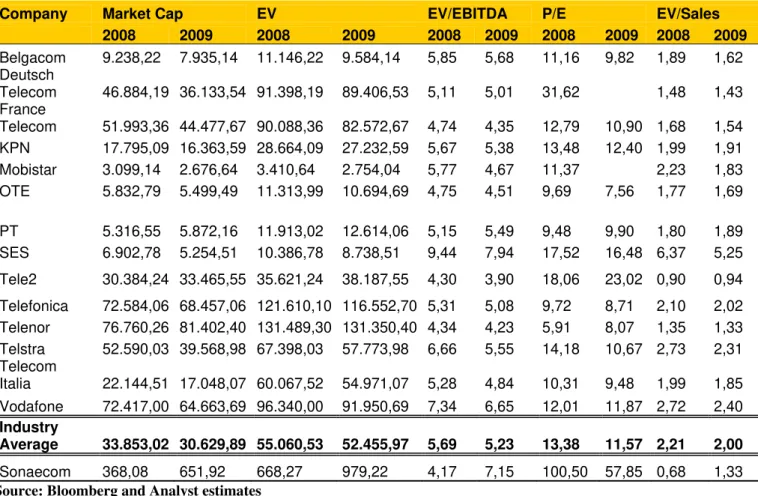
Multiple Comparison
Table 7: Comparison with Incumbents and Other large operators
Company Market Cap EV EV/EBITDA P/E EV/Sales
2008 2009 2008 2009 2008 2009 2008 2009 2008 2009
Belgacom 9.238,22 7.935,14 11.146,22 9.584,14 5,85 5,68 11,16 9,82 1,89 1,62 Deutsch
Telecom 46.884,19 36.133,54 91.398,19 89.406,53 5,11 5,01 31,62 1,48 1,43 France
Telecom 51.993,36 44.477,67 90.088,36 82.572,67 4,74 4,35 12,79 10,90 1,68 1,54 KPN 17.795,09 16.363,59 28.664,09 27.232,59 5,67 5,38 13,48 12,40 1,99 1,91
Mobistar 3.099,14 2.676,64 3.410,64 2.754,04 5,77 4,67 11,37 2,23 1,83
OTE 5.832,79 5.499,49 11.313,99 10.694,69 4,75 4,51 9,69 7,56 1,77 1,69
PT 5.316,55 5.872,16 11.913,02 12.614,06 5,15 5,49 9,48 9,90 1,80 1,89
SES 6.902,78 5.254,51 10.386,78 8.738,51 9,44 7,94 17,52 16,48 6,37 5,25
Tele2 30.384,24 33.465,55 35.621,24 38.187,55 4,30 3,90 18,06 23,02 0,90 0,94
Telefonica 72.584,06 68.457,06 121.610,10 116.552,70 5,31 5,08 9,72 8,71 2,10 2,02 Telenor 76.760,26 81.402,40 131.489,30 131.350,40 4,34 4,23 5,91 8,07 1,35 1,33 Telstra 52.590,03 39.568,98 67.398,03 57.773,98 6,66 5,55 14,18 10,67 2,73 2,31 Telecom
Italia 22.144,51 17.048,07 60.067,52 54.971,07 5,28 4,84 10,31 9,48 1,99 1,85 Vodafone 72.417,00 64.663,69 96.340,00 91.950,69 7,34 6,65 12,01 11,87 2,72 2,40
Industry
Average 33.853,02 30.629,89 55.060,53 52.455,97 5,69 5,23 13,38 11,57 2,21 2,00
Sonaecom 368,08 651,92 668,27 979,22 4,17 7,15 100,50 57,85 0,68 1,33
Source: Bloomberg and Analyst estimates
Table 8: Comparison with smaller operators
Company Market Cap EV EV/EBITDA P/E EV/Sales
2008 2009 2008 2009 2008 2009 2008 2009 2008 2009
DADA 108,98 93,78 143,33 128,13 4,60 4,11 14,37 21,51 0,84 0,76
Elisa 1.914,11 1.663,08 2.727,31 2.517,78 5,81 5,29 10,98 8,85 1,84 1,71 Eutelsat 3.884,64 3.803,10 6.199,97 6.118,42 9,12 9,00 22,39 7,06 6,97 Fastweb 1.651,38 1.443,87 3.109,33 2.894,49 6,36 5,82 259,63 72,64 1,82 1,64
Jazztel 238,67 373,03 548,19 686,83 88,53 1,59 1,87
Telnet 1.354,05 1.592,72 3.650,45 3.450,72 6,90 5,70 17,30 13,30 3,58 3,26
Tiscali 430,97 219,80 1.032,56 821,39 6,66 5,30 1,05 0,90
Zon 1.093,64 1.208,57 1.866,39 1.924,47 7,74 7,81 23,19 25,50 2,41 2,44 United
Internet 1.581,74 1.843,27 2.079,09 2.355,90 5,76 6,52 1,26 1,41
Industry
Average 1362,02 1360,13 2372,95 2322,01 15,72 6,19 57,97 23,63 2,38 2,32
Sonaecom 368,08 651,92 668,27 979,22 4,17 7,15 100,50 57,85 0,68 1,33
PAGE 8/29 Sonaecom’s is smaller the majority of the above operators in terms of
capitalization and enterprise value. Nevertheless it is worth to put things in
perspective to get an idea of where we really are.
By analysing the EV/EBITDA ratio we can say that the Sonaecom’s business
before debt obligations was being undervalued in 2008, situation that changed in
2009 being now the ratio more in line with that of the industry.
If we look at the P/E ratio the story is different and it tell us that clearly that
Sonaecom is well overvalued in relation to its peers. The difference is greater if
we compare to the large operators (as it would be expectable) but it is still
PAGE 9/29
Company overview
Graph 1: Company Organization
Source: Company Report
In 1994, the Sonae Group initiated its activity in the information technologies area, through Sonae Information Technologies.
Currently, Sonaecom is positioned in the market as an integrated
Telecommunication provider (mobile and wireline telephony and internet) and has also business in Media and Software Systems Integration areas.
Sonaecom is a sub-holding of Sonae Group and is subdivided in four units (all of them controlled at 100%): The mobile and Wireline Telecommunications under the hat of Sonaecom Serviços e Comunicações; newspaper Público; and SSI with four companies WeDo, Mainroad, Bizdirect and Saphety
In a difficult market as the Telecommunications’ market, and more specifically in a small market like the Portuguese, Sonaecom succeed to establish itself gaining a significant market share. At the present and in global terms, Sonaecom is in the group of the major telecom operators.
PAGE 10/29
Shareholder structure
Graph 2: Shareholder Structure
Sonae - SGPS 53,08% France Telecom
20% EDP 7,96% Own Shares 1,62%
Free Float 17,35%
Source: Analyst Estimates 1
Sonae – SGPS, S.A. (53,02%)
Sonae – SGPS, S.A. is one of the biggest economic groups in Portugal. It started operating in the wood derivative products in mid the last century (being nowadays world leader in that business); Latter in the eighties it entered in the food and non-food retail business through the acquisition of a supermarket and nowadays is the leader in the hypermarket segment in Portugal; additionally Sonae has interests in the Real estate business, more specifically in the shopping centre segment and in the leisure and tourism areas. Sonaecom appears has part of the diversification strategy followed by Sonae and represents its interests in the Telecommunication Industry. Although Sonae represent a parent company to Sonaecom it is Sonaecom who is held responsible to manage effectively the company, Sonae is left only with the responsibility of manage its portfolio of participations
France Telecom (20,00%)
France Telecom is present in Sonaecom’s Structure since its foundation and it has always been a strategic partner in what concerns Sonaecom’s development. Sonaecom and France Telecom have an agreement to cooperate in several areas like roaming and interconnection, multimedia services and Network links. France telecom brings expertise and knowledge to Sonaecom, crucial for its development, and Sonaecom provide an opportunity to France Telecom to expand the offered services to its clients (in geographical terms)
EDP (7,96%)
PAGE 11/29
Company description and Forecasts
Mobile
Optimus was created in 1998, being the third mobile operator to get a mobile license after TMN and Vodafone, and it is most important business unit to Sonaecom accounting for 87,9% of the total value of the company.
Optimus is present in the retail market in residential, Small and Midsize Enterprises (SME) and Corporate segments, offering a variety of products besides mobile calls like multimedia contents and mobile internet access; besides its retail offer Optimus provides also wholesale services to other operators.
The mobile market in Portugal presents signs of a mature market: high penetration rate of the service, decreasing revenues per customer and addition of new clients stabilizing. This means that opportunities for further growth are getting scarce. In the Graph 3 below we have the Net average revenue per customer1 for the three operators since 2003 to 2008. Each line represents a year. Despite the differences between the operators in each year, we can observe parallel shifts from year to year indicating that overall net revenue per customer is decreasing. Also important to note is how important the scale is in this business. Due to economies of scale TMN and Vodafone are able to dilute its fixed costs through a bigger client base having thus a small average cost per user, while Optimus with a smaller customer base has much higher average cost per customer.
Graph 3: Net Revenue per Customer vs. Customer Base
0,0 2,0 4,0 6,0 8,0 10,0 12,0 14,0
0 1.000 2.000 3.000 4.000 5.000 6.000 7.000 8.000
customer
ARP
U-CCP
U
2003 2004 2005 2006 2007 2008 Optimus
Vodafone
TMN
Source: Companies reports and analyst estimates
1
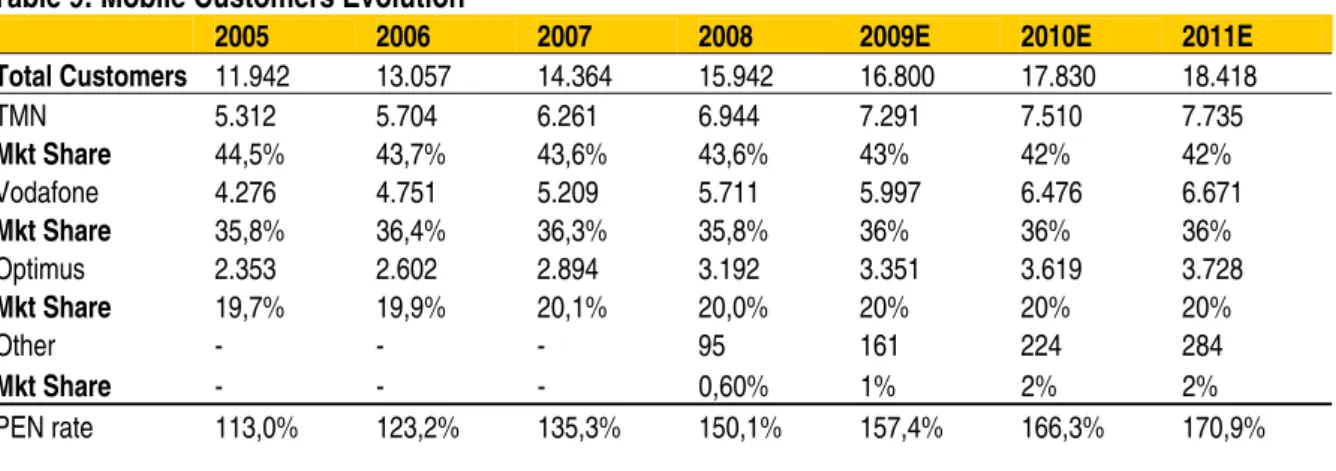
PAGE 12/29 In the table 4 we have the evolution of the Customer market shares and the penetration rate of the mobile telephony. The Market shares have been stable over the last years. Nevertheless the market has been growing and we have nowadays a penetration rate around the 150%, one of the highest in Europe (Note that there are users with more than one card and there are cards solely dedicated to machines). The other operators in the last row are the MVNO operators CTT with Phone-ix and ZON with ZON-Mobile they entered in the market in 2008.
Table 9: Mobile Customers Evolution
2005 2006 2007 2008 2009E 2010E 2011E Total Customers 11.942 13.057 14.364 15.942 16.800 17.830 18.418 TMN 5.312 5.704 6.261 6.944 7.291 7.510 7.735
Mkt Share 44,5% 43,7% 43,6% 43,6% 43% 42% 42% Vodafone 4.276 4.751 5.209 5.711 5.997 6.476 6.671
Mkt Share 35,8% 36,4% 36,3% 35,8% 36% 36% 36% Optimus 2.353 2.602 2.894 3.192 3.351 3.619 3.728
Mkt Share 19,7% 19,9% 20,1% 20,0% 20% 20% 20%
Other - - - 95 161 224 284
Mkt Share - - - 0,60% 1% 2% 2%
PEN rate 113,0% 123,2% 135,3% 150,1% 157,4% 166,3% 170,9%
Source: Companies reports and analyst estimates
One of the main concerns of the mobile operators is to gain scale in terms of customer base in order to benefit from economies of scale. As a result we are assisting nowadays to an aggressive battle, in pricing and innovation of services, for maintaining and enlarging the customer base. For instance, all the three operators have one or two tariff plans with free calls on-net, with similar prices and conditions. Optimus with “TAG”, Vodafone with “Extreme” and TMN with “Moche” are examples of that. Also the offer of convergence products (Fixed-to-Mobile) is growing. Optimus is present here with “Optimus Home”, TMN with “Casa T” and Vodafone with “Vodafone Casa”. This kind of offer is important to maintain the customer base in the sense that a customer with two or more services subscribed to an operator has a lower probability of changing to another operator, the churn rate decreases.
Another important segment in which we can observe strong competition is in the offer of 3G services, like mobile broadband access, mobile-TV and other services. For Optimus, the revenues associated with this type of services have an impressive growth rate, 54% in 1Q09 in annual terms, and its weight in the operators’ revenues is increasing dramatically, they weight 20% in 1Q09 giving an increase of 58,7% in annual terms.
3G services are regarded as the main future potential growth driver for revenues. Its penetration rate in customers with mobile phone is around 22% (4Q08), which gives some ground to this argument
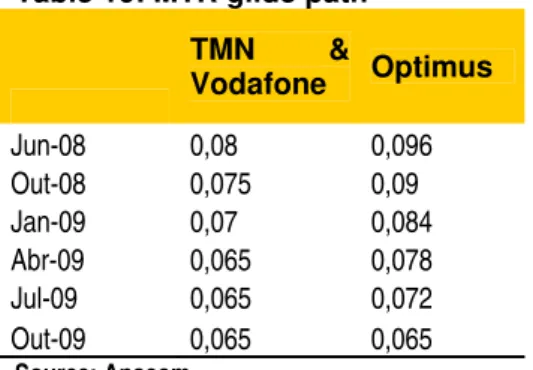
PAGE 13/29 In what concerns regulation, recently the Portuguese National Regulatory Authority (NRA), ANACOM, following the decision to decrease the level of mobile termination rates (MTR), has decided to introduce asymmetry in MTR, of 20%, in favour of Sonaecom until the end of next year.
Table 10: MTR glide path
TMN &
Vodafone Optimus Jun-08 0,08 0,096 Out-08 0,075 0,09 Jan-09 0,07 0,084 Abr-09 0,065 0,078 Jul-09 0,065 0,072 Out-09 0,065 0,065
Source: Anacom
The motivation for the decrease in Marginal Termination Rates (MTR) was provided by the following reasons:
1. Smoothing the differential of prices relatively to the European benchmark and convergence of mobile termination rates independently of the origination of the call
2. The costs that are effectively supported by the operators are significantly lower than the prices charged which gives margin to decreases in MTR with benefit of customers (the appearance of wireline services using the mobile network but still charging the fixed termination rates (lower) together with the use of proxys like the price of termination to on-net calls (lower), provide evidence the argument).
The additional decision to introduce asymmetry in favour of Optimus was taken based on the fact that the National Regulatory Authority (NRA), found evidence of significant unbalances of traffic and hence significant unbalances of payments due to differentiation of prices between on-net and off-net calls by the two major operators; also it was the believe of Anacom that the introduction of asymmetry would introduce more competition in the market which would give more benefits than costs.
MTR exist because there is a cost associated with the origination and termination of calls. MTR are supposed to cover the marginal cost of terminating a call on some operator network. It is worth to say that this cost is the same independently of the origin of the call.
In Optimus particular case, a decrease on the MTR only by itself doesn’t have a positive impact; it will decrease more the operator revenues than the operator costs. This happens because Optimus’ users originate more calls off-net than they receives (Network effect2).
With the introduction of asymmetry, the decrease in the MTRs paid more than compensates the unbalance between off-net and on-net calls providing an improvement in EBITDA margin, at least temporarily.
PAGE 14/29 We can expect to observe further cuts in MTRs since it is the politic followed by the European commissioner Viviane Reading and I incorporate this in my model.
Table 11: Impact of the Decresa in MTR in Sonaecom’s Operators revenues and Costs
2004 2005 2006 2007 2008 2009E 2010E 2011E 2012E 2013E 2014E
Interconnection revenues
(€m) 222 175,9 156,5 141,2 134,4 104,8 86,6 89,2 71,0 56,5 44,6
Interconnection costs
(€m) 140 137,9 133,2 137,4 136,3 97,7 97,6 102,4 82,3 66,2 52,7
Paid (€) 0,187 0,148 0,118 0,11 0,103 0,069 0,065 0,065 0,050 0,039 0,03
MTR
Received (€) 0,187 0,148 0,118 0,11 0,107 0,081 0,065 0,065 0,050 0,039 0,03
Source: Analyst Estimates
In my opinion it would be interesting to introduce other philosophy of taxation in this market. The introduction of Receiving Party Pays (RPP) system has opposed to what we have now Calling Party Pays (CPP) would be more effective in smoothing the network effect.
Table 12: Financial and Operating KPIs for Optimus
2008 2009E 2010E 2011E 2012E 2013E 2014E Turnover (€m) 629,1 650,3 644,3 657,1 649,4 642,8 636,2 EBITDA (€m) 142,4 190,8 177,8 156,6 157,8 159,8 160,1
EBITDA Margin (%) 22,60% 29,3% 27,6% 23,8% 24,3% 24,9% 25,2%
Operational Capex (€m) 145,6 97,5 103,1 111,7 103,9 102,9 101,8
Clientes (EoP) ('000) 3.191,6 3.351,2 3.451,7 3.555,3 3.661,9 3.735,2 3.809,9
Data as % of Service Revenues 22,50% 35,6% 42,7% 49,2% 54,1% 56,8% 59,6%
ARPU (€) 16,8 15,3 14,7 14,6 14,0 13,5 13,1
Customer 13 12,7 12,6 12,5 12,4 12,2 12,1
Interconnection 3,9 2,6 2,1 2,1 1,6 1,3 1,0
Source: Analyst Estimates and Company’s Report
Finally to conclude our analysis of mobile business of Sonaecom we can say that the future isn’t bright. The growth drivers are almost depleted – the only product growing significantly is the mobile internet access – and Sonaecom, with a low market share, will face major difficulties to compete with TMN and Vodafone in some years.
Fixed
The wireline segment is the second most important business segment to Sonaecom. Currently it represents about 5% of the total value of Sonaecom.
Sonaecom has its own wireline backbone network (in fibre) covering almost the entire national territory. For the regions Sonaecom does not provide coverage with its one network, it leases other networks. For the access network Sonaecom uses disaggregated centrals from the incumbent and the unbundled local loop (ULL) offered by the incumbent. Most of the access network is based on copper lines – the New Generation Networks (NGN) deployment, started only at the end of the last year by Sonaecom and more recently by PT.
PAGE 15/29 first, Sonaecom is offering its Pay-TV service only through IPTV technology while its competitors use a combination of satellite/IPTV or cable/satellite to offer the same service. The difference is that the competition is able to reach more clients and that reflects in a higher market share; second last year a new player as entered in the market with a very aggressive (and successful!) offer, gaining more than 13% customer base in only one year and putting more pressure in the customer base; finally, the quality of the TV and side services offered by Sonaecom is not being well perceived by the customers (or by lack of efficient marketing promotions or by poor quality of contents). This is a characteristic that does not reflect in the internet access and voice segments because here the contents of the service do not depend one the operator that is providing the service.
In order to make each customer more profitable and consequently the whole fixed segment, these three services started to be offered in bundles of two, three services or four services (the additional service is the mobile voice). The bundle offer is much appreciated not only by the customers (makes the price per service cheaper and the billing and assistance process easier) but also by the operators has it brings up the revenue per customer and diminishes the churn rate and also allows some savings in back-office and billing costs.
Graph 4: Multiple Play Market Shares
ZON 42,10%
PT 19% Cabovisão 28,70%
Sonaecom 7,60% Other 2,50%
Source: Anacom
PAGE 16/29 Graph 5 confirms what was said above by showing a considerable growth in the penetration rate by household of the bundled offers, more precisely from the 8,3% in 2006 to13,3% in 2008 (5 p.p. in two years)
Graph 5: Penetration Rate of Multiple Play by Households
0,00% 2,00% 4,00% 6,00% 8,00% 10,00% 12,00% 14,00%
2006 2007 2008
years
%
Double Play Triple Play Quadruple Play
Source: Anacom
Below are graphed the relative market positions of Sonaecom in the three different markets.
Graph 6: Fixed Voice Market Shares
PT 64,0% Sonaecom
19,1%
Vodafone 3,1%
Other 0,1% AR Telecom
0,8%
Cabovisão 7,5%
ZON 5,4%
PAGE 17/29
Graph 7: Pay-TV Market Shares
ZON 72,30% PT 13,60%
Cabovisão 12,40%
ARTELECOM 1%
Other 0,70%
Source: Anacom
Graph 8: Braodband Market Shares
ZON 31,30%
PT 41,60%
Sonaecom 12,50% Other 1%
Cabovisão 9,30% ARTELECOM
1,50%
Source: Anacom
You should note that in voice and internet segments Sonaecom is well placed: second and third places respectively. Although due to the network limitations the introduction of the Pay TV in the bundles is being compromised. The same does not happens with PT, it started it TV offer only one year ago and it as already 13% market share. Of course that the aggressive marketing campaigns helped a lot but if the service wasn’t good no one would buy it!
Sonaecom is loosing market share in all the three segments relatively to 2007 in particular in the broadband segment were it went down from 16% to 12%
Fixed to mobile convergence is also affecting the wireline business of Sonaecom. Customers prefer the mobile to fixed services if they are available in the two versions. Besides the convenience reasons of mobility this happens because: technological advances made the fixed and mobile services barely distinguishable and to the fact that those services are cheaper than fixed services.
This poses a problem fro Sonaecom in the sense that one of its businesses is cannibalising the other. This reflects in the decreasing number of accesses and new COs3 opened every year.
3
PAGE 18/29 The development of this market is being directly affected by the evolution of the mobile market and we can observe an increasing convergence between the two segments. Sonaecom is not being able to compete with other operators in particular in the multiple-play offers. This is due to the lack of scale in the market and an inefficient IPTV offer.
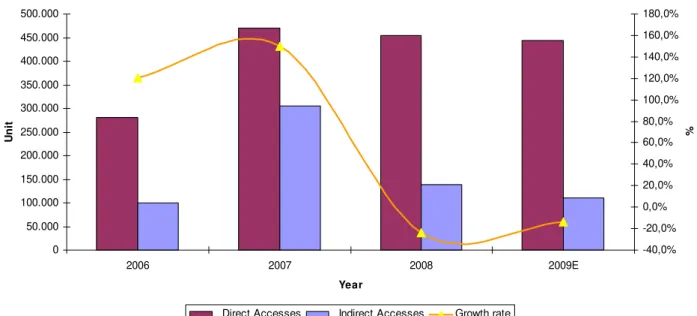
As such Sonaecom has slowed the expansion of ULL network and thus of ULL addressable market and is now focused on maintain and protect the existing client base. Below is graphed the evolution of the number of accesses in last years for Sonaecom.
Graph 9: Evolution of Sonaecom’s Accesses
0 50.000 100.000 150.000 200.000 250.000 300.000 350.000 400.000 450.000 500.000
2006 2007 2008 2009E
Year
Un
it
-40,0% -20,0% 0,0% 20,0% 40,0% 60,0% 80,0% 100,0% 120,0% 140,0% 160,0% 180,0%
%
Direct Accesses Indirect Accesses Growth rate
Source: Analyst estimates and Company’s reports
Below are the assumptions about Sonaecom Fixed:
Table 13: Financial and Operational KPIs
2008 2009E 2010E 2011E 2012E 2013E 2014E Turnover (€m) 291,4 312,0 316,9 321,1 327,9 329,4 330,7 EBITDA (€m) 14,0 15,6 20,6 21,5 22,0 27,0 28,8
EBITDA margin (%) 4,8% 5,0% 6,5% 6,7% 6,7% 8,2% 8,7%
Operational CAPEX (€m) 44,5 43,7 57,0 64,2 49,2 39,5 36,4
Total Accesses 592.900 554.362 543.274 532.409 527.085 521.814 516.596
Direct Accesses 455.027 443.489 461.783 479.168 474.376 495.723 490.766
Indirect Accesses 137.873 110.872 81.491 53.241 52.708 26.091 25.830
Source: Company Report and analyst estimates
NGN – FTTH
PAGE 19/29 discuss a possible model for the new network. However there is still no definite decision about how it would be built and what type of NGN will be built.
Just to get one idea of the magnitude of the revolution that is here to come we now have a maximum capacity of transmission with copper of 20/30Mps and with cable of 100Mps with fibre we will have between 100Mps and 1Gps! This will allow the development of a whole new range of services like VoIP, VOD, Public Network Computing, Unified Messaging, Call Centre Services, Home Manager, 3D TV…
Meanwhile in the last year Sonaecom started its ambitious investment plan in a new fibre network: 240 million euros invested in three years and covering 1 million houses. This year was PT turn to start its investment plan, investing around 500 million euros in one year to cover 1 million houses. I would say that, giving the success of the implementation of MEO last year, it will be very difficult to compete with PT, in particular because it has an important cost advantage in the deployment of fibre it doesn’t have to spent money in civil construction works represent about 60% of investment. As is known by the general public PT is the owner of the ducts were the copper or fibre cables pass, and it only is obliged to give access to operators wanting to pass copper cables. In what concerns fibber there is no legislation and so PT finds itself with a significant competitive advantage.
The final answer to the questions about the governance model and type of architecture of the NGN will define the look like of the market in a near future. For instance, depending on having access to the NGN or not, a small operators without capacity to invest alone in an alternative network, will have to find other business models or they are doomed to disappear because they would be disadvantageous position in relation to the operator with access to the NGN; On the other hand if all the operators are dividing the network, room for innovation appears and the basis for a fair competition between companies is launched, clearly for the benefit of the final consumer.
I would say that the future model of governance of the NGN will be similar to the existing one in the copper network with PT having the ownership and providing access to other operators at a fair price but only in urban areas like what happens with the ADSL offer nowadays. In what concerns the architecture of the network it would be the type GPON-FTTH, which means that every customer will have a dedicated line to his house. Although this is the most expensive architecture it is the one that delivers more quality and is the one with less maintenance costs.
SSI
Created in 2002, SSI division of Sonaecom includes four specialized companies in different areas of technology, software and information systems.
WeDo Consulting is an Information Systems consultancy company with competences in the Relationship Management, Business Intelligence, Net-business and Revenue Assurance areas.
Bizdirect provides services of eProcurement and eSellside, strategic sourcing and multi-brand IT solutions commercialisation.
Mainroad operates in information technology area, IT outsourcing, IT management, Help desk and business continuity.
PAGE 20/29 This business unit has had a good evolution in the last years, principally in the last year after the integration of Cape Technologies (specialized in Telecom Industry) in WeDo, which prompt the turnover to growth 51% in only one year! The integration of cape allowed WeDo to reach other foreign markets and that was the main source of growth. Although this amazing increase in Turnover we do not see a clear improvement in EBTIDA margin, probably that will only happen in one or two years when the consolidation is complete
Below are the assumptions used in the valuation model:
Table 14: Financial and Operational KPIs
2008 2009E 2010E 2011E 2012E 2013E 2014E Turnover (m) 120,13 126,14 131,18 135,12 139,17 141,95 144,79 EBITDA (m) 7,12 7,95 8,26 7,16 5,98 6,10 7,67 EBITDA margin (%) 5,90% 6,30% 6,30% 5,30% 4,30% 4,30% 5,30%
Operational CAPEX (m) 1,8 1,5 1,6 1,6 1,7 1,7 1,7 IT service
revenues/Employee 120,6 130,248 140,6678 151,9213 164,075 177,201 191,377 Equipment sales as %
turnover 49,3% 55% 57% 60% 62% 65% 65%
Equipment sales/employee 4.413,6 5075,64 5583,204 6141,524 6448,601 6771,031 7109,582
Source: Research Estimates and company reports
Media
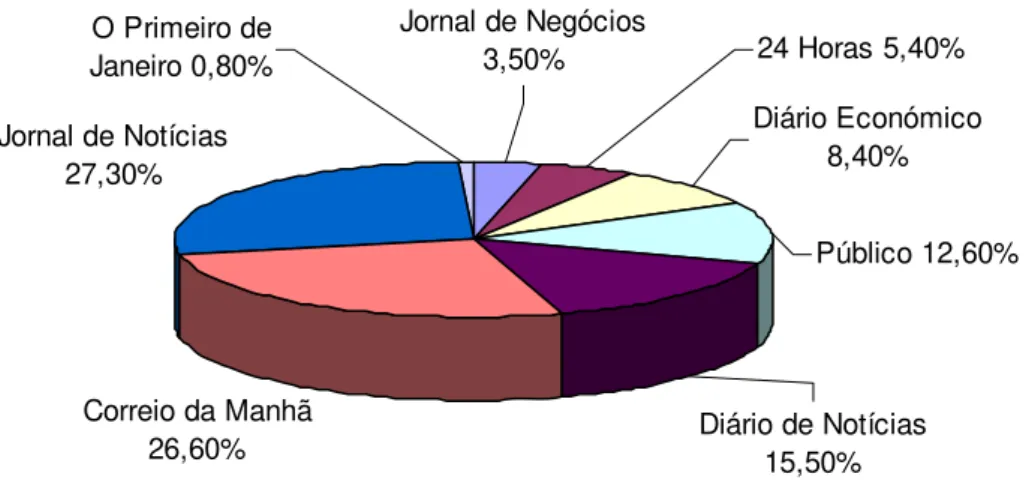
Created in 1990 by Sonae-SGPS, Público is one of the main references in daily press in Portugal. Público had about 11,5% of the average paid circulation in Portugal in 2008 and was the fourth placed in terms of advertising market share with 12,6%, right behind Diário de Notícias (its direct competitor), Correio da Manhã and Jornal de Notícias (the last two with more than 50% of advertising market share.
Graph 10: Market Shares in 2008
Correio da Manhã 26,60% Jornal de Notícias
27,30%
Diário de Notícias 15,50%
Público 12,60% O Primeiro de
Janeiro 0,80%
Jornal de Negócios
3,50% 24 Horas 5,40%
Diário Económico 8,40%
Source: Company Report
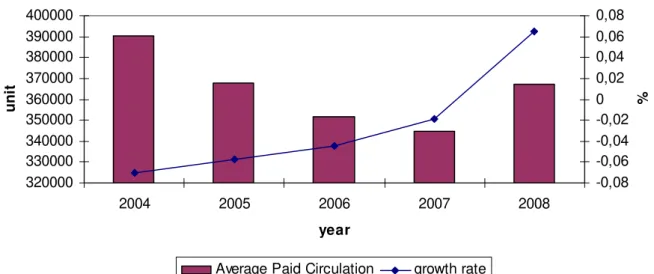
PAGE 21/29 of access the information but also additional competition for the publicity market. Also, recently free newspapers were successfully introduced in the market capturing not only a high audience but also a significant market share. This implies a stable average paid circulation, lower revenues in advertising and lower revenues in newspaper sales. In particular case of Público, from 2005 to 2008, the average paid circulation decreased 4,74%, the Revenues with advertising reduce 8% and the revenues with newspaper sales diminish 2%, on average per year.
Graph11: Evolution of the Average Paid Circulation
320000 330000 340000 350000 360000 370000 380000 390000 400000
2004 2005 2006 2007 2008
year
uni
t
-0,08 -0,06 -0,04 -0,02 0 0,02 0,04 0,06 0,08
%
Average Paid Circulation growth rate
Source: Company Report
Despite its strong brand image and its good reputation, Público has a poor financial performance presenting systematically negative EBTIDAs. We are talking about Sonaecom that has always very low or even negative results which means that it doesn’t need any more downward pushing! Not even to talk about the fact that the inclusion of a media company in the portfolio of a Telecom company is somehow odd.
The principal concern of Sonaecom’s management is control costs with Público in order to diminish the damages at the consolidated level. There are no signs of a possible sale of this business and due to the sentimental value that this asset carries only a good propose would be considered by the management
Below are the estimates for Público:
Table 15: Financial and Operational KPIs
2008 2009E 2010E 2011E 2012E 2013E 2014E Turnover 32,44 32,12 32,12 32,44 33,09 34,08 35,10 EBITDA -3,22 -3,05 -2,25 -1,46 -0,66 0,17 1,05
EBITDA margin (%) -9,90% -9,50% -7,00% -4,50% -2,00% 0,50% 3,00%
CAPEX Operacional³ 0,84 0,51 0,32 0,32 0,33 0,34 0,35
Average paid circulation 42.345 40.005 41.970 41.382 40.803 40.232 39.669 Market share of
advertising (%) 12,50% 11,80% 11,88% 11,40% 11,06% 10,84% 10,73%
Audience(%) 4,5% 4,60% 4,59% 4,68% 4,78% 4,87% 4,97%
PAGE 22/29
European Telecommunication Market
Overview
The telecommunications sector generated 361 billion euros in revenues in 2008, more 1,3 % than in 2007. The revenues generated by the sector represent around 3% of the European GDP. (the revenues growth rate has been decelerating since 2002, this is due to high penetration rate of the services
Graph 12: European Market Revenues
320 325 330 335 340 345 350 355 360 365
2005 2006 2007 2008
year
b
illio
n
e
u
ro
s
0,00% 1,00% 2,00% 3,00% 4,00% 5,00%
%
revenues (bi) g (%)
Source: Anacom
Mobile services represent 51% of the total revenues while the fixed services (Internet included) represent 49%. The main growth drivers for the telecom revenues are the mobile broadband (4 million euros in revenues in 2008) and the bundled offers.
FIXED SERVICES
This kind of service is in decline due to the substitution of this service by the mobile services and Voice over Broadband (VOB) services. This market is still leaded by far by the incumbent operators (65% revenues; 63% traffic). The competition comes mostly from the indirect accesses but the of unbundled local loops and the direct accesses (19,6%) are growing. The average price of these services has been decreasing due to the augment in competition from alternative operators, mobile operators and VOIP offers.
The total investment made by the fixed operators in 2008 was 26% of the total investment made by the sector
MOBILE SERVICES
The penetration rate of this service was about 119% (annual growth of 7%) in 2008. also around 15,5 % of the subscribers were subscribers of the 3G/UMTS services. We are assisting to a generalized decrease in the average prices of this services in part due to the competition and in part due to the regulatory decisions. The voice services are still the main source of revenues for the mobile operators 86%, while the SMS represent about 11% and the mobile broadband represents about 3%.
PAGE 23/29 The fixed broadband has a penetration rate of 22,9 accesses per 100 inhabitants (+ 2,8pp than in 2007) but the growth rate is decelerating 24% to 14% (annual growth rates).
The most used technology is the xDSL 79% of the total accesses but it is losing ground to the alternative technologies FTTx and FWA representing together 2,5% of the total accesses and having growth rates of 26% and 12% respectively. the increase n the competition has caused the decrease din prices and the increase in the velocity of transmission of the accesses (average 2 Mbps UE).
The mobile broadband is becoming an alternative to this service due to the penetration rate already reached 13% per 100 inhabitants.
The Portuguese Telecom Market
Mobile
The number of subscribers was in 4Q08 14.9 million, more 10,8% in annual terms, being the growth rates registered now are the higher of the last years. Also the proportion of post-paid subscribers is increasing being now 26% of total subscribers indicating a growth in the number of users of UMTS4 services.
The penetration rate was around 150% in 2008 (EU average is 120%). But we have to take into account that there are clients with more than one card, cards exclusively dedicated to access the internet, cards working exclusively to use on machines, and cards dedicated to enterprise cell phone.
The number of clients with UMTS access was in 4Q08 4,3 millions, increased 47,7% during the last year and represents now 29% of the total clients. Penetration rate of UMTS is 40,7% (EU average is 21,4%).
In terms of Outgoing Traffic calls it stood at 1.95 millions, more 7,8%% than in 4Q07; incoming calls were 1.95 million, 6,9% annual variation. We can watch the number of calls is increasing at a higher rate than in past years.
In what concern Outgoing minutes generated by mobile phones it were about 4.080 million, more 15,8%. While the number of incoming minutes was 4.104 millions, more 14,6%. Also the number of minutes used is increasing more than in the past years.
The increase in the usage of the mobile phone in terms of minute and in terms of calls shows us what we already expected: because of the fixed to mobile substitution effect this service has been increasing in importance in what concerns voice services.
The above market evolution shows an increase of the generalised usage of the service. This is due in part to the aggressive competitive environment that we observe in Portugal which stimulates the consumption of this service through the launching of innovative offers like those based on UMTS standard and also cheaper tariffs to the basic services. Also we observe a fixed-mobile substitution effect, hat leads to an intensive usage of the mobile services as well.
4
PAGE 24/29
Broadband
The number of customers of the fixed broadband access was 1.68 millions et the end of 2008, implying an annual variation of 8,1%.
The ADSL connection is the most used technology in this service with 58,9% of the total accesses, next is the Cable modem connection with 39,5% and finally other accesses that include fibre and FWA with 1.4%. Notice that the ADSL accesses are declining against the Cable modem and Other accesses (in fact, the others category, were FWA and fibre are included has an impressive growth rate of 156%)
This service has registered a penetration rate of 15,4% at the end 2008
Mobile accesses were 2,4 millions, an annual variation of 63%. In this segment, beside the strong growth in the number of clients, the usage of it is growing at a strong rate too. The number of active clients in the fourth quarter of 2008 grew 14% compared with the same last year.
The penetration rate of this service was in the end of 2008 of 19,8%
Pay TV
The number of cabled Households was in the 4 quarter 2008 of 4,27 million which corresponds to an increase of 5,7%. This increase is due to the expansion of alternative operators’ network mainly in the urban areas of Lisbon and Porto.
The percentage of subscribers relative to total population increased 3,4%, to 2,286 million which corresponds to a penetration rate of 21,5%. Of this number Cable TV has a 64,7% share, while DTH has 25,6% and others (including IPTV) have 9,7%. Notice that DTH is growing faster than Cable TV and for the first time was registered, in the 4Q08, a reduction in the number of Cable subscribers, which indicates a substitution of that platform by others IPTV and DTH
Fixed
Number of accesses installed was 4,1 million in 4Q08, decreasing 1,8% annually. This number corresponds to a penetration rate of 39,6%. We are assisting to a substitution of traditional fixed accesses by GSM accesses (Fixed-to-mobile substitution effect)
The total number of clients was about 3,14 millions in 4Q08 (-1,9% than in 4Q07). Within this figure we can observe also an accentuate decrease in the number of indirect clients.
The traffic registered in 4Q08 was of 2,077 million minutes equivalent to 680 million calls, being the annual variations of -2,9 and -6,7% respectively. Against this tendency is the increase of 14,3% in VOIP traffic with 74,3 million minutes in the 4Q08 and representing already 3,6% of the total minutes and 2,3% of the total number of calls.
PAGE 25/29
Merger ZON-Sonaecom – “Zonaecom”
During the last year much has been talked about a possible merger of Sonaecom with ZON. The positions of both CEO are quite different about this subject, being the CEO of Sonaecom much more willing to accept a deal of this kind than the CEO of ZON.
Also there are many divergences between the shareholders of both companies. Again in Sonaecom, with a much simpler shareholder structure than ZON, there seems to be no trouble in supporting the decision of going forward through the merger; while in ZON with a much more complex shareholder structure, things are not so peaceful. There is group of shareholders that is common to PT (BES, Visabeira, Ongoing; 18,29%) and the fact that a merger would create a major competitor to PT could not be well regarded; in addiction there is another group that has ambitions of controlling ZON (Controlinvest, Cofina and Pereira Coutinho; 10,62%) that has no good feelings also about these merger precisely because the question of control of the company. On the other side there is a group of shareholders (BPI, Joe Berardo and Telefónica; 18,83%) that considers a possible merger very positive to both companies and at the same time supports Sonaecom’s advances towards the deal. In conclusion for a successful merger of Sonaecom with ZON there would have to take place many negotiations. Due to the relative weight of each group within ZON’s shareholder structure, Sonaecom would have to make many alliances and persuade some shareholders about the true value of the merger.
There is also Caixa Geral de Depósitos whose position is always uncertain and depends clearly on the governments’ will.
Lastly, even if a deal is reached between all the shareholders it must always pass through the regulator’s seal. The fact that there is one operator less in the market could raise questions about the competitive environment in the Portuguese market. Also the fact that the merged operator will get a huge market share in the broadband segment could pose some problems. The regulator could oblige the merged company to spin-off some off its business or even block completely the deal.
Nevertheless in my estimates I consider that the regulator will let the merger pass with no major barriers.
Personally I believe that the merger of Sonaecom with Zon would bring more value to both companies. Actually it would benefit more Sonaecom than ZON but still benefit both. Analysing both companies businesses Sonaecom has only one strong consolidated and well succeeded business: mobile voice. All the other segments, Broadband, Pay-TV and fixed voice are loosing ground for competition. Even at mobile voice the market is reaching maturity and the addition of new customers will be scarcer and scarcer this means that Sonaecom is in a harsh strategic position: Internal growth opportunities near zero and no plans for international expansion. The only solution for further growth is by means of a merger.
Zon, like Sonaecom, is leader in only one market, Pay-TV, but it is in a very good position also in the broadband market. The fixed and mobile voice segments are not so developed at Zon because they were launched only a few years ago. Zon has now plans to expand internationally and it as already started by some African countries with the cinemas and the introduction of SPORTV television channel.
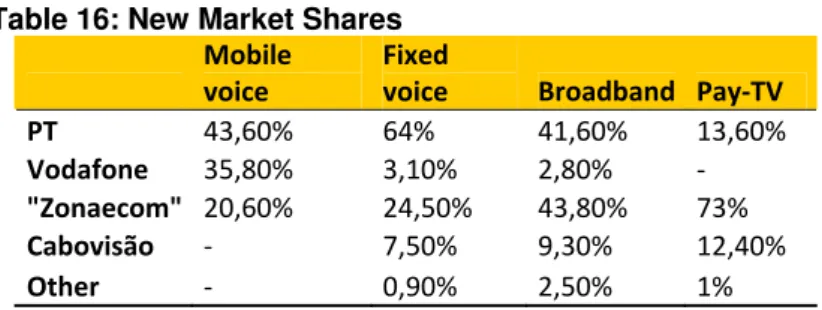
PAGE 26/29 If a merger between ZON and Sonaecom would take place the market shares would like as the following:
Table 16: New Market Shares
Mobile voice
Fixed
voice Broadband Pay‐TV
PT 43,60% 64% 41,60% 13,60%
Vodafone 35,80% 3,10% 2,80% ‐
"Zonaecom" 20,60% 24,50% 43,80% 73%
Cabovisão ‐ 7,50% 9,30% 12,40%
Other ‐ 0,90% 2,50% 1%
Source: Anacom and Analyst estimates
As you can see in the mobile voice and ion the Pay-TV market there wouldn’t be such a difference in terms of market shares. In what concerns the fixed voice market the new operator would have a greater market share but things would not become so different than what they were until here because Sonaecom alone already had a very large share in relation to other minor competitors
I believe that the major problem of this merger, in terms of regulators and market competition, would be the concentration of power in the broadband market. After the merger, Zonaecom would have 43,8% of market share, above the market share of PT 41,6%.
These estimates of market shares are conservative ones because if we consider the market power that the new company would gain than the market shares could increase even more.
In my estimates, a hypothetical merger of Sonaecom with ZON would allow the mainly gains from operating synergies:
1. High market power due to reduction of players in the market, this is more visible in the broadband market;
2. Increased capacity to offer the full bundle products (quadruple play) and possibilities of cross selling between customers of both companies, which in turn would translate into a lower churn rate that would allow increase the customer base and the revenues.
3. Cost reduction. By focusing both operators’ commercial expenditures in only one offer. Also there could be some gains by consolidating both back-office services and personnel expenditures.
Finally, from all this assumptions I estimate that a merger between these two operators would bring gains of about 600 million euros.
Table 17: Merger Valuation
Gains from synergy = 603,32
Most Zon would pay for Sonaecom = 1.647,95
PAGE 27/29 Below is a summary table with the main results of the model:
Table 18: Valuation Inputs
Zon Sonaecom
Zonaecom:No
synergy Zonaecom:(Synergy)
Free Cashflow to the
Firm $117,89 $42,70 $160,60 $191,24
Growth rate for first 5
years 3% 3% 2,63% 4,00%
Growth rate after five
years 3% 2% 2,62% 2,50%
Beta 1,10 0,66 0,96 0,96
Cost of Debt 0,06 0,04 0,05 0,05
WAAC 0,08 0,06 0,08 0,08
Cost of Equity 10,60% 8,20% 9,82% 9,82%
Riskfree Rate 4,55% 4,55% 4,55% 4,55%
D/V 35% 32,7% 35% 35%
E/V 65% 67,3% 65% 65%
Source: Company’s reports and Analyst estimates
Sensitivity Analysis
Table 29: Sensitivity Analysis to growth rate in Perpetuity
-2% -1%
Base
Case 1% 2%
Gains from synergy (€m) 286,86 442,18 603,32 770,45 943,74
Most that Zon would bid for Sonaecom (€m) 1331,49 1486,81 1647,95 1815,08 1988,37
Source: Analyst estimates
Table 20: Sensitivity Aanlysis to WACC
-2% -1%
Base
Case 1% 2%
Gains from synergy = 2.830,64 1.492,77 603,32 52,41 -379,53
Most that Zon can bid for Sonaecom = 3.875,27 2.537,40 1.647,95 1.097,03 665,09
Source: Analyst estimates
One curious thing to note in this sensitivity analysis is the fact that for a discount
rate of 10% the merger becomes value destructive instead of value creator. It is
also worth to mention that I am using a discount rate of 8% which means that the
PAGE 28/29
Sonaecom’s Financial Statements
Income Statement 2009E 2010E 2011E 2012E 2013E 2014E Turnover 1.008,5 1.012,0 1.031,2 1.034,6 1.033,4 1.032,1
Mobile 650,3 644,3 657,1 649,4 642,8 636,2
Wireline 312,0 316,9 321,1 327,9 329,4 330,7
Público 32,1 32,1 32,4 33,1 34,1 35,1
SSI 126,1 131,2 135,1 139,2 142,0 144,8
Other &Eliminations -112,1 -112,4 -114,6 -115,0 -114,8 -114,7
EBITDA 186,4 177,6 155,7 151,0 150,4 147,1
EBITDA Margin (%) 18,5% 17,5% 15,1% 14,6% 14,6% 14,3%
Depreciation & Amortization 174,3 174,0 159,8 155,0 163,0 170,7
EBIT 12,2 3,6 -4,1 -4,0 -12,5 -23,6
Net Results 162,1 170,4 163,9 159,0 175,5 194,3 Balance Sheet
Tangible and Intangible, inc
Goodwill 1.353,6 1.341,6 1.359,7 1.359,8 1.341,2 1.310,8
Cash 100,8 101,2 103,1 103,5 103,3 103,2
Clients 183,4 168,7 171,9 172,4 172,2 172,0
Other assets 336,2 337,3 343,7 344,9 344,5 344,0
Total Assets 1.974,0 1.948,8 1.978,4 1.980,5 1.961,3 1.930,1
Capital, Reserves & Own
Shares 907,3 893,2 979,3 970,5 980,3 974,3
Net income/(loss) 5,5 -0,9 0,8 9,6 -13,9 -30,4
Minority interests 0,5 0,5 0,5 0,5 0,5 0,5
Total Equity 913,3 892,8 980,6 980,6 966,9 944,4
Interest Bearing Debt 420,5 413,7 343,2 343,2 338,4 330,5
Suppliers 201,7 202,4 206,2 206,9 206,7 206,4
Others 438,5 440,0 448,3 449,8 449,3 448,8
Total Liabilities 1.060,7 1.056,1 997,8 1.000,0 994,4 985,7 Total Liabilities + Total
Equity 1.974,0 1.948,8 1.978,4 1.980,5 1.961,3 1.930,1 Free Cash Flow Statement
Profit after tax 5,5 -0,9 0,8 9,6 -13,9 -30,4
Add back depreciation 174,3 174,0 159,8 155,0 163,0 170,7
Cashflow from Operations 179,8 173,1 160,6 164,6 149,1 140,3
Change in NWC 36,8 -15,8 -2,6 -0,5 0,2 0,2
Subtract CAPEX 143,2 162,0 177,9 155,1 144,4 140,3
Cashflow from Investment 180,0 146,3 175,3 154,6 144,6 140,4 Free Cash Flow 1,3 26,8 -14,7 10,0 4,5 -0,2
Change in Equity -21,2 -19,6 87,0 -9,6 0,2 7,9
Change in minority interests 0,0 0,0 0,0 0,0 0,0 0,0
Change in Net Debt 20,0 -7,2 -72,4 -0,4 -4,7 -7,7
Cashflow from financing -1,3 -26,8 14,7 -10,0 -4,5 0,2
PAGE 29/29
Disclosures and Disclaimer
This report has been prepared by a Masters of Finance student following the Equity Investment Fund course within the Integrative Work Project for exclusively academic purposes. It was produced to be used solely internally at FEUNL. The author is the sole responsible for the information and estimates contained herein and for the opinions expressed, which exclusively reflect his/her own personal judgement. All opinions and estimates are subject to change without notice. NOVA or its faculty accepts no responsibility whatsoever for the content of this report nor for any consequences of its use.
The information contained herein has been compiled by students from sources believed to be reliable, independent and public, but NOVA or the students make no representation that it is accurate or complete and accept no liability whatsoever for any direct or indirect loss resulting from the use of this report or its content.
The author hereby certifies that the views expressed in this report accurately reflect his/her personal opinion about the subject company and its securities. He/she has not received or been promised any direct or indirect compensation for expressing the opinions or recommendation included in this report.
The author of this report may have a position, or otherwise be interested, in transactions in securities which are directly or indirectly the subject of this report.
NOVA may have received compensation from the subject company during the last 12 months related to its fund raising program. Nevertheless, no compensation eventually received by NOVA is in any way related to or dependent on the opinions expressed in this report.
The School of Economics and Management at NOVA is a public university thus not dealing for, advising or otherwise offering any investment or intermediate services to market counterparties, private or intermediate customers.
This report may not be reproduced, distributed or published without the explicit previous consent of its author, unless when used by NOVA for academic purposes only. At any time, NOVA may decide to suspend this report reproduction or distribution without further notice.
Professionals. New York: McGraw-Hill
Damodaran, Aswath Damodaran. on Valuation: Security Analysis for Investment and Corporate Finance.
Helfert, Erich A. 2001. Financial Analysis: Tools and Techniques, a Guide for Managers. New
York: McGraw-Hill
Benninga, Simon. 2000. Financial Modeling. Cambridge: The MIT Press
Copeland, Tom, Tim Koller andJack Murrin. 2000. Valuation: Measuring and Managing the Value of Companies. New York: John Wiley & Sons
OECD Communications Outlook 2007. OECD 2007
Gruber, Harald. 2005. The Economics of Mobile Telecommunications. Cambridge: Cambridge
University Press
Majudmar, Sumit K., Ingo Vogelsang and Martin E. Cave. 2002. Hand book of Telecommunications Economics, Vol l and ll. North Holand
Other References
Anacom, Situação das Comunicações 2008. Publicações ANACOM, 2009
Anacom, Informação Estatística do Serviço de Comunicações Electrónicas Móveis: 4.º Trimestre de 2008. Publicações ANACOM, 2009
Anacom, Informação Estatística do Serviço de Acesso à Internet 4º Trimestre de 2008.
Publicações ANACOM, 2009
Anacom, Informação Estatística do Serviço Telefónico Fixo 4.º Trimestre de 2008. Publicações
ANACOM, 2009
Anacom, Serviços de Televisão por Subscrição Informação estatística 4º Trimestre de 2008.
Publicações ANACOM, 2009
Elixmann, Dieter, Dragan Ilic, Dr. Karl-Heinz Neumann, Dr. Thomas Plückebaum The Economics of Next Generation Access - Final Report. WIK Consult, 2008
Ovum Consulting, Estudo sobre o impacto das Redes de Próxima Geração no mercado.
Publicações ANACOM, 2008
Akdogu, Evrim Gaining a Competitive Edge Through Acquisitions: Evidence from the Telecom Industry. SSRN, 2003
Rodini, Mark, Michael R. Ward Glenn A. Woroch Going Mobile: Substuitability Between Fixed and Mobile Access. SSRN, 2002
Armstrong, Mark and Julian Wright Mobile Call Termination. SSRN, 2007
Rokkas, Theodoros , Dimitris Varoutas, Dimitris Katsianis, Timo Smura, Kumar Renjish,
Mikko Heikkinen, Jarmo Harno, Mario Kind, Dirk Von Hugo and Thomas Monath On the economics of fixed-mobile convergence. Emerald Group Publishing Limited VOL. 11 NO. 3 2009