THIS REPORT WAS PREPARED BY PEDRO FRAGOSO, A MASTERS IN FINANCE STUDENT OF THE NOVA SCHOOL OF BUSINESS AND
ECONOMICS, EXCLUSIVELY FOR ACADEMIC PURPOSES.THIS REPORT WAS SUPERVISED BY ROSÁRIO ANDRÉ WHO REVIEWED THE VALUATION METHODOLOGY AND THE FINANCIAL MODEL. (SEE DISCLOSURES AND DISCLAIMERS AT END OF DOCUMENT)
See more information at WWW.NOVASBE.PT Page 1/31
M
ASTERS IN
F
INANCE
M
ASTERS IN
F
INANCE
E
QUITY
R
ESEARCH
A bet on Macro
Bankia was the institution that received the largest chunk of the international financial aid package that was granted to Spain, as it posted a EUR 19 bn net loss on 2012.
With the implementation of the Restructuring Plan, the bank managed to boost operational efficiency, but some non-core investments still need to be disposed. There is not great expectation that this activity will yield significant cash flow for Bankia.
Reached a time when the Balance Sheet is cleaned of all
assets to be divested, Bankia’s value driving component is expected to be the Net Interest Income.
Net Interest Income is pressured by the fall in yields that is expected to continue for some more 4-5 years, as long as the ECB maintains its Quantitative Easing program.
Bankia plans to increase the share of Corporate & SME loans in its Loan Portfolio, in a manoeuvre to capture higher interest income as a result of higher rates.
The plan is contingent, however, to the recovery of the market of lending to Corporate & SME clients, one of the segments most hit during the financial crisis.
Significant losses related to Sareb bonds are a risk that can materialize in the future.
Company Description
Bankia is a Spanish commercial bank operating in national territory, offering traditional banking products. In 2012 it was nationalised by the Spanish State to dodge bankruptcy.
B
ANKIA
C
OMPANY
R
EPORT
B
ANKING
S
ECTOR
J
ANUARY2016
S
TUDENT
:
P
EDRO
F
RAGOSO
pedro.fragoso.2014@novasbe.pt
Recommendation: Hold
Price Target FY16: 0.95 €
Price (as of 7-Jan-16) 1.01 €
Reuters: BKIA.MC, Bloomberg: BKIA.SM
52-week range (€) 0.99-1.38
Market Cap (€bn) 11.67
Outstanding Shares (bn) 11.52 Source:Bloomberg
Source:Reuters
(Values in € millions) 2014 2015E 2016F Net interest Income 2,927 2,318 2,229 Gross Income 4,008 3,392 3,327 Net Income (Before
Dividends) 771 490 952
Cost to Income 43.5% 52.2% 53.2% NPL ratio 12.9% 12.8% 12.9% Loans to Deposits 74.8% 79.0% 84.4%
ROE 6.5% 4.0% 7.9%
ROA 0.3% 0.2% 0.4%
EPS 0.070 0.043 0.083
P/E (recurrent)* 13.17 12.19 11.44 Source:Company Data and Analyst’s Estimates
*Target Price FY2016 / Forecasted EPS 2016 0
20 40 60 80 100 120 140
Bankia vs IBEX 35 - base July 2011
BANKIA COMPANY REPORT
PAGE 2/31
Table of Contents
COMPANY OVERVIEW ... 3
WHERE IT ALL BEGAN ... 3
BUSINESS DESCRIPTION ... 5
SHAREHOLDER STRUCTURE ... 6
BANKIA’S OPERATIONS
... 6
THE LOAN PORTFOLIO ... 6
... 8
THE BOND PORTFOLIO ... 8
FUNDING ... 10
THE BANKING SECTOR ...11
THE SPANISH CASE ... 12
REGULATORY FRAMEWORK ... 15
COMPETITIVE POSITIONING ...16
VALUATION ...18
INCOME ... 18
EXPENSES ... 20
COST OF EQUITY ... 22
RESULTS &SENSITIVITY ANALYSIS ... 23
RELATIVE VALUATION ... 24
RISK ANALYSIS ...25
SPANISH ECONOMY ... 25
LAWSUITS ... 26
SAREB ... 27
APPENDIX ...29
BANKIA COMPANY REPORT
PAGE 3/31
Company Overview
Born as a result of the merger of seven cajas de ahorros (savings banks), Bankia
now stands as a major player in the Spanish Banking sector, being the 4th largest
commercial bank by market capitalization.
Where it all began
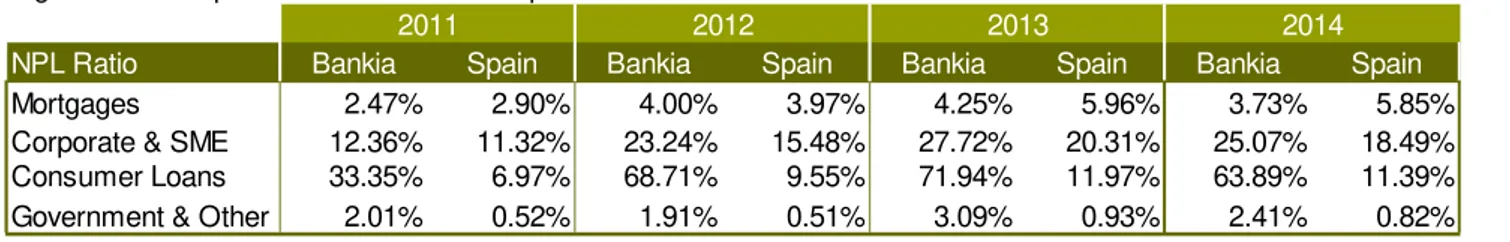
The year was 2010 and the Spanish ailing Real Estate market continued to
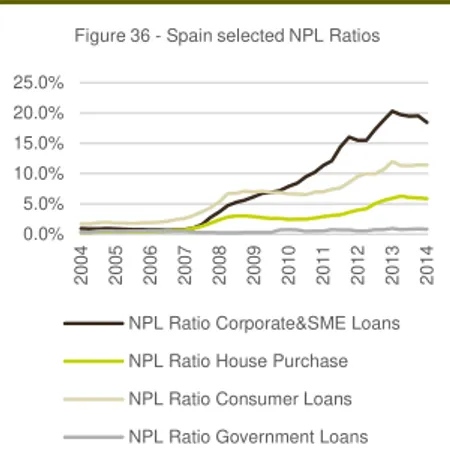
deteriorate the quality of the assets of the country’s banks. Since the turn of the century, Spain enjoyed a bull run on house prices, with the price per square meter increasing 136% (11.32% CAGR) up until 2008 end, to reach EUR 2,018, prompting overinvestment. Helped by the ever increasing collateral valuations, the amount of Credit destined to House Purchases soared 335% from 2000 to 2008 (a 20.19% CAGR). However, 2008 served as the turning point on the lending behaviour of banks, as non-performing loans on this segment started to be more and more expressive (sharp increase in the Non-Performing Loans – NPL – ratio from 0.71% in year end 2007 to 3.00% in mid 2009). The worldwide financial crisis started to take its toll on the Spanish economy: the unemployment rate more than doubled from 2007 to 2010 (8.80% to 20.30%), contributing to increasing non-performing loan volumes. This behaviour was also present in the Corporate & SME loan market, more specifically with Construction and Real Estate segments where total loan volumes increased at a CAGR of 28.42% in the years from 2000 to 2008 (total increase of 640%), while enjoying NPL ratios close to 1% on average. From 2008 to 2010 this loan volume contracted 8.42% and the NPL ratio increased from 5.72% in year end 2008 to 13.48% in year end 2010.
House prices suffered a contraction starting on 2008 (by 2010 year end they had decreased 9.56%), which lowered the market value of collateralized loans,
pressuring banks’ capital adequacy. Despite the systematic nature of the financial crisis, not all institutions were equally affected. The greatest victims of the economic turmoil were the savings banks, triggering a large round of consolidation in the sector. On the wake of this situation, the Spanish Government created in 2009 the Fondo de Reestructuración Ordenada Bancaria (FROB) as a vehicle dedicated to assist financial institutions in their capital needs.
As a result of the sector’s consolidation, in 2010, the Banco Financiero y de Ahorros (BFA) was created joining the balance sheets of 7 savings banks: Cajamadrid, Bancaja, Caja Insular, Caja de Ávila, Caja Laietana, Caja Segovia, and Caja Rioja, which would become BFA’s shareholders. As part of the consolidation process, BFA issued EUR 4,465 mm worth of convertible preference
0% 1% 2% 3% 4% 5% 6% 7%
0 100 200 300 400 500 600 700
Figure 2: Loans and NPL Ratio for House Purchase in Spain, EUR bn
Loans NPL Ratio
Source: Bank of Spain
0 500 1,000 1,500 2,000 2,500
2000 2002 2004 2006 2008 2010 2012 2014
Figure 4 - House prices in Spain (EUR/sqm)
Source: Bank of Spain
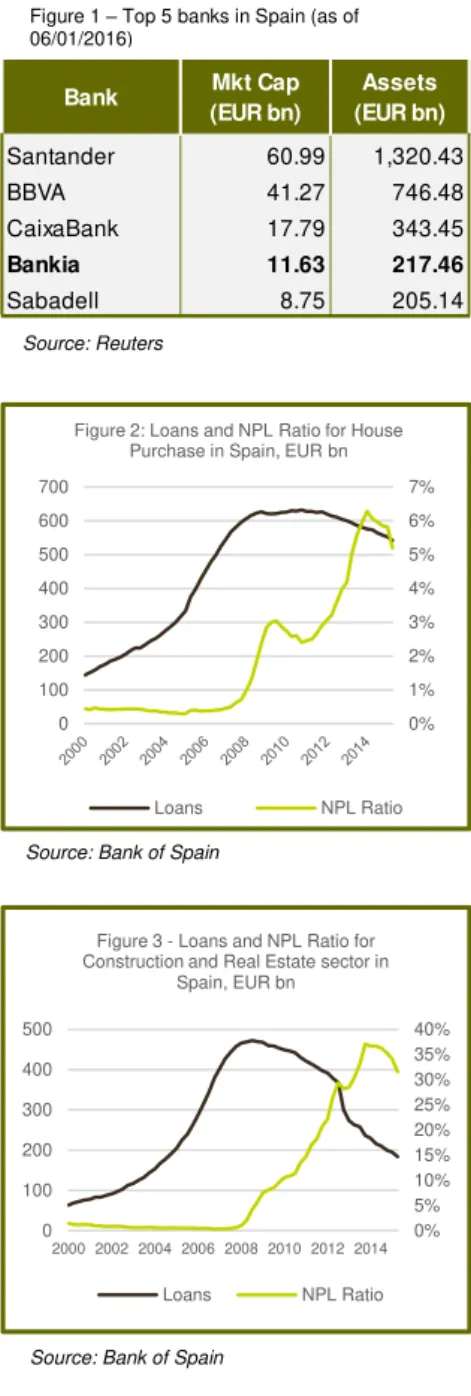
Figure 1 – Top 5 banks in Spain (as of 06/01/2016)
Source: Reuters
0% 5% 10% 15% 20% 25% 30% 35% 40%
0 100 200 300 400 500
2000 2002 2004 2006 2008 2010 2012 2014
Figure 3 - Loans and NPL Ratio for Construction and Real Estate sector in
Spain, EUR bn
Loans NPL Ratio
Source: Bank of Spain
Bank Mkt Cap
(EUR bn)
Assets (EUR bn)
Santander 60.99 1,320.43
BBVA 41.27 746.48
CaixaBank 17.79 343.45
Bankia 11.63 217.46
BANKIA COMPANY REPORT
PAGE 4/31
shares subscribed by the FROB. Bankia was created as a fully owned subsidiary of BFA, to hold the greatest part (85%) of the assets and liabilities of the seven
cajas de ahorros.
In 2011 the Bank of Spain issued a stricter set of minimum capital requirements to
be complied by financial institutions. In order to comply with the “capital principal”
ratio of 8%, Bankia went public on July 2011, raising EUR 3.09 bn from private investors, the value paid for 47.6% of the capital. BFA was left with the remaining 52.4%.
As the Bank of Spain revised its guidance for the provisions of non-performing real estate assets, the FROB converted its hybrid securities in BFA to capital (resulting in the FROB being the sole shareholder of BFA, and consequently having a controlling stake in Bankia). Still, the bank struggled to keep up with the increasingly demanding regulatory landscape, presenting negative earnings throughout the financial disclosures of 2012, fuelled by impairment losses in financial assets.
In July of 2012 Spain requested the European Commission for assistance in its efforts to improve the health of the Spanish financial system. The agreement led to the creation of an asset management company (Sareb) to strip the balance sheets off of the state intervened institutions of non-performing assets, serving as
a “bad bank”. Also, system wide and institution specific stress tests were conducted by an independent company, the results of which confirmed Bankia’s
frailties: it was the analysed institution with the highest capital needs in the base scenario (EUR 13.2 bn) and also in the adverse scenario (EUR 24.7 bn).
As a consequence of this result, further public assistance was conceded to Bankia. First, FROB contributed with a EUR 4.5 bn capital increase in BFA, which was transmitted to Bankia in the form of a subordinated loan, eligible as Tier II capital. Second, FROB increased its capital investment in BFA through the subscription of ordinary shares worth around EUR 13.5 bn, in exchange for bonds issued by the European Stability Mechanism (ESM). BFA transferred the ESM bonds to Bankia as an exchange for contingent convertible (CoCo) bonds issued by Bankia, eligible as “capital principal” in the regulatory framework. Also, BFA/Bankia transferred a share of its assets exposed to the real estate sector to Sareb, amounting to EUR 22.3 bn (the portion related to Bankia was EUR 19.4 bn), receiving in exchange bonds issued by the Sareb and guaranteed by the Spanish State.
As part of the public and international aid received, BFA/Bankia was required to comply with a Restructuring Plan set out to monitor the usage of the funds awarded to the bank, and guaranteeing that Bankia is able to meet the commitments
Figure 5 –BFA’s original Shareholder Structure
Source: European Commission
Shareholder Share
Caja Madrid 52.06%
Bancaja 37.70%
Caja Insular 2.45%
Caja de Ávila 2.33%
Caja Laietana 2.11%
Caja Segovia 2.01%
Caja Rioja 1.34%
Figure 6 – Summary of State aid to BFA/Bankia
Source: European Commission
Figure 7 – State aid to other banks
Source: FROB
Description Date Value (EUR bn) FROB subscribes
preferrence shares in BFA Jun 2010 4.465 FROB subscribes ordinary
shares in BFA Sep 2012 4.50 FROB subscribes ordinary
shares in BFA Nov 2012 13.50
Total 22.465
Institution Value (EUR mm)
Catalunya Banc 9,048
Nova Caixa Galicia 5,425
Banco de Valencia 4,500
Banco Mare Nostrum 730
Liberbank 124
CEISS 604
Caja3 407
Total 20,838
Source: Company Data 1,500
1,700 1,900 2,100 2,300 2,500 2,700 2,900 3,100 3,300
BANKIA COMPANY REPORT
PAGE 5/31
assumed with its creditors and investors by 2017. For the period 2012-2015, a Strategic Plan was implemented in accordance with the Restructuring Plan. During this period, BFA/Bankia pursued a divestment plan, shedding non-core assets such as City National Bank of Florida sold in October 2015 (yielding a net gain of EUR 117 mm); it scaled back its operations by reducing its branch network from 3,083 in December 2012 to 1,974 in September 2015 (36% decrease, in line with what was set out in the plan); it reduced the number of employees from 20,005 in year end 2012 to 14,042 (a 29.8% decrease, also in line with the plan). The segmentation of the Loan Portfolio was also planned, with the objective of increasing the share of lending to Corporate & SME and seeking to reduce the exposure to the Real Estate sector to zero. The prevision was to generate EUR 52 bn of new loans by 2015, 84% of which to be allocated to Corporate & SME. The troubled path of Bankia since its inception, being by the nature of its assets arising from institutions hit the most in the financial crisis, being by corporate governance alleged irregularities (the case of ex-executive chairman Rodrigo Rato) contributed for a bad performance in the financial markets, offering an annualized return of -56.87% since its market flotation (on adjusted terms for the 2013 reverse stock split).
Business description
Bankia operates throughout Spain, having a strong presence in the Madrid and Valencia areas (corresponding to the former biggest shareholders, Cajamadrid and Bancaja). It follows the business model of a traditional commercial bank, offering services to both retail and business clients. On year end 2014, Bankia held a market share of 8.4% in deposits from Spanish residents (excluding the Government and Credit Institutions) and also an 8.4% market share on the total amount of gross loans in the Spanish financial system (excluding Credit Institutions).
Retail Banking
The Retail segment is the business where Bankia has the most customers (72.13% in 2014). The range of services offered to retail clients includes deposit accounts (sight deposits, term deposits and savings accounts), loans (mortgages and general consumer credit) and others including credit cards and insurance, through a partnership with Mapfre. It also offers asset management and investment advisory services to clients of high net worth.
0 5 10 15 20 25 30 35 40 45 50
Figure 10 - Bankia Share Price evolution since IPO
Source: Reuters
0.04% 11.18%
9.16%
7.49% 72.13%
Figure 11 - Bankia's Customer Segmentation, 2014
Private Banking Personal Banking Preferential Management SMEs and Micro Entreprises Retail Costumers
Source: Company Data 10,000
12,000 14,000 16,000 18,000 20,000 22,000
Figure 9 - Bankia's number of employees evolution
BANKIA COMPANY REPORT
PAGE 6/31
Business Banking
Bankia holds a strong presence in the business segment, counting with around 20,000 customers in its client portfolio, representing about 34.8% of the total clients in the Spanish market. The Restructuring Plan sets out the objective to increase the weight of the business lending, and as such, in 2013 the bank launched a plan focused on SME lending with the objective of having EUR 43.5 bn in new loans by 2015. As of September 2015, 75.63% of this objective was met, with new loans to businesses amounting to EUR 32.9 bn since 2013.
In 2014, Bankia created a new credit line targeting SMEs with a reduced funding
cost. The “Prestamo Dinamización” resulted from the cheaper funding for the bank
from the ECB through a TLTRO facility, which decreased the cost of lending to the clients in about 30%. From the EUR 2.78 bn awarded to Bankia, EUR 1.39 bn were already granted to clients by year end 2014.
Shareholder structure
Bankia’s majority shareholder as of 2014 end was BFA with 62.21% of the share capital. The remainder of the capital is held by private and institutional investors, traded on the stock exchanges of Madrid, Barcelona, Valencia and Bilbao. As part of the Restructuring Plan accorded with the European Commission, BFA ceased to be a credit institution starting January 2014.
As a consequence of the conversion of the preferred convertible shares held by
the FROB in the first outlay of public assistance given to BFA, BFA’s capital
became 100% property of the FROB, leaving the previous shareholders (the seven
cajas de ahorros) out of the shareholder structure. As the FROB is a public
mechanism, the ultimate owner of Bankia is the Spanish state.
Bankia did not distribute any dividends in the years from 2011 to 2014. However, in 2015 the governing bodies of Bankia approved a dividend distribution of EUR 201.6 mm.
Bankia’s Operations
Bankia’s income sources are in their majority the Loan and the Bond Portfolios.
The Loan Portfolio
It is possible to segment the loan offer (to non-financial counterparts) of Bankia into 4 different types of lines: House Purchase (referenced interchangeably as Mortgages), Corporate & SME, Consumer Loans and Government & Other. At its inception, Bankia had the greatest share of loans in the Mortgage segment, at 54%
62.21% 19.60%
14.33% 3.86%
Figure 13 - Bankia's Shareholders, 2014
BFA Foreign Institutions
Retail Spanish Institutions
0 50 100 150 200
2011 2012 2013 2014
Figure 14 - Bankia's Loan Portfolio evolution, EUR bn (net loans)
Mortgages Corporate & SME
Consumer Loans Government & Other
54.00% 57.53% 61.63% 61.50%
38.86% 33.31% 31.24% 30.59% 3.01% 1.61% 1.83% 1.97% 4.12% 7.55% 5.29% 5.94%
0% 20% 40% 60% 80% 100%
2011 2012 2013 2014
Figure 15 - Bankia's Loan Portfolio segmentation (net loans)
Mortgages Corporate & SME
Consumer Loans Government & Other Source: Company Data
Source: Company Data, Analyst’s
estimates
Source: Company Data, Analyst’s
estimates 0 2,000 4,000 6,000 8,000 10,000 12,000
Figure 12 - Bankia's new Business Lending (EUR mm)
Source: Company Data
BANKIA COMPANY REPORT
PAGE 7/31
of its EUR 181.11 bn of Loan Portfolio carrying value, followed by Corporate & SME
with a share of 38.86%.
The line of Consumer Loans is the one that bears the highest NPL ratios (estimated2 63.89% in 2014 year-end). Bankia has been decreasing its exposure
to these assets, from a carrying amount of EUR 5.46 bn in 2011 to EUR 2.22 bn in 2014 (a 59.34% contraction). The decrease in the balance sheet amount of this item should benefit the bank, and a future increase is not expected, as Bankia shifts its lending activities efforts to target the Corporate & SME clients.
Although the guidance from the company (since 2012) is to shift the weight of the Loan Portfolio to the Corporate & SME segment, Bankia is having difficulties in the attainment of this objective, with the share of Corporate & SME lowering to 30.59% in 2014, from 33.31% in 2012.
First the Spanish credit market for Corporate & SME behaved very differently from the House Purchasing credit market one in the period 2012-2014. The latter contracted from EUR 605 bn in 2012 to EUR 558 bn in year end 2014 (a 7.78% contraction) while the former stood at EUR 830 bn in year end 2012 contrasting with the value of EUR 674 bn for December 2014 (an 18.76% contraction). So, the evolution of the Spanish credit market saw the Corporate & SME segment shrink at a faster rate than the credit volumes destined to House Purchase by households, negatively impacting Bankia’s ability to increase its business credit portfolio, as it
would need to significantly improve its market share in this segment in order to meet its credit refocusing strategy (the market share of Bankia in the Corporate & SME, in a gross loan basis, gravitated around 6% in the years between 2012 and 2014).
Second, for each 100 euros of loans conceded by Bankia for Corporate & SME
that were still in the bank’s books by 2014 end, an estimated 15.37 euros were provisioned for impairment losses. In contrast, the House Purchase segment has an impairment provision to gross loans ratio of 1.16%. This is mainly the consequence of a consistently significantly higher NPL and NPL coverage ratios for the Corporate & SME segment in comparison with the House Purchase segment.
Also, when in 2012 the transfer of eligible real estate assets to Sareb was completed, the Corporate & SME loan book suffered the biggest decline out of all the segments, some 46.10% corresponding to a loss of carrying value of an estimated EUR 38.2 bn, while the Mortgage segment only fell by 9.50%,
1 Disclosed value is EUR 182.6 bn, but an approximation is used so as to segment in the mentioned lines. 2 NPL ratios for the various segments are not disclosed, they are estimated based on the Credit Market in Spain.
0% 5% 10% 15% 20% 25% 30%
2011 2012 2013 2014
Figure 16 - Bankia's selected NPL Ratios
Total NPL Ratio Mortgages NPL Ratio Corporate&SME NPL Ratio
Source: Company Data, Analyst’s
estimates
0% 20% 40% 60% 80%
2011 2012 2013 2014
FIgure 17 - Bankia's selected NPL Coverage Ratios
Total NPL Coverage Ratio Mortgages NPL Coverage Ratio Corporate & SME NPL Coverage Ratio
Source: Company Data, Analyst’s
estimates
16.41
3.06
Figure 18 - Sareb asset transfer composition, EUR bn
Real Estate and Construction Loans
Other Real Estate Assets
BANKIA COMPANY REPORT
PAGE 8/31
representing EUR 8.1 bn. This fall explains the biggest loss of Corporate & SME share in the total Loan Portfolio, contracting from 2011 to 2012 (38.86% to 33.31%).
In comparison with the whole Spanish market, Bankia’s doubtful assets related to the Loan Portfolio are higher in value in relative terms, being the Corporate & SME
line the most relevant example, for its weight in Bankia’s credit assets.
The Bond Portfolio
Besides its lending activity to households and businesses, Bankia also holds a portfolio of bonds that constitute a major source of interest income (around 45% in 2014). The Bond Portfolio in 2014 amounted to EUR 63 bn (27% of assets) and can be segmented in 4 different bond types3.
ALCO Bonds
The ALCO Bonds represent the biggest share of the portfolio (46.6% in 2014). The purpose of these bonds is to manage Asset-Liability discrepancies in maturities and interest rates. The portfolio is composed in its majority by European sovereign debt, majorly Spanish. These bonds, being actively traded securities positively
contribute to Bankia’s liquidity position. A major setback on these securities is,
however, the consistent fall in yields of European government debt, raising reinvestment risk and pressuring Net Interest Income.
Sareb Bonds
In 2012 Bankia transferred to Sareb its eligible Real Estate non-performing assets as part of the Restructuring Plan. In exchange, Sareb issued 3 bonds with maturities of one, two and three years, with a roll over option (exercisable by Sareb) at the end of the maturities, for a total amount of EUR 19.47 bn. The bonds yield interest on a variable basis, being composed by the 3 month Euribor and a spread for each different maturity. On 2013, Sareb redeemed an estimated EUR
3 Bankia does not directly disclose the composition of the Bond Portfolio in the used segmentation. The values for each
of the types are estimations based on the company’s disclosures. Figure 19 - Comparison of Bankia's and Spain's NPL Ratios
NPL Ratio Bankia Spain Bankia Spain Bankia Spain Bankia Spain
Mortgages 2.47% 2.90% 4.00% 3.97% 4.25% 5.96% 3.73% 5.85%
Corporate & SME 12.36% 11.32% 23.24% 15.48% 27.72% 20.31% 25.07% 18.49%
Consumer Loans 33.35% 6.97% 68.71% 9.55% 71.94% 11.97% 63.89% 11.39%
Government & Other 2.01% 0.52% 1.91% 0.51% 3.09% 0.93% 2.41% 0.82%
Source: Company Data, Bank of Spain, Analyst's estimates
2011 2012 2013 2014
29
18 9
4 3
Figure 20 - Bankia's Bond Portfolio composition in 2014, EUR bn
ALCO Bonds SAREB Bonds
Non ALCO Bonds ESM Bonds
Other
Source: Company Data
15 18 21 24 27 30 33
2011 2012 2013 2014
Figure 21 - Bankia's ALCO Portfolio evolution, EUR bn
Source: Company Data, Analyst’s
BANKIA COMPANY REPORT
PAGE 9/31
882 mm of these bonds in cash, conducting another cash redemption on 2014, worth EUR 528 mm.
Cash redemptions accounted for only 8.84% of the nominal amount of bonds that matured up to 2014. Sareb paid the rest of the amount using the roll over options, by issuing new bonds with the same maturities as the bonds that are being rolled over.
Whenever a roll over option is exercised, the spreads can be renegotiated. In an environment of low interest rates, this renegotiation poses a threat to Bankia, as it incurs the risk of receiving new bonds yielding lower interest income. In fact, as figure 23 shows, the spreads on the rolled over securities have been significantly cut corresponding to losses in interest income of around EUR 105 mm in the bonds with maturity of one year and EUR 178 mm in the bonds with two year maturity.
Given Sareb’s activity being the disposal of non-performing assets, it is expected that its cash generating capabilities are not sufficient to level up the cash redemptions of these bonds, leaving Bankia with increasingly pressured Net Interest Income in the low rates environment. If the trend materializes in 2015, the renegotiation of the spread of the three year bond will carry more losses in these bonds.
ESM Bonds
Bankia received bonds from the European Stability Mechanism as payment for the capital increase the FROB subscribed in BFA. The bonds correspond to 4 out of the 5 different credit lines as set out by the ESM for the financial aid of the Spanish banking system4.
Each bond carries a different maturity and interest rate. As of 2014, Bankia had EUR 4.17 bn worth of these bonds in its balance sheet in comparison with the EUR 13.5 bn it was awarded in 2012 (the remaining bond matures in December 2015, the other 3 matured during 2013 and 2014). The maturity of the EUR 4.17 bn of the remaining active bond in year end 2015 will not result in a loss of interest income, as the interest rate on this bond is calculated as the 6 month Euribor
4 ESM release No 03/2012 of 5 December 2012
Figure 23 - Sareb Bonds' Amounts and Spreads breakdown
Bond (EUR 000's)Amount Spread (same maturity)Spain Yield (EUR 000's)Amount Spread (same maturity)Spain Yield (EUR 000's)Amount Spread (same maturity)Spain Yield
Sareb 1y 5,840,100 2.19% 2.86% 5,575,500 0.69% 1.26% 5,555,800 0.30% 0.45%
Sareb 2y 8,760,300 2.56% 3.51% 8,363,300 2.56% 1.86% 8,333,800 0.43% 0.64%
Sareb 3y 4,866,800 2.96% 4.11% 4,646,300 2.96% 2.49% 4,167,300 2.96% 0.93%
Source: Company Data
2012 2013 2014
Bond 2013 2014
Sareb 1y 265 20
Sareb 2y 397 30
Sareb 3y 221 479
Total 882 528
Source: Company Data, Analyst’s
estimates
Figure 22 – Sareb cash redemptions to Bankia, EUR mm
0.0% 0.1% 0.2% 0.3% 0.4% 0.5% 0.6% 0.7%
0 5 10 15
2012 2013 2014
A
ve
ra
ge
In
te
re
st
Rat
e
Nom
in
al
A
m
ou
nt,
E
UR
b
n
Figure 24 - Bankia's ESM Bonds and interest rate evolution
Nominal Amount
Average Interest Rate
Source: Company Data, Analyst’s
BANKIA COMPANY REPORT
PAGE 10/31
0.024% as of 20/11/2015) minus a spread of 6 basis points. As such, the maturity of this bond comes as good news, as it would yield negative interest.
Non-ALCO Bonds and other
The remaining components of the Bond Portfolio are legacy securities registered
as “Held to Maturity Investments”. It comprises both resident and non-resident government debt securities (the greatest share) and also credit institutions securities.
Funding
Deposits
Deposits are the main funding source for Bankia’s operations, representing 71.59% of total assets in 2014. The composition of the Deposits, however, has not
been constant throughout Bankia’s lifetime: repo transactions that are registered under deposits suffered a great decline from year end 2011 to 2012, cutting
Bankia’s funding by EUR 33.4 bn, heightening the difficulties in Bankia’s ability to show its assets quality, as the repo slowdown suggests counterparties’ rejection of Bankia’s collateral for the funding. Also, the combined variations of current accounts, savings accounts and term deposits (that represented the majority source of funds in 2012 in the Deposits’ segment, with a 56.62% share) suffered a decrease of EUR 19.1 bn. To compensate the funding shortage, the Bank of Spain increased its deposits in Bankia by EUR 29.5 bn (a 131.6% increase) in 2012. Despite the contribution for the Bank of Spain, the almost shutdown of the repo transactions combined with the bank run on deposits resulted in a decrease of the total amount of Deposits to EUR 188.9 bn in 2012 from EUR 206.2 bn in 2011 (an 8.39% contraction).
Also, Deposits from Credit Institutions mark a stable presence in the balance sheet of Bankia, with the total amount of funding captured by Bankia from these agents not varying considerably in the years spanning 2011-2014.
As of December 2014, Bankia’s Deposits structure was still composed at its majority by Customer Deposits (63.8%) and the Deposits from Central Banks have been experiencing a reduction, with their value on the first half of 2015 being EUR 26.7 bn, a reduction of 48.7% since the year end 2012 value.
Debt
Bankia’s Debt Securities are arranged into “Marketable Debt Securities” and “Subordinated Liabilities”.
Source: Company Data
0.0% 1.0% 2.0% 3.0% 4.0%
2011 2012 2013 2014
Figure 26 - Bankia's Deposit Costs
Deposits from Central Banks
Deposits from Credit Institutions
Customer Deposits
Source: Company Data, Analyst’s
estimates
0 20 40 60 80 100 120 140
2011 2012 2013 2014
Figure 27 - Bankia's composition of Customer Deposits, EUR bn
Fixed Term Deposits Savings Accounts
Current Accounts
Source: Company Data 0
50 100 150 200 250
2011 2012 2013 2014
Figure 25 - Bankia's composition of Deposits, EUR bn
Repos & Other Accounts
Deposits from Credit Institutions
Deposits from Central Banks
Customer Deposits
0 10 20 30 40 50
2011 2012 2013 2014
Figure 28 - Bankia's Debt composition, EUR bn
Marketable Debt Securities
Subordinated Liabilities
BANKIA COMPANY REPORT
PAGE 11/31
Marketable Debt Securities are debt issuances that transited from the seven founding cajas own balance sheets, comprising regular senior debt and mortgage
backed securities. On December 2011, when these securities were first registered in the annual consolidated accounts of Bankia, the gross amount in issue was EUR 63.3 bn (out of which EUR 39.1 bn were mortgage backed securities), which corresponded to a carrying amount of EUR 47.6 bn after adjusting for debt repurchases (Bankia is following a plan to repurchase certain mortgage covered issuances to optimize its funding structure) and other adjustments.
2014 was the year that Bankia returned to the capital markets, issuing in January EUR 1 bn worth of senior unsecured bonds, yielding an annual coupon of 3.5% and maturing in 2019. Throughout 2014 Bankia was able to tap the capital markets to raise more debt, the case of 20 new bonds (Bankia ICO Bonds) totalling EUR 194.58 mm variable rate bonds (average spread of 2% over the six month Euribor) with maturities spanning from 2 years to 6 years. Also in 2014 Bankia issued EUR 7.5 bn of mortgage covered debt.
As for 2015 year to date, Bankia issued EUR 2.25 bn of mortgage covered bonds. Regarding senior unsecured debt, Bankia raised on October 2015 a EUR 125.3 mm bond maturing in 2017 and paying an interest of 1.5%.
As for the Subordinated Liabilities, also a residual amount of liabilities were transferred from the cajas. The drastic increase from EUR 318 mm in 2011 to EUR
15.6 bn is due to the subordinated loan subscribed by BFA as part of the recapitalization of BFA dating September 2012 (EUR 4.5 bn) and to the CoCo bonds subscribed by BFA (EUR 10.7 bn). As the subordinated loan was fully repaid and the CoCo bonds converted to capital, by 2013 there were no Subordinated Liabilities in Bankia’s balance sheet. Only in 2014 Bankia issued EUR 1 bn worth of subordinated notes, at a fixed rate of 4%.
Bankia’s newfound ability to finance itself in the capital markets in 2014 provides
good sentiment on the ability to fulfil its liabilities, which suggests that any liquidity shortage for debt repayment or other urgent purpose can be countered, while rolling over debt at lower rates (assuming the low yield environment is maintained).
The Banking Sector
After a period of economic hardship followed by the global financial crisis that struck in 2008, the Eurozone starts to show signs of recovery. Real GDP has been growing at a modest pace in 2015 (average QoQ growth rates for the first three quarters is 0.4%) with domestic consumption improvement being one of the main drivers for growth. Despite this mild recovery, inflation rates stubbornly insist to be
0 1,000 2,000 3,000 4,000 5,000 6,000 7,000
Figure 30 - Bankia's Debt repayment schedule (senior), EUR mm
Source: Company Data
0.00% 0.50% 1.00% 1.50% 2.00% 2.50% 3.00% 3.50% 4.00%
01
/2
01
4
03
/2
01
4
05
/2
01
4
07
/2
01
4
09
/2
01
4
11
/2
01
4
01
/2
01
5
03
/2
01
5
05
/2
01
5
07
/2
01
5
09
/2
01
5
11
/20
15
Figure 31 - Bankia's senior bond yield (1bn issue of 2014)
Source: Bloomberg
2.90% 3.30% 3.70% 4.10% 4.50% 4.90%
Figure 32 - Bankia's subordinated bond yield (1bn issue of 2014)
Source: Bloomberg 3.5%
3.6% 3.7% 3.8% 3.9% 4.0% 4.1% 4.2% 4.3%
2011 2012 2013 2014
Figure 29 - Bankia's Marketable Debt Securities' cost
Source: Company Data, Analyst’s
BANKIA COMPANY REPORT
PAGE 12/31
close to zero, way out of the ECB’s around 2% target. As a response to these levels of inflation, the ECB started its own Quantitative Easing (QE) program in October 2014. It has since established the objective of buying a monthly amount worth EUR 60 bn of eligible debt securities in an attempt to improve financial liquidity that can be channelled to the real economy.
This situation in Europe contrasts with the USA that ended its QE program and raised reference rates in December 2015 for the first time since 2009. The differences in policy are expected to strengthen the USD, as investment flows to American securities.
On November 2015, the European Banking Authority (EBA) disclosed the results of its European Union wide transparency tests. The observed landscape was of a better capitalized financial system, with the system’s Common Equity Tier 1 (CET
1) ratio clocking at 12.6%, representing a 5.6% margin over the to be fully implemented minimum requirements of Basel 3 (in 2019). The remaining capital ratios are also above the regulatory minima. This stronger capital position is due to retained earnings and new capital issuances.
European banks profitability measured on a ROE basis is slowly progressing, averaging 3.6% in 2014 (up from 2.7% in 2013), still far from what insiders consider to be a long term sustainable level5 (range from 10% to 12%). European banks
estimated cost of equity6 has considerably declined to an average of 9.5% in
comparison with the levels from 2011 (14.6%), reflecting the lower interest rate framework.
The Spanish Case
Spain was not one of the top losers of the financial crisis on a GDP basis, seeing its output shrink 3.9% in 2009, when the Eurozone contracted by 4.6%. It was, though, one among the 5 European countries that needed a bailout in order to stabilize the domestic economy. Yields on Spanish bonds reached a peak in 2012 (7.3%), the height of the banking crisis in the country.
In the course of the years preceding the credit crunch, total credit outstanding increased at a steady 17.09% CAGR, meaning that from 2004 to 2008, the credit market in Spain almost doubled in gross terms, with the Corporate & SME segment leading the expansion with a 20.49% CAGR. After 2008 the landscape changed considerably, with the trend reverting. Gross loan amounts in 2014 contracted some 24.77% in relation to their 2008 value, representing a CAGR of
5 EBA Risk Assessment Report, June 2015 6 EBA Risk Assessment Report, June 2015
0% 1% 2% 3% 4% 5% 6% 7% 8% 20 02 20 03 20 04 20 05 20 06 20 07 20 08 20 09 20 10 20 11 20 12 20 13 20 14 20 15
Figure 35 - Spain Sovereign Yields
Spain 10 Year Yield
Spain 5 Year Yield
Spain 2 Year Yield
Source: Reuters -4.0% -3.0% -2.0% -1.0% 0.0% 1.0% 2.0% 3.0% 4.0% 5.0% 1Q0 8 3Q0 8 1Q0 9 3Q0 9 1Q1 0 3Q1 0 1Q1 1 3Q1 1 1Q1 2 3Q1 2 1Q1 3 3Q1 3 1Q1 4 3Q1 4 1Q1 5 3Q1 5
Figure 33 - Eurozone Inflation and Real GDP Growth
Real GDP Growth QoQ
Inflation YoY
Source: Reuters, OCDE
-2.0% -1.0% 0.0% 1.0% 2.0% 3.0% 4.0% 5.0% 6.0% 1Q0 8 3Q0 8 1Q0 9 3Q0 9 1Q1 0 3Q1 0 1Q1 1 3Q1 1 1Q1 2 3Q1 2 1Q1 3 3Q1 3 1Q1 4 3Q1 4 1Q1 5 3Q1 5
Figure 34 - Spain Inflation and Real GDP Growth
Real GDP Growth QoQ
Inflation YoY
BANKIA COMPANY REPORT
PAGE 13/31
-4.63%. All loan segments saw their value reduced, with the biggest loser being Credit Institutions (-8.43% CAGR) followed by Corporate & SME (-6.64% CAGR). The Government segment was an exception to this generalized decrease, with an expansion of gross loan value at an 11.43% CAGR pace.
The contraction in loan amounts coincided with the aggravation of NPL ratios: the
contraction in Spain’s GDP, the increase in the unemployment rate and the crash in the real estate prices led to a surge in underperforming loans. The most dramatic case was observed in the Corporate & SME segment, which evolved from an NPL ratio in 2007 of 0.74% to 18.9% in 2014 (year high in 2013 with 20.13%), being the Construction and Real Estate segments the most hit (0.72% in 2007 against 32.62% in 2014 and 0.53% in 2007 against 36.21% in 2014, respectively). The House Purchasing segment also suffered a blow, with an NPL ratio of 5.85% in 2014 compared with 0.71% in 2007.
Interest rates on House Purchase loans and Corporate & SME loans showed a similar behaviour throughout the last decade, with an accentuated fall from 2008 to 2011, with a recuperation up until 2013, only to fall yet again. This behaviour is closely tied to the one of the Euribor rates, which comes as a consequence of the efforts of monetary policy makers to improve the liquidity in the financial markets when banks were dealing with the setbacks of the credit crunch, and as such, were holding lending activity back.
Deposits followed a different trend than loans. There was not a clear contraction on the amount of deposits in the Spanish market. From 2004 to 2008, total deposits grew at a CAGR of 15.59%, being Term Deposits the segment that most contributed to the growth, with a CAGR of 27.29%. In the years following the inception of the crisis however, the Deposit value was kept rather constant, around the EUR 1.5 tn mark. One way to explain the difference in after-2008 behaviour of loans and deposits is, although banks can choose to scale back their credit activities on the wake of a wave of a distressed loan book, households (the majority of deposit holders, with a share of about 75% in 2014) will not, with a good degree of certainty, store their savings under the mattress or channel their deposits to international institutions. Bank runs can happen when some institution is perceived to be financially damaged in a way that might not guarantee the deposits, but the money is just transferred to other bank, being kept in the system. Interest rates on Term Deposits also followed the same trend of Euribor rates, reaching a peak in 2008 of 5%, subsequently dropping to 2% in 2010. After a small recovery in 2010-2013, current Term Deposits yield almost close to nothing.
0.00% 1.00% 2.00% 3.00% 4.00% 5.00% 6.00% 7.00% 20 03 20 04 20 05 20 06 20 07 20 08 20 09 20 10 20 11 20 12 20 13 20 14 20 15
Figure 37 - Spain's average interest rates on Loans
House Purchase Corporate & SME
Source: Bank of Spain Source: Bank of Spain
0.0% 5.0% 10.0% 15.0% 20.0% 25.0% 20 04 20 05 20 06 20 07 20 08 20 09 20 10 20 11 20 12 20 13 20 14
Figure 36 - Spain selected NPL Ratios
NPL Ratio Corporate&SME Loans
NPL Ratio House Purchase
NPL Ratio Consumer Loans
NPL Ratio Government Loans
0.0% 1.0% 2.0% 3.0% 4.0% 5.0% 6.0% 20 03 20 04 20 05 20 06 20 07 20 08 20 09 20 10 20 11 20 12 20 13 20 14 20 15
Figure 38 - Spain's interest rate on Term Deposits (new deposits)
BANKIA COMPANY REPORT
PAGE 14/31
Figures 39 and 40 below compare the evolution of the stock of loans and deposits in Spain throughout the last decade.
As a consequence of the loans and deposits’ dynamics, the operating performance of credit institutions suffered significant changes when comparing the years before the crisis and the ones after the storm had settled.
Global Interest Income of deposit taking institutions in Spain from 2004 to 2008 enjoyed a 29.90% CAGR reaching a high of EUR 147.1 bn in 2008, fuelled by a CAGR of 31.8% in interest income related to Credit Transactions. Securities’
Portfolios related income also contributed to the increase, with a CAGR of 13.14% in this period. From 2008 to 2014 the situation reversed completely, with deposit taking institutions receiving less interest income at a pace of a -14.66% CAGR reaching a low in 2014 of EUR 54.7 bn, as despite the performance of 1.6% CAGR from interest generated by Securities’ Portfolios, the -17.43% CAGR on Credit Transactions proved to be more relevant in setting the final results for the whole of the interest income. These results reveal the consequences of the contraction in the credit market and the big plunge in interest rates on 2008. The segmentation
of interest income between Credit Transactions, Securities’ Portfolios and Other
has been relatively constant throughout the years leading to 2008 (on average, Credit Transactions having an 82.8% share, Securities’ Portfolios 16.2% and
Other sources a residual 1%). Only after 2008 the share of Credit Transactions
and Securities’ Portfolio diverged, with the former obtaining an increasing weight up until 2009 (89.34%) when the latter stood at 9.03%.
Regarding the overall Interest Expense for the Spanish deposit taking institutions, it followed the same behaviour as interest income, only with higher relative swings (pre 2008 it presented a CAGR of 43.36% and after a CAGR of -20.14%). All in all, Net Interest Income in 2014 stood at EUR 27.1 bn, the same level as in 2006. In the past 10 years, deposit taking institutions have been able to post profits up until 2011, when an increase of 100% in impairment charges surrendered the income generating activities. In 2012, impairment charges reached new heights
0 500 1,000 1,500 2,000 2,500
2004 2005 2006 2007 2008 2009 2010 2011 2012 2013 2014 FIgure 39 - Spanish Loan Market segmentation (EUR bn)
Corporate & SME House Purchase Credit Institutions
Consumer Government 0 500 1,000 1,500 2,000
2004 2005 2006 2007 2008 2009 2010 2011 2012 2013 2014 Figure 40 - Spanish Deposit Market segmentation (EUR bn)
Credit Institutions Term Deposits Sight Deposits
Savings Deposits Government
0 20 40 60 80 100 120 140 160 20 00 20 01 20 02 20 03 20 04 20 05 20 06 20 07 20 08 20 09 20 10 20 11 20 12 20 13 20 14
Figure 41 - Net interest Income in Spain, EUR bn
Interest Income Interest Expense Net Interest Income
-140 -120 -100 -80 -60 -40 -20 0 20 40 20 00 20 01 20 02 20 03 20 04 20 05 20 06 20 07 20 08 20 09 20 10 20 11 20 12 20 13 20 14
Figure 42 - Net Income and Impairments of Spain, EUR bn
Impairment Charges Net Income Source: Bank of Spain
BANKIA COMPANY REPORT
PAGE 15/31
totalling EUR 116 bn, which imposed a net loss of EUR 73.7 bn for the whole of the deposit taking institutions. Bankia alone posted a EUR 19.2 bn loss, 26% of the total.
Pressured by these figures, Spain requested international aid in 2012. The Memorandum of Understanding (MoU) agreed with the European Commission in July 2012 defined a bailout package that granted EUR 100 bn to capitalize the financial system of Spain. Of that, EUR 41.3 bn were used. As for the conclusion of the program, Spain will bear the principal repayment costs starting on 2022 and ending on 2027. The amount of the international aid program that was used was in line with the stress test results that were conducted as a part of the MoU: Oliver Wyman forecasted a total capital need of EUR 16 to 25 bn in the base scenario and EUR 51 to 62 bn in the adverse scenario.
Legal reforms (Royal Decree Law, August 31 2012) prompted the necessary structural reforms to strengthen the financial system. The State was conferred more powers to intervene in endangered systemic institutions without
shareholders or creditors’ approval and more burden sharing mechanisms were implemented, with the State having the capability of imposing losses on certain debt holders in intervened institutions.
Regulatory Framework
The global financial crisis put a spotlight on banks’ fragile risk management procedures. It served as a wake-up call for regulators to tighten the grip on institutions held to be systemically important for the economy.
The Basel Committee on Banking Supervision decides on rulings that dictate the international standards for the banking sector regulation, comprising capital and liquidity control guidelines, along with the implementation of best practices in risk management and information disclosures. A review of the then incumbent regulation (Basel II) was done in 2010, in good part as a result of the events of 2008. Basel III was born and its rules were set to be implemented in a phased fashion, with full implementation by 2019.
Basel III aggregates three types of quantitative controls: risk weighted capital adequacy ratios, liquidity ratios and a general leverage ratio.
Risk weighted capital ratios establish that, at any point in time the institution has to surpass the thresholds of Common Tier 1 capital being above 4.5%, Tier 1 capital above 6% and Total Capital above 8% the risk weighted assets. An additional capital conservation buffer of 2.5% (composed of Common Tier 1 capital) is required if the institution wants to consider the possibility of paying out dividends. 2015 2016 2017 2018 2019
CET 1 4.50% 4.50% 4.50% 4.50% 4.50% CT 1 5.50% 6% 6% 6% 6% Total Capital 8% 8% 8% 8% 8% Cons. Buffer 0% 0.63% 1.25% 1.88% 2.50% Count. Buffer [0%;2.5%] [0%;2.5%] [0%;2.5%] [0%;2.5%] [0%;2.5%] LCR 60% 70% 80% 90% 100% NSFR 100%+ 100%+ 100%+ 100% 100% Leverage 3%* 3%* 3%* n/a n/a
Figure 44 – Basel 3 implementation schedule
Source: Basel Committee on Banking Supervision
0 20 40 60 80 100 RE Developers
Retail Mortgages Large Corporates SMEs Public Works Retail Other Foreclosed RE & Other
Figure 43 - Oliver Wyman Loss Forecast for Spain (2012-2014), EUR bn
Adverse Scenario Base Scenario
BANKIA COMPANY REPORT
PAGE 16/31
Also, a countercyclical buffer set between 0% and 2.5% (also composed of Core Tier 1 capital) can be imposed on institutions. National authorities have discretionary power on the enforcement of this ratio that should be higher when the economy faces a credit expansion. With the full implementation of both buffers, institutions might face, in an extreme scenario, a minimum Common Tier 1 capital of 9.5% of risk weighted assets.
Liquidity ratios comprise the Liquidity Coverage Ratio, a short term metric used to assess the capacity of the institution to face a liquidity shortage (relates high quality liquid assets to the risk exposure of net cash outflows), which should be higher than 100%. A more structural measure is also object of compliance, the Net Stable Funding Ratio, which requires that the available amount of stable funding of the institution to be higher than the amount of stable funding it needs.
The general leverage ratio was designed to weigh on and off balance sheet items of capital exposure, in a non-risk adjusted basis. The minimum requirement in test up until 2017 is 3%, in 2018 a definitive figure is due to be announced.
Competitive Positioning
Bankia’s competitors are financial institutions that make up for a significant share
of the banking sector in Spain. Bankia sets apart from the competitors by being an exclusively Spain oriented bank, and for its State backing.
Santander
Santander is the biggest listed bank in Spain by market capitalization and assets. Unlike Bankia, it has a strong international presence, with only 14% of its profit
being attributable to Spain’s operations. Its total Loan Portfolio (net) amounts to EUR 734.7 bn with an almost equitable distribution between Commercial Loans and Consumer Loans, representing 58% of its assets and securing a 13.5% market share in Spain. Its NPL ratio in 2014 stood at 5.19%, a decrease from the 5.61% in 2013. Its EUR 1.27 tn Balance Sheet is funded in majority by Deposits (47.9%),
short term debt (15.5%) and long term debt (16.9%).
Santander held its ground during the height of the financial crisis in Spain. ROE suffered a big blow in 2012 mas managed to stay in positive territory. Tier 1 capital did not fall below the regulatory requirements.
As for the stock market performance, Santander rewarded its shareholders with an annualized return of 6.14% since the beginning of 2012 until the present date.
7 All of the cited figures are from the Santander, BBVA, CaixaBank and Sabadell’s annual filings from 2014.
0.0 1.0 2.0 3.0 4.0 5.0 6.0 7.0 8.0
12
/2
01
1
04
/2
01
2
08
/2
01
2
12
/2
01
2
04
/2
01
3
08
/2
01
3
12
/2
01
3
04
/2
01
4
08
/2
01
4
12
/2
01
4
04
/2
01
5
08
/2
01
5
Figure 45 - Santander's Stock Performance, EUR
BANKIA COMPANY REPORT
PAGE 17/31
BBVA
BBVA is a global institution present in 31 countries across all continents but Africa.
BBVA’s assets totalled EUR 631.9 bn in 2014, composed in its majority by its net
loan book (52.4%). It holds a 13.2% market share in loans in Spain . Its asset quality increased in 2014, materialized by a non-performing assets ratio of 5.8% compared with 6.8% for the year of 2013.
For the funding structure of the Balance Sheet, counts with deposits amounting to 46.5% of the assets and debt corresponding to 33.2%. The market share of deposits in Spain is 11.3%.
ROE has been showing an ascending trajectory since 2012 when it was 0.9%, in 2014 being 5.6%.
Regarding the performance of BBVA in the stock market, since 2012 to the current date, it yielded an annualized return of 9.61%.
CaixaBank
CaixaBank holds the last place in the podium of the biggest Spanish banks by market capitalization and assets. It has an international presence through the equity stakes held in certain international banking institutions. As of 2014 its net loans represented 55.7% of its EUR 338.6 bn balance sheet, which granted a market share of 15.1% in Spain, making CaixaBank the market leader in lending in the country. The exposure of the loan book to the Corporate & SME segment is 28.8% of the total loans. As for the NPL ratio, it is down to 9.7% in 2014 from 11.7% in 2013.
CaixaBank’s assets are funded mostly by deposits (52.5%), a segment where it is also market leader in Spain, with a share of 14.4% in 2014. Debt makes up for 13.2% of total assets.
As for profitability, CaixaBank saw its ROE of 2012 barely cross the 0% line at 1%, although in 2014 the ratio improved to 2.7%. The bank was cleared in the EBA’s
stress testing exercise of 2014.
CaixaBank share offered an annualized return in the period of 2012 to year to date of 3.36%.
Sabadell
Sabadell is also a major player in the Spanish banking landscape. It is internationally focused, counting with branch networks and equity investments key markets. Out of its EUR 163.3 bn of assets, 67.5% are net loans. The NPL ratio in
0.0 2.0 4.0 6.0 8.0 10.0 12.0 12 /2 01 1 04 /2 01 2 08 /2 01 2 12 /2 01 2 04 /2 01 3 08 /20 13 12 /2 01 3 04 /2 01 4 08 /2 01 4 12 /20 14 04 /2 01 5 08 /2 01 5
Figure 46 - BBVA's Stock Performance, EUR Source: Bloomberg 0.0 0.5 1.0 1.5 2.0 2.5 3.0 12 /2 01 1 04 /2 01 2 08 /2 01 2 12 /2 01 2 04 /2 01 3 08 /20 13 12 /2 01 3 04 /2 01 4 08 /2 01 4 12 /2 01 4 04 /2 01 5 08 /2 01 5
Figure 48 - Sabadell's Stock Performance, EUR Source: Bloomberg 0.0 0.5 1.0 1.5 2.0 2.5 3.0 3.5 4.0 4.5 5.0 12 /20 11 04 /2 01 2 08 /2 01 2 12 /2 01 2 04 /2 01 3 08 /2 01 3 12 /2 01 3 04 /20 14 08 /2 01 4 12 /2 01 4 04 /2 01 5 08 /2 01 5
Figure 47 - Caixabank's Stock Performance, EUR
BANKIA COMPANY REPORT
PAGE 18/31
2014 stood at 12.2%, a decrease from 13.6% on the previous year. The assets are funded 59.3% by deposits, while debt amounts to 29.9%. From 2013 to 2014 the composition of the deposits changed, with current accounts weighting more than before, and the share of term deposits falling, signalling a cheaper funding structure. That could help explain the fall in interest expense by 26% in this period, and consequent increase of 24.5% in Net Interest Income.
Profitability wise, ROE is up to 3.7% in 2014, from 1.58% in the previous year. In 2014, the Core Tier 1 capital ratio was 11.7%.
Sabadell’s performance in the stock market since 2012 was not what shareholders hoped it to be, posting an annualized return of -3.35%.
Valuation
For the valuation of Bankia, a discounted cash flow to equity model was employed, where the horizon period spans 10 years. For the continuing value, a perpetuity with growth rate was used. It was assumed that Bankia was able to increase or reduce its Equity so as to comply with the regulatory ratios (estimated total capital raising needs of EUR 1.8 bn for the horizon period).
Income
Loan Portfolio
The Loan Portfolio was responsible for over a half of the interest income received by Bankia in 2013 and 2014. It is expected that, with the targeting of Corporate & SME clients that contribute with higher interest rates and with the forecasted low level of sovereign yields, the Loan Portfolio will continue to secure its position as the main source of income of Bankia.
Average interest rates on outstanding loans are expected to start increasing in 3-4 years, as the picking up of credit concession activity is expected to help higher rates on new loans drive the aggregate rates of new and existing loans up. It is forecasted that interest rates will gradually work their way up to the levels before the crisis struck. Bankia’s NPL ratios are forecasted to converge to Spain’s
average values for the whole credit market as a result of the balance sheet cleansing activities taken part as per the influence of the Restructuring Plan. The loan market in Spain is forecasted to start its recovery in the coming 3-4 years (as recent data from the Bank of Spain still shows decreasing values for the outstanding volumes of loans), helped by the positive outlook for the Spanish economy. Bankia, is expected to comply with its Restructuring Plan, meaning the market shares for the Corporate & SME segment are forecasted to increase at a
Source: Bank of Spain, Analyst’s
estimates
Source: Company Data, Analyst’s
estimates 0 500 1000 1500 2000 20 00 20 02 20 04 20 06 20 08 20 10 20 12 20 14 20 16 20 18 20 20 20 22 20 24
Figure 49 - Spanish Loans Market, EUR bn
Loans H Loans E
20% 30% 40% 50% 60% 70% 20 11 20 12 20 13 20 14 20 15 20 16 20 17 20 18 20 19 20 20 20 21 20 22 20 23 20 24 20 25
Figure 50 - Bankia's Loan Portfolio composition
Mortgages H
Mortgages E
Corporate & SME H
Corporate & SME E
Source: Company Data, Analyst’s
estimates 0% 20% 40% 60% 80%
Figure 52 - Bankia's NPL and NPL Coverage ratios
Total NPL Ratio H Total NPL Ratio E Total NPL Coverage Ratio H Total NPL Coverage Ratio E
1.5% 2.0% 2.5% 3.0% 3.5% 20 13 20 14 20 15 20 16 20 17 20 18 20 19 20 20 20 21 20 22 20 23 20 24 20 25
Figure 51 - Bankia's average interest rate of Loan Portfolio
Average Interest Rate Loan Portfolio H
Average Interest Rate Loan Portfolio E
Source: Company Data, Analyst’s
BANKIA COMPANY REPORT
PAGE 19/31
slow, steady pace, as the task already proved was already proved difficult in the previous years. The difference from the past situation is that Bankia faced a much more depressed Corporate & SME market, whereas now it is expected to encounter a market starting to give signs of a sustained recuperation.
That way, the bank’s exposure to the Corporate & SME segment is forecasted to increase as a share of the total portfolio.
Bond Portfolio
The Bond Portfolio holds the second place in the podium of income generating activities for Bankia. Overall interest income for the Bond Portfolio is expected to decline in the upcoming 3-4 years as a consequence of the low yield environment which results in high reinvestment risk, picking up after that, contingent to a forecasted longer run growth on yields. It is assumed that the ALCO Portfolio will maintain its risk profile, being constituted mainly by Spanish sovereign bonds. On a specific note, the last ESM bond held by Bankia matures at the end of 2015, and the last interest payment is forecasted to be negligible, as it is indexed to Euribor 6M that currently is on negative ground.
Sareb bonds are also expected to suffer a blow in their contribution to interest generation. The 3 year Sareb bond matures at the end of 2015, and is expected to
be renegotiated on similar terms as the other tranches’ re-negotiations were held, that is, the spread over the Euribor 3M is forecasted to significantly fall, causing expected lost revenue of EUR 64 mm per year. As past observations on the other tranches tell, the first re-negotiation of the spreads is the toughest one for Bankia. As such, after this update on the spreads of the 3 year bond, spreads then on out are considered to be relatively stable.
As part of the company’s disclosures for the interest income, there is a line of
hedging transactions that moves in the opposite direction of interest income. It was assumed that these hedging transactions were related to the Bond Portfolio and that the interest yielded from these assets are net of these hedging results.
Net Fees
Fees are assumed to be connected to the business level of a given bank. In the case of Bankia, for fee income the business level was estimated through the total amount of gross loans and gross customer deposits, the assets and liabilities that were considered to be fee earning. The fee income was calculated as having the same growth rate as the said balance sheet items.
As for the fee expense, the same rationale was followed. The balance sheet items used as a proxy for the payment of fees were the financial assets held for trading.
Source: Analyst’s estimates
*Net of derivative transactions
Source: Company Data, Analyst’s
estimates 500 600 700 800 900 1,000 1,100 1,200
Figure 53 - Bankia's Bond Portfolio Income*, EUR mm
700 800 900 1,000 1,100 1,200
20
11
20
12
20
13
20
14
20
15
20
16
20
17
20
18
20
19
20
20
20
21
20
22
20
23
20
24
20
25
Figure 55 - Bankia's net fees, EUR mm
Net Fees H Net Fees E 0.0
20.0 40.0 60.0
Figure 54 - Bankia's Bond Portfolio composition, EUR bn
Non ALCO Bonds & Other E
ALCO Bonds E
Sareb Bonds E
BANKIA COMPANY REPORT
PAGE 20/31
Disposal of Assets
Bankia is following a policy of disinvestment on non-core assets, recognised under
“Non-Current Assets Held for Sale”. A specific case is the City National Bank of Florida sold on October 2015 that yielded a net gain of about EUR 117 mm. Other disposable groups were considered to yield the same premium over their net value. The estimated book equity value for these groups is EUR 661.4 mm, suggesting that the room for potential losses or gains is not very relevant in broad valuation terms. As for the case of foreclosed assets that are still being in the process of sale, a small net loss was considered.
These transactions do not pose a significant impact on Bankia’s valuation, since
the balance sheet cleansing is already running from 3 years now, meaning that the greatest part of the most problematic assets were already laid off and their losses accounted for.
Expenses
Deposits
Deposits represent the majority of the interest expense of Bankia. Customer Deposits made up for 63.85% of the whole of the deposits in 2014, and cost an average interest rate of 1.12%. This level of interest rate is not expected to subsist in the long term, mainly due to the importance for Bankia in capturing Savings Accounts and Fixed Term Deposits (they amounted for EUR 82.1 bn in funding in 2014, corresponding to 35% of the Asset value). Bankia’s dependence on these
funds is expected to play a role against the low interest rate environment and so a
conservative increase in these deposits’ segments interest rates is expected, which in turn would lever up the average interest rate of the customer deposits, forecasted to start increasing in the next couple of years.
It is considered that the level of the Deposits in the Spanish economy continues to follow its trend since the beginning of the century. Term Deposits, the class that was most affected on the wake of the financial crisis is expected to slowly regain its attractiveness to customers, as the confidence in a bailed out financial system is re-obtained.
Deposits from Central Banks are expected to decrease in the coming years, as Bankia returned to the unsecured debt capital markets in 2014, a step forward on
the bank’s independence from central bank emergency funding.
Bankia’s market shares on deposits are not expected to change significantly from
the values observed in the past years
Source: Analyst’s estimates
Source: Company Data, Analyst’s
estimates 0 20 40 60 80
2011 2013 2015 2017 2019 2021 2023 2025 Figure 57 - Bankia's Customer Deposits,
EUR bn
Current Accounts H Savings Accounts H Fixed Term Deposits H Current Accounts E Savings Accounts E FIxed Term Deposits E
50 60 70 80 90 100 110 20 11 20 12 20 13 20 14 20 15 20 16 20 17 20 18 20 19 20 20 20 21 20 22 20 23 20 24 20 25
Figure 59 - Bankia's Mortgage loans, EUR bn
Mortgages H Mortgages E Source: Company Data, Analyst’s
estimates 0.0% 1.0% 2.0% 20 13 20 14 20 15 20 16 20 17 20 18 20 19 20 20 20 21 20 22 20 23 20 24 20 25
Figure 58 - Bankia's average Customer Deposits' interest rate
Average Customer Deposits' Interest Rate H Average Customer Deposits' Interest Rate E
Source: Company Data, Analyst’s
estimates 0% 20% 40% 60% 80% 100%
Figure 56 - Bankia's Expense composition
BANKIA COMPANY REPORT
PAGE 21/31
Debt
Bankia currently holds debt funding in the form of senior unsecured bonds, subordinated bonds and mortgage covered bonds.
It is prospected that Bankia is able to cover any funding needs in the future with new issues of senior unsecured bonds or mortgage covered bonds, securities that
compose the “Marketable Debt Securities” line in the company’s disclosures.
Bankia had successful placements of this type of debt in 2014 and 2015. Although
the bank’s plan is to focus on business lending, Bankia is expected to hold a stable level of mortgage loans, which are expected to perform better (lower NPL ratios),
as the Spanish economy is expected to continue its recovery, what levers Bankia’s
ability to issue mortgage covered bonds.
According to the company’s disclosures, a significant amount of the interest
expense is compensated by hedging instruments, being this value in 2013 96.85% of the interest expense with debt securities, and in 2014 it actually was higher than the interest expense by 1.24%. As such, the interest rate assumed for the interest expense related to these securities is considered to be net of the hedging activities. As such, as a basis for the forecasted interest rate, it was assumed that these hedging income was related to these debt securities and that the interest expense would be net of such income. A spread over Euribor 6M (the index rate of the ICO bonds that Bankia issued) was used to calculate the rate.
The steep drop in the historical period versus the forecasted recovery is explained by the substitution of Central Bank deposits as a source of funds by this type of debt securities.
Administrative Expense
Administrative Expenses covers staff costs and other general supporting activities’
related costs (as IT, office supplies and advertising). As for staff costs, Bankia in its Restructuring Plan agreed to personnel layoffs that were already accomplished in full by 2014 (which led to a decrease of 28.1% in employees and 27.1% in staff costs). As a consequence, staff costs are assumed to be constant here on out, only to be updated according to inflation. Other administrative costs are also considered to follow the same behaviour of staff costs, growing at the pace of inflation.
Depreciation and Amortization
The Restructuring Plan also envisages the scaling back of Bankia’s branch
network, with the goal set out being reached by year end 2014, representing a drop
Source: Company Data, Analyst’s
estimates
Source: Company Data, Analyst’s
estimates.
Source: Company Data, Analyst’s
estimates 0 10 20 30 40 50 20 11 20 12 20 13 20 14 20 15 20 16 20 17 20 18 20 19 20 20 20 21 20 22 20 23 20 24 20 25
Figure 60 - Bankia's Marletable Debt Securities, EUR bn
Marketable Debt Securities H
Marketable Debt Securities E
0 20 40 60 20 11 20 12 20 13 20 14 20 15 20 16 20 17 20 18 20 19 20 20 20 21 20 22 20 23 20 24 20 25
Figure 61 - Bankia's Deposits from Central Banks, EUR bn
Central Bank Deposits H
Central Bank Deposits E
Source: Company Data, Analyst’s
estimates. 600 700 800 900 1,000 1,100 1,200 1,300 1,400
2011 2013 2015 2017 2019 2021 2023 2025 Figure 62 - Bankia's Staff Costs, EUR mm
Staff Costs H Staff Costs E
0 50 100 150 200 250 300 0 500 1,000 1,500 2,000 2,500 Dep re ci ati on A sse ts
Figure 63 - Bankia's Tangible&Intagible Assets and Depreciation, EUR mm