Impact on shareholder wealth from emerging-market acquirers taking over
developed-market targets.
Madalena Coutinho
152118124
Dissertation written under the supervision of Prof. Dr. Pramuan Bunkanwanicha
(ESCP Business School).
Dissertation submitted in partial fulfilment of requirements for the International
MSc in Management with Major in Strategy and Consulting (Double Degree
Impact on shareholder wealth from emerging-market acquirers taking over developed-market targets.
Madalena Coutinho
Abstract
In the last two decades, emerging markets have gained ground in the global market of mergers and acquisitions and are expected to continue doing so. Although it is fairly common for developed-market firms to acquire developing-market targets, the other way around is still a relatively new phenomenon. As such, the stock markets behaviour towards announcements of such acquisitions is still an underdeveloped research area with ambiguous answers. The event study methodology was used to examine whether developing-market acquiring firms are able to create value for their shareholders when targeting developed-market firms and what are the drivers of value creation. The sample used consisted of 300 deals from acquirers of ten different developing countries from 2005 until the beginning of 2020. The results reveal that, on average, these transactions create value for the acquirer’s shareholders, and that hiring financial advisors contributes positively to value creation. The growth rate of the home country and being state-owned also contribute to value creation, but the firm size, belonging to the high-tech industry and paying all-cash, on the other hand, were found to have a statistically significant negative impact on the value created. Lastly, managerial implications were drawn as well as openings for future research.
Keywords: Emerging market multinationals; value creation; cross-border acquisitions; wealth effects
Resumo
Nas últimas duas décadas, os mercados emergentes têm vindo a ganhar terreno no mercado global de fusões e aquisições e prevê-se que continuem a fazê-lo. Embora seja bastante comum empresas de países desenvolvidos adquirirem empresas de países em desenvolvimento, o inverso é ainda um fenómeno relativamente recente. Como tal, o comportamento dos mercados financeiros após o anúncio destas aquisições é ainda uma área de investigação subdesenvolvida e com respostas ambíguas. A event study methodology foi utilizada para examinar se as empresas de países em desenvolvimento são capazes de criar valor para os seus acionistas quando compram empresas de países desenvolvidos, e que fatores influenciam essa criação de valor. Foi usada uma amostra de 300 transações de empresas compradoras de dez países em desenvolvimento, no período entre 2005 e o início de 2020. Os resultados revelam que, em média, estas transações criam valor para os acionistas do comprador e que a contratação de consultores financeiros contribui positivamente para a criação de valor. A taxa de crescimento do país de origem e o facto de ser estatal também contribuem positivamente, mas a dimensão da empresa, fazer parte do sector da alta tecnologia e o pagamento total em dinheiro, por outro lado, impactam negativamente a capacidade de criação de valor da transação. Por último, foram desenhadas implicações para a gestão, bem como sugestões de futura investigação.
Palavras-chave: multinacionais de mercados emergentes; criação de valor; aquisições internacionais; efeitos patrimoniais.
Table of Contents
1. Introduction ... 1
2. Literature Review and Hypothesis building ... 2
2.1. Value creation in cross-border acquisitions ... 2
2.2. Cross-border acquisitions performed by emerging market acquirer and a developed market target ... 3
2.3. Corporate Governance ... 5
2.4. Financial advisors ... 8
3. Methodology and dataset ... 10
3.1. Event study methodology ... 10
3.2. Cross-sectional analysis ... 11
3.3. Sample ... 12
3.4. Descriptive Statistics ... 13
4. Results and Analysis ... 14
4.1. Stock markets reaction to acquisitions ... 14
4.2. Drivers of stock market reactions ... 16
4.2.1 Control variables ... 16
4.2.2 Financial Advisors ... 18
4.2.3 Corporate Governance ... 19
5. Limitations and Future Research ... 21
6. Managerial implications ... 22
7. Conclusion ... 23
1
1. Introduction
Cross-border acquisitions arise naturally in emerging countries following their home country’s growth and incorporation into the global economy. Companies seek an outward strategic expansion through cross-border acquisitions as competition increases in their home countries, from both their local competitors and from foreign internationals that have entered their domestic market. The number of acquisition and cross-border acquisition deals has grown overall in the last two decades, especially marked by the 1990s exponential growth, during the so-called fifth merger wave. Ayabr and Ficici (2009) called emerging market companies who expand internationally, EMMs (emerging-market multinationals). According to McKinsey’s study in 2015, there are three main motives for EMMs to pursue cross-border deals (ordered by popularity): To acquire strategic resources (i.e. know-how, brands, or technology); to gain access to natural resources; and to penetrate new markets or sustain the existing ones. However, as emerging markets mature, EMMs have moved their internationalization strategy from acquiring strategic resources to tapping new markets. In short, emerging markets have become global centres of FDI, attracting foreign investment through cross-border mergers and acquisitions, and they have become global players themselves using M&A as the strategy for their aggressive expansion.
The market reactions, and thus, value creation or destruction arising from cross-border acquisitions is a fairly mature research topic. However, it is mostly focused on deals involving US or other developed countries enterprises. The rise in the number of cross-border M&As involving developing-country firms is a relatively new phenomenon, both as acquirers and as targets. Therefore, the academic research on value creation for the acquirers is still quite limited.
There are many determining factors in cross-border acquisitions from developing-country firms that differ considerably from those of developed-country firms. Malhotra and Zhu (2008) say that “compared with firms from developed-market, developing-country firms tend to be younger and smaller; they lack international experience and exposure; their domestic capital market is less developed and investors are not as sophisticated; their government regulation, corporate governance and cultural background are more distant from the developed target country”. Bruner, Conroy, Estrada, Kritzman and Li (2002) also point out that “emerging markets differ from developed ones in areas such as accounting, transparency, liquidity, corruption, volatility, governance, taxes and transaction costs and these differences are quite likely to affect firm valuation”. This list of differences may cause acquisitions from
emerging-2
market firms to be riskier and more challenging than those from develop-market acquirers. Financial markets reflect this disparity and the reactions of the acquisition announcements may be different according to the origin of the acquirer. Hence, the way emerging-market firms’ market value changes after acquisitions becomes a relevant topic for research.
A relatively new phenomenon can be observed where emerging-market firms acquire market ones. As Malhotra and Zhu (2008) point out, it is often seen developed-economy firms acquiring developing-developed-economy firms, and it is rarely the other way around. Narayan and Thenmozhi (2014) claim that “successful emerging market firms, armed with stronger balance sheets, internal accruals, better borrowing capacity and a desire to obtain a global footprint will continue to engage in acquisition of targets from developed markets”. Thus, this new phenomenon is not a temporary one and is an increasingly relevant research topic.
This paper examines the market reactions for emerging market acquirers who target developed-market firms. It will examine how different firm and deal characteristics affect the value creation of the transaction. Special attention will be given to the impact of the use of financial advisors and of corporate governance practices on value creation.
2. Literature Review and Hypothesis building
2.1. Value creation in cross-border acquisitions
The extant literature on value creation from cross-border acquisitions is not consensual. Some claim positive returns for the acquirer and others allege negative returns, both from developed-market and emerging-market acquirers. Some studies that conclude positive returns for the acquirer in a developed market are: Martynova and Renneboog (2008), which shows a correlation between the corporate governance standards of the acquirer and the target and the returns from the cross-border acquisitions; Cakici, Hessel and Tandon (1996) shows significant positive returns for the bidder firms in developed countries (sample of firms from Japan, UK, Australia and The Netherlands) acquiring US companies, but found no gains for the US firms acquiring foreign firms, and no consistent correlations between hypothesized independent variables and the acquirer’s return; Chari, Ouimet and Tesar (2004) studied acquisitions with developed-country acquirers and emerging-country targets from 1998 to 2002 and found positive market reactions for both the acquirer and the target; Benou, Gleason and Madura
3
(2007) used a sample of high tech companies and found positive but insignificant returns for the acquirer but positive and significant returns for the target firms, with higher abnormal returns for both when a top-tier financial advisor is contracted and when there is high media attention; Francis, Hassan and Sun (2008) also found positive average returns in a sample of US acquiring firms, although domestic acquisitions had higher returns than cross-border ones. Nonetheless, several articles claim to have found negative average returns for acquirers, to name a few: Kuipers, Miller and Patel (2009) analyzed a sample of acquisitions from developed-country firms acquiring US firms and found the returns to be negative, partly due to the level of creditor rights in the acquirer’s country; Bris and Cabolis (2008) and Wang and Xie (2008) claim that there is a relationship between corporate governance and shareholder protection of the firms and the deal premia, and although “improvements in accountability and transparency are positively valued by the market”, the average returns are negative in both. Moeller and Schlingemann (2005) concluded US firms who acquire cross-border targets get a lower stock return and experience a lower increase in operating performance than those who acquire domestic targets.
The same picture can be observed in the literature of emerging-market firms’ acquisitions. Bhagat, Malhotra and Zhu (2010) discovered positive average returns, and that these returns are positively related to corporate governance measures in the target country. Boateng, Qian and Tianle (2008) concluded that “cross-border mergers and acquisitions by Chinese firms experience significant and positive wealth gains for shareholders of the acquiring firms”. Malhotra and Zhu (2008) found that Indian firms’ value after acquiring US firms increases for the three following days, and after that, it decreases gradually until the returns become significantly negative. Aybar and Ficici (2009) state that cross-border acquisitions, on average, lead to value destruction for emerging-market firms, after analyzing a sample of deals from firms mainly from Latin America and Asia. Chen and Young (2009) considered a sample of cross-border deals from Chinese companies and obtained average negative returns, which could be caused by the fact that the Chinese government is the biggest shareholder in most of the completed deals, and that could lead investors to find the cross-border deal less favourable.
2.2. Cross-border acquisitions performed by emerging market acquirer and a developed market target
As mentioned above, this wave of transactions is relatively recent, and thus, there is still limited research on them. Narayan and Thenmozhi (2014) concluded that such deals lead to
4
value destruction in more than half the cases. Although not focused solely on the topic, Chernykh, Liebenberg and Macias (2011) concluded that “emerging market acquirers experience positive announcement returns when the target is from a developed market”, while acquisitions with both emerging market acquirers and targets have insignificant abnormal returns. Rani, Yadav and Jain (2015) found that for Indian acquiring firms, the returns are on average positive and significant when engaging in cross-border transactions and they are higher when targets are from developed economies.
Acquisitions are a relevant and notable form of FDI (foreign direct investment) and, theoretically, companies undertake FDI when they hold some firm-specific advantages that allow them to have a competitive position in their domestic market as well as to be profitable in foreign markets, offsetting the additional costs of operating abroad (Zaheer, 1995). Kuo, Ning, Strange and Wang (2014) mention that acquisitions bring risk diversification and earnings stabilization, as the market returns in different geographical areas are usually not highly correlated, and capabilities enhancement, since it is expected to happen some sort of knowledge transfer between the acquirer and the target. It follows that it is expected for firms to undertake FDI when there are projections of future synergetic benefits. Assuming markets are efficient - meaning the prices reflect all available information - the value of the acquiring firm should go up with an acquisition, reflecting the firm’s ability to profit in the new entered market, the risk diversification, earnings stabilization, knowledge transfer and the future synergetic benefits.
However, there are some obstacles for the value creation that could explain why some negative results were observed. Some factors that might affect value creation by emerging-market firms that are pointed out by Narayan and Thenmozhi (2014) are: developing-country firms still have little experience in cross-border acquisitions, which can lead to a lower efficacy in valuing and choosing targets; they usually finance such deals with debt rather than with internal retained income, inducing greater pressure on future success and cash flows; and lastly, they have smaller negotiation power in international acquisition deals, which, most often, results in emerging-market acquirers ending up paying a higher premium than a developed-market acquirer would. In addition to this, Seth, Pettit and Song (2002) identified three main underlying motives for the pursuit of acquisitions: synergy seeking, managerialism and hubris. In managerial or hubris-based acquisitions, transactions are realized in the pursuit of managers’ personal interest, or they involve managers’ mistakes on the target valuation. They found that
5
the motive for the transaction plays a big role in value creation, such that deals that destroyed value were originated from managerialism or hubris-based M&As, as opposed to synergetic-oriented.
All the factors mentioned above lead to a sense of scepticism from investors, which is reflected in the market’s reaction to acquisitions. However, it seems fair to believe the gains that come from acquiring developed-market targets – which come from the penetration of a new market, the acquisition of strategic assets, the risk diversification, earnings stabilization, capabilities enhancement and from the future synergetic benefits - outweigh the losses. This is especially plausible to assume considering developed-market firms are generally more mature, which is associated with higher transfer of capabilities (namely knowledge), earnings stabilization and of risk diversification. Hence, overall, there should be value creation for the acquirer. On this ground, the first hypothesis is drawn:
H1: There is value creation for the emerging-market firm when acquiring a developed-market target.
This main hypothesis will be studied together with the drivers for value creation. There is evidence that leads to believe corporate governance practices and the hiring of financial advisors play a role in shareholder wealth creation in acquisitions of developed-market firms by EMMs. Thus, the impact of these two variables will be examined.
2.3. Corporate Governance
Corporate governance is a relatively new concept that gained force as a managerial discipline after the last financial crisis and scandals of firms’ moral conduct. A definition of corporate governance can be found in the “Cadbury Code”, and it states that “corporate governance is the system by which companies are directed and controlled” (Cadbury, 1992).
Although corporate governance is not as developed in emerging markets, they are naturally responding to this global trend and have a growing pressure from activist shareholders. McKinsey’s report Perspectives on Corporate Finance and Strategy from 2002 has a chapter on Corporate governance develops in emerging markets where it is indicated that both domestic and foreign investors in emerging markets value corporate governance and reward firms with stricter standards. Investors claimed they were willing to pay a premium for a well-governed
6
firm, and in some countries, that premium was as high as 30%. Also, 76% of investors of Asian firms say they care about board practices at least as much as they do about financial issues.
Corporate governance can affect the firm’s valuation. Several studies have shown a positive correlation between good corporate governance practices and higher firm valuation, for both developed and developing-market firms. To name a few: Beiner, Drobetz, Schmid and Zimmermann (2006) found a positive relationship between corporate governance and firm valuation for Swiss firms; and Drobetz, Schillhofer and Zimmermann (2003) found that for German companies, “investors are willing to pay significant premiums for well-governed companies, and that the valuation of a firm is at least as dependent on governance practices as it is on financial issues”. And for emerging-market firms, the following studies are relevant: Black, Jang and Kim (2006) claim that corporate governance positively affects the valuation of Korean firms, and that this effect is likely to be causal; Claessens and Yurtoglu (2012) state that “better corporate frameworks benefit firms through greater access to financing, lower cost of capital, better performance and more favourable treatment of all stakeholders” in emerging markets; Black, Carvalho and Gorga (2011) found that there is a positive and statistically significant effect of corporate governance on market value, in a sample of Brazilian, Indian, Korean and Russian firms; Cheung, Connelly, Limpaphayom and Zhou (2006) and Lei and Song (2008) reached the same conclusion for Hong Kong firms, Bebczuk (2005) for Argentinian firms; Black, Love and Rachinsky (2006) for Russian; Balasubramaniam, Black and Khanna (2010) for a Indian; and Klapper and Love (2004) for a sample of firms across 25 emerging markets.
Corporate Governance can be measured in a myriad of ways. Nonetheless, board composition is a central issue that receives much attention. When it comes to the board composition, there are two main good practices, which are part of the second principle of ICGN (International Corporate Governance Network) global governance principles:
● Separation of CEO and Chair – There should be a clear distinction of the role of the CEO and of the chairman, as the chair of the board should be an independent non-executive director.
● Independence in the board – Independent directors are non-executive directors that do not represent any stakeholder. ICGN states that the board should be composed of a majority of independent non-executive directors (>50%) but established the minimum acceptable of one-third independent directors (>33%).
7
Several studies have focused on the impact that the separation of the two roles has on firm performance. Some found that firms that separate the responsibilities outperform those with CEO duality (Rechner and Dalton, 1991; Pi and Timme, 1993), while others found the opposite effect (Brickley, Coles and Jarrel, 1997; Donadson and Davids, 1991), and others even found no link between the two variables (Dalton, Daily, Ellstrand, and Johnson’s, 1998; Daily, 1995). The board’s independence is likely to be the most important corporate governance factor, and although there are still contradictions in the literature, most evidence shows that having more independent members in the board lead to better performance and higher valuations. Black et al. (2006) claim that for Korean firms, the ones who have at least 50% outside directors have around 40% higher share prices. Dahya, Dimitrov and McConnell (2008) studied a sample of 22 countries, 7 of which were emerging markets, and found a positive relationship between higher percentage of independent members in the board and firms’ valuation, especially for firms in countries with weak legal protection for minority shareholders. Black and Kim (2007) also found a positive impact on cumulative markets abnormal returns and on Tobin’s q (firm’s market value/firm’s total assets) for Korean firms. On the other hand, Lo, Wong and Firth (2010) studied a sample of Chinese firms and observed a significant negative effect of independence in the board and firms’ gross profit ratio in related party transactions.
Despite the contradicting literature on the CEO duality and board independence’s impact, it is fair to deduce that if corporate governance is beneficial to a firm’s performance and valuation, these two standard principles of good corporate governance will contribute positively to both performance and valuation. Additionally, it seems logical that factors that influence a firm’s better performance and valuation would also influence the firm’s stock return after acquisitions. Thus, better corporate governance (i.e. complying with the two principles above) of the acquirer should lead to a higher value captured in cross-border expansions.
Supporting this hypothesis, Bris and Cabolis (2008) claim better corporate governance practices - which they tested with shareholders’ protection and national accounting standards - lead to higher abnormal returns. Byrd and Hickman (1992) studied in specific the effect of the fraction of outside directors of the acquirer on the stock market’s reaction to tender offers and observed that higher independence ratios lead to higher returns. Also, the two corporate governance practices stated above are both internal and do not include nationwide standards, in which emerging markets are still not as developed. However, Klapper and Love (2004) found that firms operating in a poor corporate governance environment will get higher benefits when
8
engaging internally in good corporate governance practices than they would if they were in a rich corporate governance environment, meaning the advantages of internal good corporate governance practices are augmented in developing markets. Hence, corporate governance is a relevant factor to analyse.
To add on this logic, as earlier mentioned, Seth, Pettit and Song (2002) found that the underlying managerial motivation is a determining factor in the success of the acquisition. If good corporate governance measures are in place, it is much less likely for the managers to pursue their personal interests, since there is better supervision by the board. In short, with better corporate governance comes more synergy seeking acquisitions and, thus, more successful ones.
The central hypothesis states that good corporate governance practices lead to higher returns for the acquirer. It is divided into two more specific hypotheses, that follow:
H2 a): The separation of the CEO and chairman roles positively affects the returns for the emerging-market firm when acquiring a developed-market target.
H2 b): Having a high percentage of independent directors in the board positively affects the returns for the emerging-market firm when acquiring a developed-market target.
2.4. Financial advisors
The acquirer can hire a financial advisor, who is a firm advising about the financial requirements for the deal to be completed. Financial advisors are usually known as investment banks, and they can be helpful in several points, as they are said to be capable of lowering the contracting costs, performing better due diligence and taking care of financial and legal issues (Angwin, 2001; Boeh, 2011), as well as reducing the transaction cost and information asymmetry (Servaes and Zenner, 1996).They can also be an asset in advising on which firms to target and which financing structure to follow, in sharing their knowledge of financial markets and mitigating cultural differences.
Golubov, Petmezas and Travlos (2012) examined the role of financial advisors on M&As and figured firms are more inclined to hire financial advisors when they are not confident about being able to successfully complete the deal on their own, which usually happens in three cases: when the transaction is big; when they do not have much experience and expertise in “in-house” transactions and when transactions are less likely to be diversifying. To be more precise,
9
Golubov et al. (2012) found that in-house acquisitions had a median relative size of 0.059, while the median for acquisitions using financial advisors was 0.222, supporting the idea that firms are less confident to make decisions themselves when the targets are sizable. For the second case, the authors observed that as firms gain more experience in M&As they become less likely to call for advisors, and it is common to form a dedicated internal M&A team with the necessary capabilities. Because emerging-market firms are relatively new players, the chances of firms having previously acquired experience and expertise in M&A transactions should be smaller than for developed-market ones. Thirdly, if firms are more inclined to hire an advisor when the deal is more diversifying, then cross-border acquisitions should be more likely to have the aid of financial advisors compared to domestic acquisitions.
Academics have elaborated on the relationship between the employment of financial advisors and acquisitions returns. Most literature is dedicated to finding the impact of different advisors’ characteristics on the abnormal returns, and a characteristic to which plenty of attention has been given is the advisor’s reputation. Bao and Edmans (2011) and Kale, Kini and Ryan Jr (2003) say that there is a connection between the advisor perceived quality and M&A returns. Golubov et al. (2012) agree, stating that top-tier advisors achieve higher returns for the acquirer than non-top-tier ones. On the other hand, Ismail (2009) and Hunter and Jagtiani (2003) find a negative effect of advisor reputation on acquirer’s returns. Several other authors found no evidence of the role of the advisor’s reputation on the M&A returns (Schiereck, Sigl-Grüb and Unverhau, 2009; Walter, Yawson and Yeung, 2008). Another popular topic of research is the effect of hiring “boutique” (smaller and specialized) investment banks (Song, Wei and Zhou, 2013), which were observed in their article to be beneficial.
In this paper, there will not be a classification according to advisors’ reputation. Instead, it is the impact of hiring any financial advisor, against performing the acquisition without hiring any, that will be studied. This relevant since financial advisors usually request enormous fees and it is, thus, interesting to understand if the value they bring offsets the high costs associated with them.
According to Golubov et al. (2012), financial advisors participate in around 85% of mergers and acquisitions, which means the majority of companies believe the high costs of hiring those advisors are offset by the benefits they bring. Due to this and to the long history and presence of investment banks and other financial advisors, it seems fair to assume financial advisors do bring value and, hence, higher abnormal returns for acquirers. Allied to this logic,
10
is the fact that emerging markets do not have a vast knowledge about most developed markets, which increases the need for external expertise. The hypothesis is then formulated as follows:
H3: Hiring financial advisors lead to higher abnormal returns for the emerging-market firm acquiring a developed-market target.
3. Methodology and dataset
3.1. Event study methodology
The event study methodology is applied in most of the studies in the area (Aybar and Ficici, 2009, Bhagat et al., 2010, Boateng et al., 2008, Chari et al., 2004, Chernykh et al., 2011) to measure the impact of an acquisition on the acquirer stock returns. Chari et al. (2004) claim that this method gives the most reliable evidence on M&A value creation. The model estimates value creation or destruction using cumulative abnormal stock market reactions. The first step to get the cumulative abnormal returns (CAR) is to find the abnormal returns, which are the differences between the expected return (i.e. the return if there was no acquisition) and the observed return. For that, the market model was applied. This model assumes the return of the market and a given stock are linearly related, and that the stock markets are efficient. Thus, with this model, it is possible to calculate the expected returns. For each firm i, the market model follows:
𝑅𝑖𝑡 = 𝛼𝑖+ 𝛽𝑖𝑅𝑚𝑡+ 𝜀𝑖𝑡
Rit stands for the return of the security i at the moment t, the coefficients αi and 𝛽i stand for
the intercept and the systematic risk of each acquirer i, respectively, and εit is the error term for
security i at time t. To calculate coefficients αi and 𝛽i , a period of 90 days was used, from 120
days before the acquisition announcement (t = - 120) to 30 days before the announcement (t = - 30), considering the day of the announcement as the day zero. This time range was chosen as it is wide enough to reflect a pattern but short enough not to include many external factors. After having the expected return, it is possible to calculate the abnormal returns (ARit) generated
by each acquisition, using the following equation:
11
Where 𝛼̂𝑖 and 𝛽̂𝑖 are the ordinary least squares parameters. After having the AR, it is possible to calculate the CAR. The CAR is used because the real world behaves differently from theory and the stock prices do not adjust immediately, as the market model assumes. That is why it is necessary to observe and aggregate more trading days’ returns around the acquisition. In this study, three event windows are used: of three (-1, +1), five (-2, +2) and eleven days (-5, +5). The following equations were applied:
𝐶𝐴𝑅𝑖 = ∑ 𝐴𝑅𝑖𝑡
𝑇
𝑖=1
And for the event windows, where T1 and T2 are the first and last day of the window:
𝐶𝐴𝑅𝑖−𝐸𝑊 = ∑ 𝐴𝑅𝑖𝑡 𝑇1
𝑇=𝑇2
3.2. Cross-sectional analysis
The cumulative abnormal returns are now used as the dependent variable in a multivariate model to observe their behaviour and answer the core research question of whether there is value creation or destruction:
𝐶𝐴𝑅 (𝑇1, 𝑇2) = 𝛽0+ 𝛽1(𝑆𝑇𝐴𝑇𝐸) + 𝛽2(𝑆𝐼𝑍𝐸) + 𝛽3(𝐴𝐺𝐸) + 𝛽4(𝐹𝐼𝑁𝐴𝐷𝑉𝐼𝑆𝑂𝑅𝑆) + 𝛽5(𝐻𝐼𝐺𝐻𝑇𝐸𝐶𝐻) + 𝛽6(𝑇𝐿𝐼𝑆𝑇𝐸𝐷) + 𝛽7(𝐶𝐴𝑆𝐻) + 𝛽8(𝐼𝑁𝐷𝑈𝑆𝑇𝑅𝑌) + 𝛽9(𝐺𝑅𝑂𝑊𝑇𝐻) +
𝛽10(𝐵𝑂𝐴𝑅𝐷𝑆𝐼𝑍𝐸) + 𝛽11(𝐼𝑁𝐷𝐸𝑃𝐸𝑁𝐷𝐸𝑁𝑇) + 𝛽12(𝐷𝑈𝐴𝐿𝐼𝑇𝑌) + 𝜀
The model includes the hypothesized variables and some control variables that bring robustness to the model as well as provide material of study. The independent and control variables are the following:
● STATE – A dummy variable stating whether the acquirer is state-owned or not. ● SIZE –The value of the total assets in the end of the year prior to the acquisition
announcement was used as a proxy for the size of the acquirer. All values were converted into millions of dollars using the currency rate at the respective date. The natural logarithm was then applied in order to avoid skewness towards large numbers, since the value of assets can differ immensely from firm to firm.
12
● AGE – A variable of the age of the acquirer at the data of the acquisition.
● HIGHTECH – A dummy variable that takes the value of 1 when the acquirer belongs to the industry of high technology.
● INDUSTRY – A dummy variable that takes the value of 1 when the industries of the acquirer and the target are related.
● TLISTED – A dummy variable that is 1 when the target company was publicly listed at the moment it was acquired.
● CASH – A dummy variable stating if the acquisition was paid 100% in cash.
● GROWTH – This variable indicates the growth rate of the acquirer’s country in the year prior to the acquisition.
The variable concerning financial advisors:
● ADVISORS – A dummy variable that takes the value of 1 if the acquirer hired a financial advisor for the transaction and the value of zero otherwise.
And the variables related to corporate governance:
● BOARDSIZE – The total number of directors in the board. Because in some cases, mostly in companies from Israel and South Africa, there were boards of directors with a considerably larger size than the average observed, the natural logarithm was also applied.
● INDEPENDENT – A dummy variable taking the value of 1 when the percentage of independent members in the board of directors is higher than the median of the whole sample.
● DUALITY – A dummy variable that takes the value of 1 if the CEO and chair roles are exercised by the same person.
3.3. Sample
A list of acquisition announcements was extracted from Thomson SDC Platinum database, using the time range from January 2005 until January 2020. Along with the date of the announcement, the completion status of the deal, the acquirer’s name, the number of financial advisors hired by the acquirer, the percentage of consideration paid in cash, the industry description, and the public status and country of origin for both the target and the acquirer were extracted. The list of acquisitions was then filtered by several restrictions: the acquirer’s country
13
of origin had to be from a country considered by the UN country classification of 2019 as developing; the target’s country of origin had to be from a developed country according to the same classification; the announced deals considered had to have been completed; the acquirer had to be publicly listed, so it is ensured the historical stock prices are accessible; and lastly, each acquirer’s nation had to have a minimum of 15 deals in order to be considered, so to guarantee there is a representative sample for each country and less noise added to the model.
The rest of the data was extracted manually, mostly from the Thomson Reuters Eikon database and from companies’ annual reports. This includes the stock prices for the 90 days between 120 and 30 days before the announcement, as well as for the five days before and after the announcement date to cover for the three event windows used. For each acquirer firm, the following information was also taken: its age, whether it is state-owned or not, its total assets in dollars on the year before the announcement, the size of its board of directors, the number of independent members in the board and whether there is CEO duality also in the year prior to the acquisition. Lastly, the growth rate of all the developing countries in the list was extracted for the respective years.
After applying the restrictions, inevitably losing some deals due to data unavailability, and eliminating the outliers, the final sample size obtained was of 300, which is shortened to 236 when corporate governance variables are added. This happened because the annual report of the corresponding acquisition year was not available for some companies, and thus, corporate governance data could not be obtained. The final sample included deals from acquirers of ten developing countries: Brazil, China, Hong Kong, India, Israel, Malaysia, Russia, Singapore, South Africa, and South Korea. The country with the highest amount of deals is China with 68 transactions, followed by South Korea with 36. Close to 65% of the sample is from Asian countries, and all the BRIC countries are contemplated in the sample. The most targeted developed country is the US, with 65 acquisitions.
3.4. Descriptive Statistics
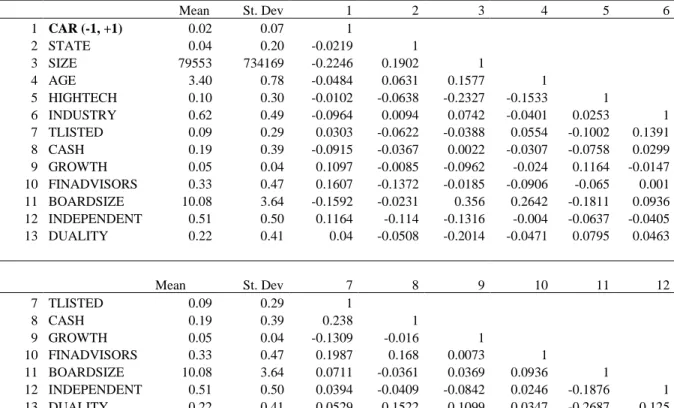
For a better understanding of the dataset gathered, table 1 presents the variables used, along with the mean, standard deviation and the correlation matrix. Due to the application of the natural logarithm in the variables of size and board size, their standard deviations come in smaller scales. Looking at the correlation matrix, it is possible to note that the highest value is 0.356, which is still far from alarming. Despite this, the Variable Inflation Factors (VIFs) were
14
calculated to ensure no multicollinearity related problems would emerge. The mean VIF is 1.15, the highest observed being 1.39. Hence, it is possible to discard the premise of serial autocorrelation.
Table 1. Descriptive statistics and correlation matrix.
Mean St. Dev 1 2 3 4 5 6 1 CAR (-1, +1) 0.02 0.07 1 2 STATE 0.04 0.20 -0.0219 1 3 SIZE 79553 734169 -0.2246 0.1902 1 4 AGE 3.40 0.78 -0.0484 0.0631 0.1577 1 5 HIGHTECH 0.10 0.30 -0.0102 -0.0638 -0.2327 -0.1533 1 6 INDUSTRY 0.62 0.49 -0.0964 0.0094 0.0742 -0.0401 0.0253 1 7 TLISTED 0.09 0.29 0.0303 -0.0622 -0.0388 0.0554 -0.1002 0.1391 8 CASH 0.19 0.39 -0.0915 -0.0367 0.0022 -0.0307 -0.0758 0.0299 9 GROWTH 0.05 0.04 0.1097 -0.0085 -0.0962 -0.024 0.1164 -0.0147 10 FINADVISORS 0.33 0.47 0.1607 -0.1372 -0.0185 -0.0906 -0.065 0.001 11 BOARDSIZE 10.08 3.64 -0.1592 -0.0231 0.356 0.2642 -0.1811 0.0936 12 INDEPENDENT 0.51 0.50 0.1164 -0.114 -0.1316 -0.004 -0.0637 -0.0405 13 DUALITY 0.22 0.41 0.04 -0.0508 -0.2014 -0.0471 0.0795 0.0463 Mean St. Dev 7 8 9 10 11 12 7 TLISTED 0.09 0.29 1 8 CASH 0.19 0.39 0.238 1 9 GROWTH 0.05 0.04 -0.1309 -0.016 1 10 FINADVISORS 0.33 0.47 0.1987 0.168 0.0073 1 11 BOARDSIZE 10.08 3.64 0.0711 -0.0361 0.0369 0.0936 1 12 INDEPENDENT 0.51 0.50 0.0394 -0.0409 -0.0842 0.0246 -0.1876 1 13 DUALITY 0.22 0.41 0.0529 0.1522 0.1099 0.0347 -0.2687 0.125 Note: Assets are in million US dollars
4. Results and Analysis
4.1. Stock markets reaction to acquisitions
To answer the first and main hypothesis, two tables were constructed, one showing the abnormal returns for each day starting 5 days before the announcement until 5 days after, and another describing the cumulative abnormal returns using the three event windows. Looking at table 2, it is possible to find positive abnormal returns from two days before the acquisition until one day after. Although statistically insignificant, the higher returns on t=-2 and t=-1 could be explained by possible information leaks before the announcement, to which the market reacts. It is on the day of the announcement and one day after where the highest returns are observed, leading to the deduction that the markets are fairly efficient and adjust rapidly to the news. The positive returns on the day of the announcement and the day immediately after are both statistically significant at a 1% level.
15
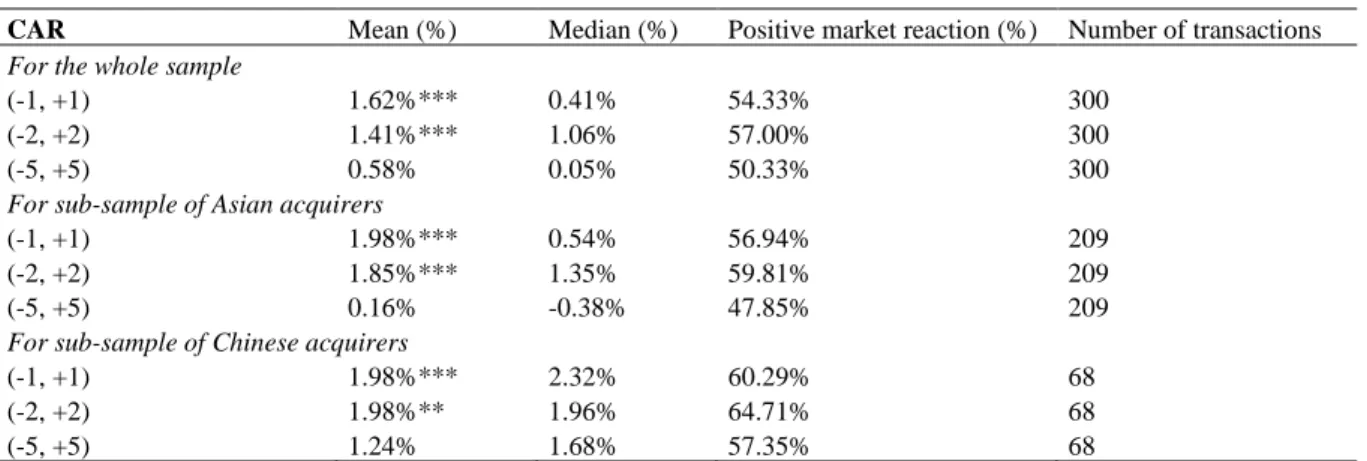
Table 3 shows the cumulative abnormal returns for the three event windows. Looking at the first panel, which considers the whole sample, it is easy to see that there is value creation, as the mean CARs are positive for the three event windows, and more than half the sample presents positive returns. For the first two event windows, the t-test demonstrates a statistical significance at a 1% level. Thus, the first hypothesis is verified.
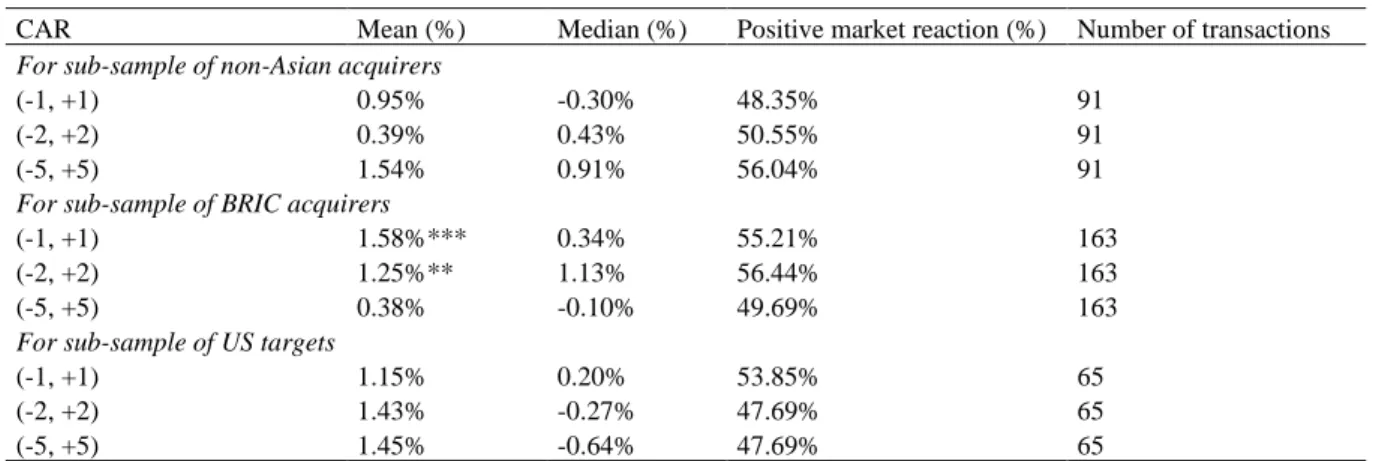
For a more in-depth understanding, a set of samples was designed. The list of sub-samples is the following: deals with Asian acquirers, with Non-Asian acquirers, with Chinese acquirers, with BRIC acquirers and with US targets. For all sub-samples, the CARs average is always positive. From the sub-samples, it is possible to extract that the means are slightly higher for Asian acquirers, and that the CARs for Chinese companies are statistically significant and positive, which complements Boateng et al. (2008) but opposes Chen and Young (2009) conclusions. The CARs for BRIC-country firms are statistically significant and the averages are very close to the ones of the whole sample. The other two sub-samples are statistically insignificant and, thus, no major conclusions can be drawn from them.
Table 2. Daily abnormal returns for five days before and after the announcement.
Day Mean(%) Median (%) Positive market reaction (%)
-5 0.22% -0.10% 47.33% -4 -0.36%*** -0.24% 41.00% -3 -0.43% -0.16% 46.67% -2 0.11% 0.16% 55.00% -1 0.23% 0.01% 50.00% 0 0.60%*** 0.06% 51.67% 1 0.79%*** 0.25% 51.67% 2 -0.32%* -0.28% 45.67% 3 -0.18% -0.11% 48.00% 4 -0.08% -0.15% 46.33% 5 -0.01% -0.18% 44.67%
Note: *, ** and *** correspond to 10%, 5% and 1% significance level, respectively.
Table 3. CARs for the three event windows.
CAR Mean (%) Median (%) Positive market reaction (%) Number of transactions For the whole sample
(-1, +1) 1.62%*** 0.41% 54.33% 300
(-2, +2) 1.41%*** 1.06% 57.00% 300
(-5, +5) 0.58% 0.05% 50.33% 300
For sub-sample of Asian acquirers
(-1, +1) 1.98%*** 0.54% 56.94% 209
(-2, +2) 1.85%*** 1.35% 59.81% 209
(-5, +5) 0.16% -0.38% 47.85% 209
For sub-sample of Chinese acquirers
(-1, +1) 1.98%*** 2.32% 60.29% 68
(-2, +2) 1.98%** 1.96% 64.71% 68
16
Table 3 continued. CARs for the three event windows.
CAR Mean (%) Median (%) Positive market reaction (%) Number of transactions For sub-sample of non-Asian acquirers
(-1, +1) 0.95% -0.30% 48.35% 91
(-2, +2) 0.39% 0.43% 50.55% 91
(-5, +5) 1.54% 0.91% 56.04% 91
For sub-sample of BRIC acquirers
(-1, +1) 1.58%*** 0.34% 55.21% 163
(-2, +2) 1.25%** 1.13% 56.44% 163
(-5, +5) 0.38% -0.10% 49.69% 163
For sub-sample of US targets
(-1, +1) 1.15% 0.20% 53.85% 65
(-2, +2) 1.43% -0.27% 47.69% 65
(-5, +5) 1.45% -0.64% 47.69% 65
Note: *, ** and *** correspond to 10%, 5% and 1% significance level, respectively.
4.2. Drivers of stock market reactions
4.2.1 Control variables
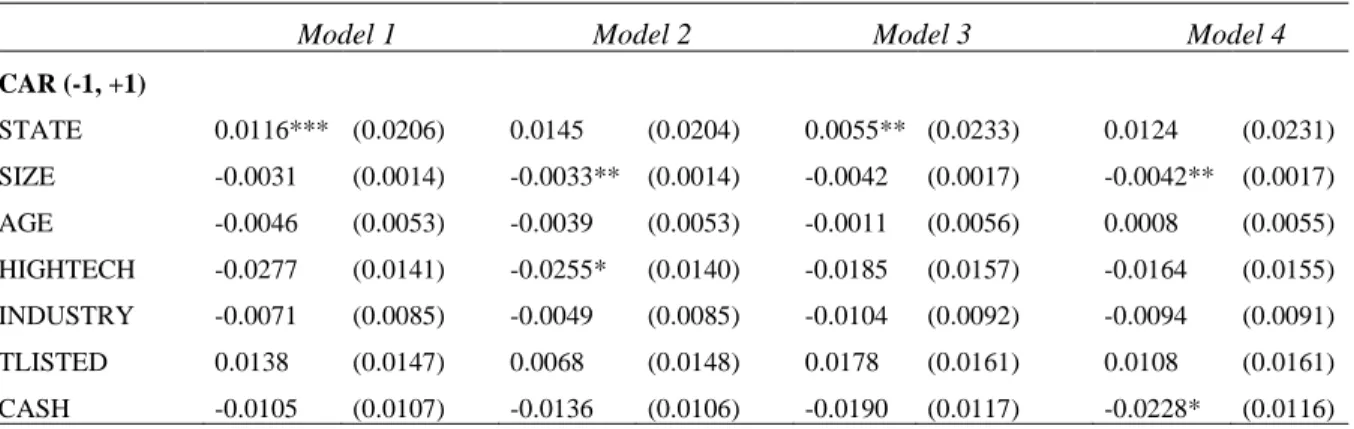
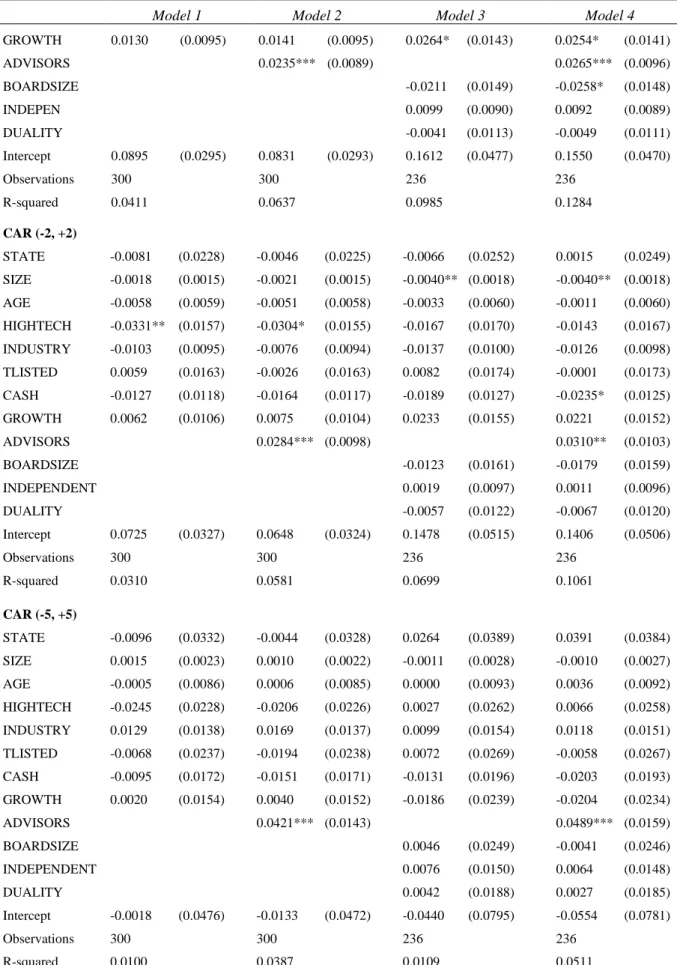
To analyse the role that the different characteristics of the company and of the deal play on the market reactions of acquisitions, the cross-sectional analysis was examined. For a more detailed interpretation of the coefficients, four models were constructed. Table 4 displays the four models. Model 1 only includes the control variables; model 2 adds financial advisors; model 3 adds the two corporate governance variables and excludes the financial advisors; and finally, model 4 includes the complete set of variables. Because of the mentioned unavailability of annual reports, the sample size is smaller for models 3 and 4, which include the corporate governance variables. For each model, the three event windows were used, summing up to 12 combinations. However, model 1 is statistically insignificant for the three windows; model 2 is significant at a 5% level for the first two event windows but insignificant for the 11-day window; model 3 is only significant for the 2-days event window (5% level); and lastly model 4 is significant at a 1% level in the first event window and at a 5% in the second, but insignificant in the largest window. Special attention was given to the results of model 4 since it is the most robust.
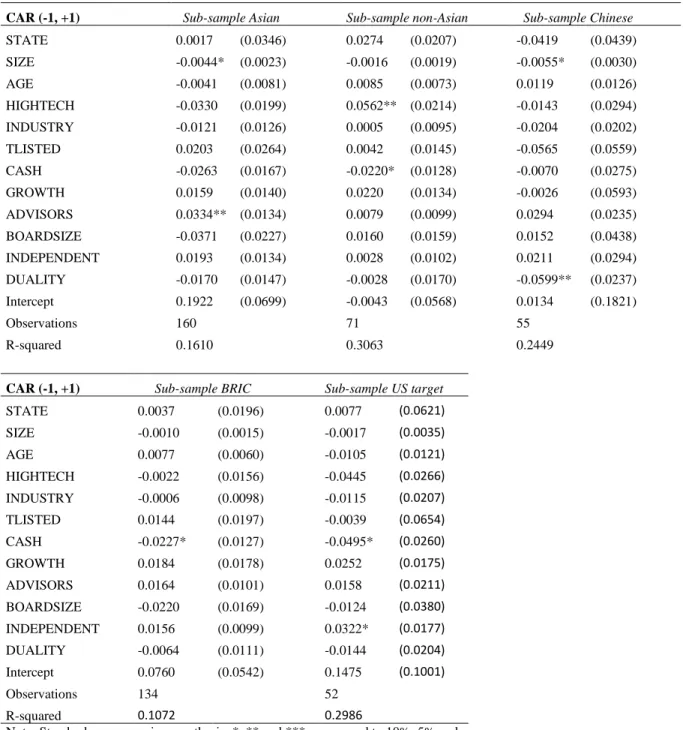
Table 5 goes into deeper detail and presents the CARs for each of the sub-samples built. For the sub-samples, only the fourth model with all the variables was presented, with the 2 days event window. This was because the fourth model is the most complete and the most statistically significant, and the first window is the one with the most positive returns (table 2), and on average, the one showing more statistically significant results on all models. Out of the five
17
sub-sample regressions, two are statistically significant: the sub-sample of Asian acquirers and of non-Asian acquirers, at a 1% and 5% level, respectively.
The variable “STATE” was expected to have a negative coefficient, following Chen and Young (2009)’s results of investors being more sceptical for cross-border M&As when the government is the biggest shareholder, in the case of China. China is the country with the highest number of state-owned companies of the whole sample, however, this variable is positive and statistically significant in the third model and insignificant in all other significant models. In the sub-sample of Chinese firms, where the biggest effect was expected to be seen, the variable is insignificant. Thus, being state-owned was not found to have a negative effect, but rather, a very small but positive effect.
Firm size is associated with higher bargaining power and as Chen and Young (2009) say “larger firms are more likely to have slack resources for M&A, especially in an emerging economy context”. Surprisingly, this analysis found a statistically significant negative effect of the acquirer’s size on the markets’ reactions, and this happens in all the sub-samples too. Most literature of cross-border M&A in emerging markets find no significant effect of the size of the company. However, Martynova and Renneboog (2008) did find a negative and statistically significant coefficient for the bidder’s size on the bidder’s CARs. This effect could be explained by Moeller, Schlingemannb and Stulz (2004)’s conclusions which state that “large firms offer larger acquisition premiums than small firms and enter acquisitions with negative dollar synergy gains”, and also that managerial hubris is more present in big firms than in smaller ones.
The company’s age does not appear to play a role in the success of the acquisition but being high tech does. Being related to the high technology industry shows negative coefficients for the whole sample, although only statistically significant in model two for (-1, +1) and (-2, +2) event windows. This negative effect was also found by Aybar and Ficici (2009). However, the same coefficient is positive and statistically significant in the sub-sample of non-Asian companies. The sub-sample of Asian companies should then, have a negative coefficient that would offset the positive effect observed in the non-Asian sub-set. However, this effect is not observed, and the variable is statistically insignificant, which could come from the limitation of the samples being too small.
18
EMMs are more likely to acquire firms in a related industry, as these deals are seen as less likely to destroy value especially in cross-border acquisitions (Narayan and Thenmozhi, 2014). This was observed, as 62.4% of the deals in the sample were from industry-related companies. However, no positive impact was found. In fact, although statistically insignificant, the coefficients are mostly negative. This result is not atypical, as many other studies in the area have also found insignificant coefficients. This may be explained by the fact that diversification can bring value which might outweigh the advantage of being in the same industry. An example of that is Ghosh (2001) who finds that diversifying acquisitions are more successful than the industry-related ones. However, this study finds that market returns do not depend on industry relatedness.
The variable corresponding to the target firm being listed is always statistically insignificant and its sign is inconsistent, being mostly positive. As such, no conclusions can be taken.
Payment in cash has a negative effect on shareholders’ wealth creation. Among many others, this finding coincides with Moeller et al. (2004) but contradict Narayan and Thenmozhi (2014). Several factors could explain this. The first factor could be the need of borrowing money when paying in cash instead of stock, which increases the risk of financial distress; another possible factor is the fact that cash acquisitions are usually taxable, decreasing the capital gains; the risk of synergies not being created is bared solely by the acquirer’s shareholders, instead of proportionately shared in the cases of payments in stock, which can make investors less confident in the announcement date.
The growth rate of the acquirer’s country in the year of the acquisition has a positive and significant effect (at a 10% level). Yang (2015) found in her study of ownership participation a positive relationship between the home country GDP growth rate and the cumulative abnormal returns for the (-1, +1) window for cross-border acquisitions by emerging-country firms. It is, then, possible to conclude that the higher the economic growth, the more positive is the acquisition perceived by investors, probably because the companies are expected to grow alongside with their home country’s economy.
4.2.2 Financial Advisors
One study closely related to this one, by Li, Li and Wang, also studied the impact of hiring financial advisors in cross-border acquisitions of Chinese firms and found a negative effect.
19
However, this study contradicts their results, as the variable is always positive and statistically significant for the whole sample. Thus, as hypothesized, there is evidence of a positive relationship between the use of financial advisors and cumulative abnormal returns.
As mentioned above, there are several ways in which financial advisors bring value to the acquirer. These include knowledge sharing, culture differences mitigation, due diligence performance, lowering contracting and transactions costs and reducing information asymmetry. It can now be said that the value created does offset the high costs associated with the contract, independently of the advisor’s reputation or categorization. This is also true for the sub-sample of Asian firms.
4.2.3 Corporate Governance
The variables BOARDSIZE, INDEPENDENCE and DUALITY tackle corporate governance. As expected, INDEPENDENCE has a positive coefficient and DUALITY has a negative one. However, they are insignificant, so they provide no statistical evidence of their value creation and destruction. Two different cases can be observed when segregating the sample: for the sub-sample of deals with US targets, having an independence ratio above the median shows a positive and statistically significant effect; and in the sub-sample of Chinese firm there is evidence of the negative effect of CEO duality on the acquisition returns. Lastly, the variable BOARDSIZE was, surprisingly, found to have a negative influence in wealth creation, as it has a negative and significant (at a 10% level) coefficient.
In summary, there is no evidence to support the hypotheses 2a and 2b. There is, however, evidence of the positive effect of each corporate governance practices on acquisitions in the sub-sample of Chinese firms and of deals with US targets.
Table 4. Cross-sectional analysis: CARs for developing-market acquirers.
Model 1 Model 2 Model 3 Model 4
CAR (-1, +1) STATE 0.0116*** (0.0206) 0.0145 (0.0204) 0.0055** (0.0233) 0.0124 (0.0231) SIZE -0.0031 (0.0014) -0.0033** (0.0014) -0.0042 (0.0017) -0.0042** (0.0017) AGE -0.0046 (0.0053) -0.0039 (0.0053) -0.0011 (0.0056) 0.0008 (0.0055) HIGHTECH -0.0277 (0.0141) -0.0255* (0.0140) -0.0185 (0.0157) -0.0164 (0.0155) INDUSTRY -0.0071 (0.0085) -0.0049 (0.0085) -0.0104 (0.0092) -0.0094 (0.0091) TLISTED 0.0138 (0.0147) 0.0068 (0.0148) 0.0178 (0.0161) 0.0108 (0.0161) CASH -0.0105 (0.0107) -0.0136 (0.0106) -0.0190 (0.0117) -0.0228* (0.0116)
20
Table 4 continued. Cross-sectional analysis: CARs for developing-market acquirers.
Model 1 Model 2 Model 3 Model 4
GROWTH 0.0130 (0.0095) 0.0141 (0.0095) 0.0264* (0.0143) 0.0254* (0.0141) ADVISORS 0.0235*** (0.0089) 0.0265*** (0.0096) BOARDSIZE -0.0211 (0.0149) -0.0258* (0.0148) INDEPEN 0.0099 (0.0090) 0.0092 (0.0089) DUALITY -0.0041 (0.0113) -0.0049 (0.0111) Intercept 0.0895 (0.0295) 0.0831 (0.0293) 0.1612 (0.0477) 0.1550 (0.0470) Observations 300 300 236 236 R-squared 0.0411 0.0637 0.0985 0.1284 CAR (-2, +2) STATE -0.0081 (0.0228) -0.0046 (0.0225) -0.0066 (0.0252) 0.0015 (0.0249) SIZE -0.0018 (0.0015) -0.0021 (0.0015) -0.0040** (0.0018) -0.0040** (0.0018) AGE -0.0058 (0.0059) -0.0051 (0.0058) -0.0033 (0.0060) -0.0011 (0.0060) HIGHTECH -0.0331** (0.0157) -0.0304* (0.0155) -0.0167 (0.0170) -0.0143 (0.0167) INDUSTRY -0.0103 (0.0095) -0.0076 (0.0094) -0.0137 (0.0100) -0.0126 (0.0098) TLISTED 0.0059 (0.0163) -0.0026 (0.0163) 0.0082 (0.0174) -0.0001 (0.0173) CASH -0.0127 (0.0118) -0.0164 (0.0117) -0.0189 (0.0127) -0.0235* (0.0125) GROWTH 0.0062 (0.0106) 0.0075 (0.0104) 0.0233 (0.0155) 0.0221 (0.0152) ADVISORS 0.0284*** (0.0098) 0.0310** (0.0103) BOARDSIZE -0.0123 (0.0161) -0.0179 (0.0159) INDEPENDENT 0.0019 (0.0097) 0.0011 (0.0096) DUALITY -0.0057 (0.0122) -0.0067 (0.0120) Intercept 0.0725 (0.0327) 0.0648 (0.0324) 0.1478 (0.0515) 0.1406 (0.0506) Observations 300 300 236 236 R-squared 0.0310 0.0581 0.0699 0.1061 CAR (-5, +5) STATE -0.0096 (0.0332) -0.0044 (0.0328) 0.0264 (0.0389) 0.0391 (0.0384) SIZE 0.0015 (0.0023) 0.0010 (0.0022) -0.0011 (0.0028) -0.0010 (0.0027) AGE -0.0005 (0.0086) 0.0006 (0.0085) 0.0000 (0.0093) 0.0036 (0.0092) HIGHTECH -0.0245 (0.0228) -0.0206 (0.0226) 0.0027 (0.0262) 0.0066 (0.0258) INDUSTRY 0.0129 (0.0138) 0.0169 (0.0137) 0.0099 (0.0154) 0.0118 (0.0151) TLISTED -0.0068 (0.0237) -0.0194 (0.0238) 0.0072 (0.0269) -0.0058 (0.0267) CASH -0.0095 (0.0172) -0.0151 (0.0171) -0.0131 (0.0196) -0.0203 (0.0193) GROWTH 0.0020 (0.0154) 0.0040 (0.0152) -0.0186 (0.0239) -0.0204 (0.0234) ADVISORS 0.0421*** (0.0143) 0.0489*** (0.0159) BOARDSIZE 0.0046 (0.0249) -0.0041 (0.0246) INDEPENDENT 0.0076 (0.0150) 0.0064 (0.0148) DUALITY 0.0042 (0.0188) 0.0027 (0.0185) Intercept -0.0018 (0.0476) -0.0133 (0.0472) -0.0440 (0.0795) -0.0554 (0.0781) Observations 300 300 236 236 R-squared 0.0100 0.0387 0.0109 0.0511
21
Table 5. Cumulative abnormal return for the 2 days window for the different sub-samples.
CAR (-1, +1) Sub-sample Asian Sub-sample non-Asian Sub-sample Chinese STATE 0.0017 (0.0346) 0.0274 (0.0207) -0.0419 (0.0439) SIZE -0.0044* (0.0023) -0.0016 (0.0019) -0.0055* (0.0030) AGE -0.0041 (0.0081) 0.0085 (0.0073) 0.0119 (0.0126) HIGHTECH -0.0330 (0.0199) 0.0562** (0.0214) -0.0143 (0.0294) INDUSTRY -0.0121 (0.0126) 0.0005 (0.0095) -0.0204 (0.0202) TLISTED 0.0203 (0.0264) 0.0042 (0.0145) -0.0565 (0.0559) CASH -0.0263 (0.0167) -0.0220* (0.0128) -0.0070 (0.0275) GROWTH 0.0159 (0.0140) 0.0220 (0.0134) -0.0026 (0.0593) ADVISORS 0.0334** (0.0134) 0.0079 (0.0099) 0.0294 (0.0235) BOARDSIZE -0.0371 (0.0227) 0.0160 (0.0159) 0.0152 (0.0438) INDEPENDENT 0.0193 (0.0134) 0.0028 (0.0102) 0.0211 (0.0294) DUALITY -0.0170 (0.0147) -0.0028 (0.0170) -0.0599** (0.0237) Intercept 0.1922 (0.0699) -0.0043 (0.0568) 0.0134 (0.1821) Observations 160 71 55 R-squared 0.1610 0.3063 0.2449
5. Limitations and Future Research
Like any other study, this is not without limitations. The first comes with the employment of the event study methodology. Although a standard in this field, this methodology is grounded on the assumption that the financial markets react immediately to the announced information, and that its response is complete and unbiased. In addition to this, the model assumes a semi-strong form of the efficient market hypothesis, meaning all
CAR (-1, +1) Sub-sample BRIC Sub-sample US target STATE 0.0037 (0.0196) 0.0077 (0.0621) SIZE -0.0010 (0.0015) -0.0017 (0.0035) AGE 0.0077 (0.0060) -0.0105 (0.0121) HIGHTECH -0.0022 (0.0156) -0.0445 (0.0266) INDUSTRY -0.0006 (0.0098) -0.0115 (0.0207) TLISTED 0.0144 (0.0197) -0.0039 (0.0654) CASH -0.0227* (0.0127) -0.0495* (0.0260) GROWTH 0.0184 (0.0178) 0.0252 (0.0175) ADVISORS 0.0164 (0.0101) 0.0158 (0.0211) BOARDSIZE -0.0220 (0.0169) -0.0124 (0.0380) INDEPENDENT 0.0156 (0.0099) 0.0322* (0.0177) DUALITY -0.0064 (0.0111) -0.0144 (0.0204) Intercept 0.0760 (0.0542) 0.1475 (0.1001) Observations 134 52 R-squared 0.1072 0.2986
Note: Standards errors are in parenthesis; *, ** and *** correspond to 10%, 5% and 1% significance level, respectively.
22
new public information is believed to be reflected in the prices. It is, however, fair to believe that not all investors fully understand all the mechanisms surrounding the transactions, especially knowing that these deals can be extremely complex.
A second limitation stems from the measurement of corporate governance. Corporate governance is a complex area, whose quality is difficult to access in solely quantitative measures. When using quantitative measurements, it would, ideally, include more variables, corresponding both from company-specific principles and nation-wide regulations. Hence, the two variables used are relevant, but conclusions should be drawn sensibly from them.
Another limitation is the sample size. 300 deals constitute a sizeable sample, but it is not big enough to allow for the construction of significant sub-samples that bring relevant results. The last limitation is related to the time range considered. Between 2005 and 2020 there was a world financial crisis which started in 2008. This crisis affected the world economy and it might have affected M&A transactions and the way investors perceive its value.
From these limitations, some avenues of future research arise. There is room for research in the impact of corporate governance using a more in-depth data collection on the matter considering more variables from both the acquirer and the target. It could also be interesting to study the impact the financial crisis had on shareholders’ wealth creation arising from this type of acquisitions.
6. Managerial implications
This study is relevant for management, as the conclusions presented affect managers’ decision-making. It is increasingly common for developing-market firms to want to expand and consider acquiring developed-market entities. It is, thus, increasingly important for the management of such firms to be informed of what the literature says about the impact those transactions have on shareholder wealth. It is important to note that this paper examines the market returns caused by the announcement of the acquisition, and it does not account for the post-acquisition performance or the long-term success of the transaction.
From the conclusions drawn in this paper, several managerial implications arise. The first one is the general recommendation for undertaking this type of investment, since these acquisitions, on average, create value. Then, when deciding to proceed with an acquisition,
23
the use of financial advisors is recommended, as they are proved to contribute significantly for the value creation. The results of this study also suggest that it might be beneficial to opt for a stock or mix-stock mode of payment, instead of paying all-cash, and that acquiring firms that belong to related industries does not necessarily mean the investment is safer. These are the main takeaways from this paper that give emerging-market firms’ managers more insights so to take more informed decisions with greater chances of success.
7. Conclusion
This paper’s goal is to understand shareholder wealth creation for the new and growing phenomenon of developing-country firms acquiring developed-country targets. For that, the event study methodology was used, which is a standard in M&A literature. This study uses a sample of 300 deals from 2005 to 2020 from listed acquirers of ten different developing countries. The targets are mostly from European countries, with 166 transactions, and from the US with 65. The market model was used to calculate the abnormal returns and the cumulative abnormal returns. The abnormal returns are positive for the interval of two days before the acquisition until one day after, being statistically significant for the day of the announcement and the day after at a 1% level, which leads to the deduction that the financial markets react quickly to the announcements. The cumulative abnormal returns were calculated using three event windows to capture possible earlier information leaks and delays in investors’ reactions. For the three event windows – (-1, +1), (-2, +2) and (-5, +5) – the CARs are positive. For the two first windows they are significant at a 1% level and take a value of almost 2%. These results show an unequivocal value creation, confirming the first hypothesis.
Five sub-samples were created according to the country of origin and the country of the target for a better understanding of the behaviour of the markets. By analysing the CARs for the sub-samples, it is possible to find the same positive and statistically significant market reactions for the Asian, Chinese and BRIC acquirers. For the sub-samples of non-Asian acquirers and of US targets, there is no evidence of statistically significant effects, although the CARs are positive.
A cross-sectional analysis was then constructed, using the CARs as the dependent variable. From the cross-sectional analysis, the use of financial advisors was proven to be beneficial, as hypothesized, having a statistically significant and positive effect. The same
24
could not be found for the corporate governance hypothesis. Evidence of a positive impact of board independence was only found for the sub-sample of US targets and the statistically significant negative effect of CEO duality was only observed for the sub-sample of Chinese firms. Hence, the model gives evidence to validate the financial advisors’ hypothesis, but not the corporate governance one.
The control variables used gave robustness to the model and also gave rise to interesting takeaways. Being state-owned was shown to have a small but positive and statistically significant effect on market returns, showing investors are more confident of the success of acquisitions from state-owned companies. Another finding was that firm size and all-cash payments are associated with value destruction. Being high tech also yields a negative effect for the whole sample, but a positive effect when studying solely non-Asian bidders. Lastly, higher GDP growth rates of the acquirer’s home country lead to higher returns.
As Narayan and Thenmozhi (2014) said, successful EMMs are expected to continue to acquire developed-market targets. Thus, this phenomenon will continue to be observed, and EMMs will continue to gain ground in the global market and further close the gap between them and developing economies and their players.
To conclude, acquisitions from emerging-market firms taking over developed-market targets is a relatively new and growing phenomenon. On average, these acquisitions, create value for the acquirer, with financial advisors significantly and positively impacting the value creation.
25
8. References
Angwin, Duncan (2001), “Mergers and acquisitions across european borders: national perspectives on preacquisition due diligence and the use of professional advisers”, Journal of
World Business, vol. 36, p.32-57.
Aybar, Bülent, and Aysun Ficici (2009), “Cross-border acquisitions and firm value: An analysis of emerging-markets multinationals”, Journal of International Business Studies, vol. 40, April, p.1317-1338.
Arun, Thankom, Faizul Haque and Colin Kirkpatrick (2008), “Corporate governance and capital markets: a conceptual framework”. Corporate ownership and control, vol. 5, p.264-276. Balasubramanian, Bala, Bernard Black and Vikramaditya Khanna (2010), “The relation between firm-level corporate governance and market value: A study from India”, Emerging
Markets Review, vol.11, p. 319-340.
Bao, Jack, and Alex Edmans (2011), “Do investment banks matter for M&A returns?”, The
Review of Financial Studies, vol.24, May, p.2286-2315.
Bebczuk, Ricardo (2005), “Corporate governance and ownership: Measurement and impact on corporate performance and dividend policies in Argentina”, IDB working paper no. 211, November.
Beiner, Stefan, Wolfgang Drobetz, Markus Schmid, and Heinz Zimmermann (2006), “An integrated framework of corporate governance and firm valuation”, European Financial
Management, vol. 12, p. 249-283.
Benou, Georgina, Kimberly C. Gleason, and Jeff Madura (2007), “Impact of Visibility and Investment Advisor Credibility on the Valuation Effects of High-Tech Cross-Border Acquisitions”, Financial Management, p. 69-89.
Bhagat, Sanjai, Shavin Malhotra, and PengCheng Zhu (2010), “Emerging country cross-border acquisitions: Characteristics, acquirer returns and cross-sectional determinants.”, Emerging
26
Black, Bernard, António Gledson de Carvalho, and Érica Gorga (2011), “What matters and for which firms for corporate governance in emerging markets? Evidence from Brazil (and other BRIK countries)”, Journal of Corporate Governance, vol. 18, May, p. 934-952.
Black, Bernard, Hasung Jang and Woochan Kim (2006), “Does corporate governance predict firms’ market values? Evidence from Korea”, Journal of Law, Economics and Organization, vol.22.
Black, Bernard, Inessa Love, and Andrei Rachinsky (2006), “Corporate governance indices and firms’ market values: Time series evidence from Russia”, Emerging Markets Review, vol. 7, p. 361-379.
Black, Bernard and Woochan Kim (2007), “The value of board independence in an emerging market: IV DiD, and time Series evidence from Korea”, American Law & Economics
Association Papers, July.
Boateng, Agyenim, Wang Qian, and Yang Tianle (2008), “Cross-border M&A’s by Chinese firms: an analysis of strategic motives and performance”, Thunderbird International Business
Review, vol. 50, July/August, p.259-270.
Boeh, Kevin (2011), “Contracting costs and information asymmetry reduction in cross-border M&A”, Journal of Management Studies, vol. 48, May.
Brickley, James, Jeffrey L. Coles, and Gregg Jarrell (1997), “Leadership structure: Separating the CEO and the Chairman of the board”, Journal of Corporate Finance, vol. 3, June, p. 189-220.
Bris, Arturo and Christos Cabolis (2008), “The value of investor protection: firm evidence from cross-border mergers”, The Review of Financial Studies, vol. 21, March, p.605-648.
Bruner, Robert, F., Robert M. Conroy, Javier Estrada, Mark Kritzman and Wei Li (2002), “Introduction to ‘valuation in emerging markets’”, Emerging Markets Review, vol.3, p.310-324.
Cadbury, Adrian (1992), Report of the committee on the financial aspects of corporate
27
Cakici, Nusret, Chris Hessel, Kishore Tandon. (1996), “Foreign acquisitions in the United States: effect on shareholder wealth of foreign acquiring firms”, Journal of Banking & Finance, vol.20, November, p.307-329.
Campos, Calos E., Roberto E. Newell, and Gregory Wilson (2002), “Corporate governance develops in emerging markets”, McKinsey on Finance. Accessed on April 30.
https://www.mckinsey.com/client_service/corporate_finance/latest_thinking/mckinsey_on_fin ance/~/media/DD152F22B7CC4B099913E114AC5558FB.ashx
Chari, Anusha, Paige Ouimet, Linda L. Tesar (2004), “Cross border mergers and acquisitions in emerging markets: the stock market valuation of corporate control”, SSRN Electronic
Journal, March.
Chen, Yuan Y., and Michael N. Young (2009), “Cross-border mergers and acquisitions by Chinese listed companies: A principal-principal perspective”, Asia Pacific Journal of
Management, vol. 27, June, p.523-539.
Chernykh, Lucy, Ivonne Liebenberg and António J. Macias (2011), “Changing direction: cross border acquisitions by emerging market firms”, SSNR Electronic Journal, October.
Cheung, Yan-Leung, J. Thomas Connelly, Piman Limpaphayom, and Lynda Zhou (2006), “Do investors really value corporate governance? Evidence from the Hong Kong market”, Journal
of International Financial Management & Accounting, vol. 18, June, p. 86-122.
Claessens, Stijn, and B. Burcin Yurtoglu (2012), “Corporate governance in emerging markets: A survey”, Emerging Markets Review, vol.15, January, p. 1-33.
Cogman, David, Patrick Jaslowitzer and Marc Steffen Rapp (2015), “Why emerging countries acquire abroad”, McKinsey on Finance. Accessed on April 24.
https://www.mckinsey.com/~/media/McKinsey/dotcom/client_service/Corporate%20Finance/ MoF/Issue%2055/MoF55_Why_emerging-market_companies_acquire_abroad.ashx
Dahya, Jay, Orlin Dimitrov and John J. McConnell (2008), “Dominant Shareholders, Corporate Boards and Corporate Value: A Cross-Country Analysis”, SSRN Electronic Journal, vol.87, p.73-100.