A Work Project presented as part of the requirements for the Award of a master’s degree in finance from the
NOVA – School of Business and Economics.
Lufthansa AG – Individual Report – Distance flown per aircraft analysis
Leopold Hagen Niemann Bartels (34004)
A Project carried out on the master’s in finance Program, under the supervision of:
Rosário André
Abstract
Due to the supply driven business driver model, the inherit inputs contain demand
implications, which needed to be checked and in line with the projected expectations of our
model. The parameter distance flown per aircraft have the highest share price sensitivity
and decreased recently from 3.35 to 2.62 in 2 years (-22%). Two important circumstances
had an effect on the development of this parameter: Lufthansa´s recent acquisitions of
short-haul airlines, as well as a drop-in fleet utilization rate. In the further, different scenarios will
be discussed to make the model consistent with our overall projections and expectations in
terms of Lufthansa´s business model and fleet utilization rate in order to project the most
likely scenario for the revenue forecast.
Keywords (up to four):
Lufthansa
Airline
Individual Report
Distance flown per aircraft
This work used infrastructure and resources funded by Fundação para a Ciência e a
Tecnologia (UID/ECO/00124/2013, UID/ECO/00124/2019 and Social Sciences DataLab,
Project 22209), POR Lisboa (LISBOA-01-0145-FEDER-007722 and Social Sciences
DataLab, Project 22209) and POR Norte (Social Sciences DataLab, Project 22209).
Distance flown per aircraft - analysis Introduction
In order to give deeper insides on Lufthansa’s equity report, it is advisable to conduct several sensitivity analyses on important factors affecting the valuation model. In this case, sensitivity factors can be further divided in financial and operating. Regarding the financial factors, it can be stated that adjusting factors while using cashflows from the original valuation model might result in inconsistencies. Since financial factors, such as capital costs etc. are stemming from financial theory, an adjustment of own expectations would lead to inconsistencies in the model. It is therefore advisable to investigate using a sensitivity analysis for the assumptions in the business model of the company itself. Thus, the most important factors are incremented in the revenues of the valuation, as most parts are linked to the projected revenues and the size of the fleet forecast. Using a supply driven revenue forecast approach, it is crucial to analyse the airline specific operating metrices in order to forecast the revenue precisely.
As visible in the spreadsheet “revenue mind map” (see Graphic 6) of the valuation model, the network airline revenues are mainly driven by several factors, which are mostly constant such as passenger load factor and average flights per plane per year. On the other hand, some factors such as average fare price per passenger and average seats per plane have suddenly changed in the last 2 years. One possible explanation for these are the recent acquisitions of Air Berlin and Brussels airline, which shifted the incremented factors in the airline revenues towards more short-haul flights instead of long-short-haul flights. Since future M&A activity can hardly be prognosticated, these most recent value can most likely be seen as best fitting magnitudes for our revenue forecast. Nevertheless, there is one factor which is heavily driven by uncertainty, which is the distance flown per aircraft. As presented in Graphic 1, there is a dramatic decrease in this factor from 2014 to 2018 by -20,4%, whereas the airline revenues increased by 15,8%. As previously stated, due to the acquisitions of Air Brussels and Air Berlin Lufthansa’s fleet increased during the past years alone through the Air Berlin acquisition by 40 aircrafts.1 In general there might be
several opposite factors regarding the effect of these acquisitions on the kilometre flown per aircraft per year.
On the first hand, the number of aircrafts increased just recently after what these aircrafts might not be fully integrated in Lufthansa’s operation. In this case, it should be assumed, that the number of distances flown per aircraft would bounce back to its original number of above 3,3 million kilometres in the future. On the other hand, the bought aircrafts (Airbus A320 family) are part of Air Berlin’s short and medium-haul fleet and are therefore assumed to fly less kilometres
per year due to higher total maintenance time. This scenario would imply a shift in the business model of Lufthansa to lower term flights. This hypothesis will be analysed later in this report, as it is not clear whether this is true or just intuition.2
In a 3rd possible scenario, both factors are not decisive and the real reason for the decrease of
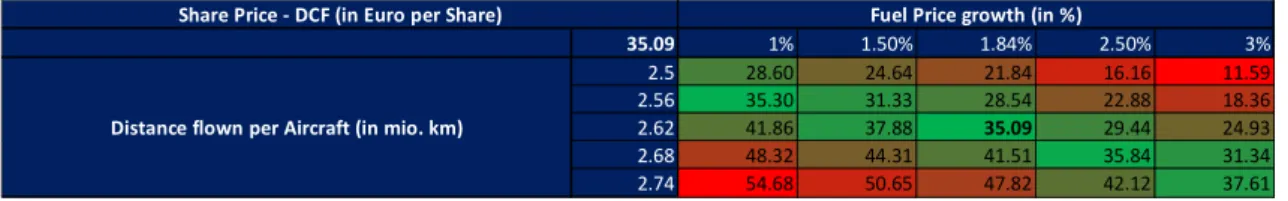
this factor is a decrease in the demand of customers toward Lufthansa’s operations resulting in a lower utilization rate for Lufthansa’s fleet. This is possible, since the presented revenue split and forecasting method is supply and not demand driven by assuming several fixed factors and letting the revenues grow or decline by the future number of aircrafts, which Lufthansa is planning to order and surrender in the future. Since Lufthansa is planning on decreasing their fleet, it seems that Lufthansa is already reacting on a possible future decrease in demand. In order to show the influence of both effects, Graphic 2 and Graphic 3 present the sensitivity of a small shift in future kilometres flown per aircraft to its share price.3 Thus, an increase (decrease) of 4,4% (-4,8%)
result in a decrease of share price by 43% (-43%) assuming a fuel price growth rate of 1,84%.4
Having such a high impact on the valuation model underlines the importance of this factor. However, there is no clear evidence how the distance flown per aircraft will move in the future and it was therefore conducted to get better insides from Lufthansa’s peers.
Competitor analysis
As presented in Graphic 4, comparable data of competitors were used to find evidence for industry standards. Thus, the average seat kilometres flown (ASK) per aircraft are around 435 kilometres per aircraft (in mio.) and Lufthansa has currently ASK per aircraft of around 460 mio. kilometres (Graphic 5). The distance flown per kilometre of the peer group is around 2,86, which is slightly higher than Lufthansa with 2.62. Having a stable ask per aircraft, the increase in average seats per aircraft adjusted for the decrease in distance flown per aircraft.
𝐴𝑆𝐾 𝑝𝑒𝑟 𝑎𝑖𝑟𝑐𝑟𝑎𝑓𝑡 =∗𝐷𝑖𝑠𝑡𝑎𝑛𝑐𝑒 𝑓𝑙𝑜𝑤𝑛 𝑝𝑒𝑟 𝑎𝑖𝑟𝑐𝑟𝑎𝑓𝑡 ∗ 𝐴𝑣𝑒𝑟𝑎𝑔𝑒 𝑠𝑒𝑎𝑡𝑠 𝑝𝑒𝑟 𝑎𝑖𝑟𝑐𝑟𝑎𝑓𝑡 𝑃𝑎𝑠𝑠𝑒𝑛𝑔𝑒𝑟 𝐿𝑜𝑎𝑑 𝐹𝑎𝑐𝑡𝑜𝑟 (𝑖𝑛 %)
Having a stabile load factor of around 80%, this would intuitively support the previously mentioned idea of a shift in business model to more short-haul flights. In order to investigate this, Graphic 4 shows the average seats per aircraft and the distance flown per aircraft for other airlines. The correlation between both metrices is negative (𝜌 = −0.73), which means that the average seats per aircraft and distance flown per aircraft are negatively correlated. This means exactly the opposite; long-haul flights airlines tend to have lower distance flown per aircraft and vice versa as
2 https://www.alternativeairlines.com/airbus-a320 3 Appendix: Graphic 4
4
long-haul aircrafts have higher seats per aircraft. It would also mean that even though there was a drop in distance flown per aircraft, the shift in business model to more short-haul airlines must have had a positive effect on distance flown per aircraft As a logical consequence, the drop in distance flown per aircraft must be explained by a lower utilization rate of their fleet, which might have been even overbalanced the opposite effect from their shift to more short-haul flights. This would also explain why the company is planning to reduce their fleet size drastically, in order to increase utilization rate again.
Conclusion / Forecast
Regarding the discussed facts and scenarios of development for this parameter and by already assuming a decrease in Lufthansa’s fleet in the future from 763 to 652 in 2025, it is assumed that this metrics is going to stabilize around the last years value of 2,62. Lufthansa is currently slightly below the peer group average. Furthermore, it is reasonable, that Lufthansa is not going to purchase over-proportional amounts of aircrafts for its short and medium-haul business, since the aircraft forecast does not show this and the main reason for the Air Berlin purchase was the relative cheapness of Air Berlins assets for Lufthansa. Additionally, the short and medium-haul flight business of Lufthansa (Germanwings, Air Brussel) are under high pressure from other competitors, such as Ryanair 5, which does not support the fact that Lufthansa would invest
over-proportional into its short and medium-haul flight business. Further airline acquisitions on the European domestic market might push this metrics a bit higher, but potential acquisitions are not predictable by now and have to be incorporated in the model separately.
Appendix Graphic 1:
Graphic 2: Graphic 3: Graphic 4: 35.09 1% 1.50% 1.84% 2.50% 3% 2.5 28.60 24.64 21.84 16.16 11.59 2.56 35.30 31.33 28.54 22.88 18.36 2.62 41.86 37.88 35.09 29.44 24.93 2.68 48.32 44.31 41.51 35.84 31.34 2.74 54.68 50.65 47.82 42.12 37.61
Fuel Price growth (in %)
Distance flown per Aircraft (in mio. km) Share Price - DCF (in Euro per Share)
Share Price - DCF (Change in %)
35.09 1% 1.50% 1.84% 2.50% 3% 4.8% -18% -30% -38% -54% -67% 2.3% 1% -11% -19% -35% -48% 0.0% 19% 8% 0% -16% -29% -2.2% 38% 26% 18% 2% -11% -4.4% 56% 44% 36% 20% 7% Change in distance flown per aircraft in %
Fuel Price growth (in %)
ASK RPK Load Factor (in%) Airplanes PassengersASK per aircraft Distance flown per aircraft Available seats per aircraft
AAL US Equity 453.9 372.2 82% 940 204 482.9 1.94 248.8 DAL US Equity 423.8 362.4 85% 912 193 464.7 2.06 225.7 UAL US Equity 443.0 370.3 84% 790 158 560.7 2.97 189.0 LUV US Equity 257.2 214.5 83% 750 130 342.9 2.20 155.9 1055 HK Equity 314.4 259.2 82% 847 130 371.2 2.35 157.7 600115 CH Equity 244.8 201.5 82% 692 121 353.8 2.41 147.0 RYA ID Equity 184.4 177.0 96% 450 140 409.7 2.81 145.8 601111 CH Equity 273.6 220.5 81% 669 102 409.0 3.23 126.6 THY AO TI Equity 182.0 149.1 82% 347 75 524.6 5.73 91.6
Graphic 5:
Graphic 6:
Airline Revenues Revenue Seat
kilometers (RSK) Passenger per kmAverage fare per (1 + expected
inflation)
Average fare per Passenger per km (t-1) Passengers per Year Kilometers flown (in
mio. - km)
X
X X
Load Factor (in %) Total available seats per year (in mio.)
# Total Airplanes (t) Seats per aircraft
Average flight per plane per aircraft (5 year
average)
Amount of sold or
scrapped airplanes (Projected) Total Deliveries
# Airplanes (t-1)
Average age per airplane (*assumed to
stay constant)
/ Projected options redeemed for additional
aircrafts
Requested new aircraft deliveries
X
Seats peraircraft (t-1) * expected growth rate
X
X X
X
Kilometres flown per
aircraft per year X # Total Airplanes (t)
Recommended Zoom: 300% 0 100 200 300 400 500 600 AAL US
Equity DAL USEquity UAL USEquity LUV USEquity 1055HK Equity 600115 CH Equity RYA ID Equity 601111CH Equity THYAO TI Equity Se at k m p er a irc ra t ( in m io .)