Serra cheese
A. C. Macedo & F. X. Malcata”Escola Superior de Biotecnologia. Universidade Catdiica Portuguesa, Rua Dr. Antdnio Bernardino de Almeida, 4200 Porto, Portugal (Received 2 February 1996; revised version received 29 March 1996; accepted 29 March 1996)
Hydrolysis of the major caseins in Serra cheese manufactured from raw sheep’s milk coagulated with a plant rennet (Cynara cardunculus. L.) was monitored by urea-PAGE electrophoresis throughout a 35 day ripening period (with sampling at 0, 7, 21 and 35 days) and throughout the cheesemaking season (with sampling at November, February and May). The (Y,- and /3-caseins were degraded up to 82 and 76%, respectively, by 35 days of ripening. The a,-casein variants (Q- and (Y,~-) displayed similar degradation patterns to one another, but different from those of B-casein variants @- and p2-). Although the qcaseins were broken down more slowly than b-caseins at early stages of ripening (97, 95, 80, and 60% of LY,~-, os3-, PI-, and &caseins, respectively, were still intact by 7 days), this observation was reversed for later stages of ripening (18, 18, 30, and 20% of (YQ-, (Y,~-, PI-, and B2-caseins, respectively, were still intact by 35 days of ripening). The position along the cheese-making season significantly affected the hydrolysis of only the #I2- and cx,3-caseins. Degradation of qs-casein was slower in February than in November or May for 21-day old cheeses; cheeses ripened for 7 days or 21 days showed more intact p2-casein when manufactured in May than in November or February. The magnitude of the correlation coefficients pertaining to concentrations of intact as- and /?-caseins indicated that the products of pro- teolytic breakdown with higher mobility than qcaseins (tentatively termed art-I, (~2-1, and 1~3-1) were preferentially correlated with cqcaseins, the products of proteolytic breakdown with mobility between @zaseins and cr,-caseins (tenta- tively termed /$-I and p2-I) were preferentially correlated with fit- and &caseins rather than with cYs-caseins, and the products of proteolytic breakdown with the highest mobility (tentatively termed o/fir-II and o/&-II) were preferentially cor- related with /I-caseins. Copyright ‘0 1996 Elsevier Science Ltd
INTRODUCTION
The most important and famous variety of traditional Portuguese cheese is manufactured in the inner regions of Portugal geographically confined to the Serra moun- tains; this type of cheese is made from raw sheep’s milk on the farm level only with the dried flowers of the plant
Cynara cardunculus (thistle) as rennet and without any deliberate addition of a starter. In adition to a clotting activity similar to that of chymosin (Vieira de SB & Barbosa, 1970, 1972; Barbosa, 1983), such vegetable rennet also displays a strong proteolytic action in vitro
(Morgado, 1990; Sousa, 1993) which eventually leads to extensive breakdown of the caseins in the cheese matrix. Protein breakdown has an obvious role in determining the texture (which in the case of Serra is rather soft and buttery) and background flavour intensity (which in the *To whom correspondence should be addressed.
case of Serra is rather clean, smooth and slightly acid) and thus in making flavour precursors available (Adda
et al., 1982). Although primary proteolysis has been extensively studied for several cheese varieties manu- factured with bovine or ovine milks coagulated with animal or microbial rennets, little information is available on the primary proteolysis of cheeses manu- factured from ovine milk using a plant rennet, and essentially no information has been generated on the primary proteolysis of Serra cheese (as empha- sized in the comprehensive review by Macedo et al.,
1993).
The kinetic characteristics (i.e. rate), the thermo- dynamic characteristics (i.e. extent) and the selectivity characteristics (i.e. the relative rate of enzymatic action towards the various caseins and fragments thereof, available in the cheese matrix) of proteolysis are known to depend on the source of enzyme(s) in question, the type of cheesemaking technology (and thus the 43
curd composition) and the environmental conditions prevailing during ripening. This communication reports work on the evolution of hydrolysis of o,- and p-caseins in Serra cheese as assayed by polyacrylamide gel elec- trophoresis at different times in the ripening period and in the cheesemaking season. In view of the unique characteristics of Serra cheese encompassing use of raw ovine milk, addition of a plant rennet, essentially man- ual cheesemaking and ripening conditions determined chiefly by the outer weather, unique proteolysis profiles are anticipated.
MATERIALS AND METHODS Cheese manufacture and sampling
Three batches of twelve 0.5 kg cheeses were prepared in a small, certified dairy farm in the Appe’llation Serra
Controllke region in three sequential periods within the cheesemaking season (namely, November, February and May). The three periods within the cheesemaking season were chosen sufficiently appart from each other to be representative of different milk compositions (arising from different physiological states of the sheep and different composition of the feed) and different ripening conditions (arising from different temperatures and relative humidities of the local weather).
The traditional method was used to manufacture the cheeses: crude kitchen salt was added to the milk (at a level of 12 g of salt per Iitre of milk) and stirred to accelerate solubilization; ground dry thistle flower (at a level of 0.4 g per litre of milk) was mixed with tap water until a brown suspension was obtained, this suspension was filtered through a fine, clean cloth and the clear filtrate was added to the milk and gently stirred; the milk was then allowed to rest at about 28 “C until com- plete coagulation had occurred (for about 1 h); the curd was manually cut in order to obtain small, irregularly shaped pieces which were then poured into a fine cloth bag and lightly pressed by hand for about 10 min; the curd paste was then divided into several plastic per- forated moulds and drainage of whey was completed via pressing of the fresh cheese while in the mould via a 10 kg metal block for about 12 h (cheeses were turned upside down after about 6 h); salting was completed by rubbing the whole outer surface of the cheese with kitchen salt (at a level of about 15 g of salt per cheese); cheeses were ripened in chambers at 9 “C and relative humidity at 95% for the first week and thereafter in chambers without temperature or humidity control; the cheeses were inverted daily.
Three cheeses from each batch were taken randomly during the ripening period after 0,7,21 and 35 days and transported under refrigerated conditions (about 4 “C) for analysis. After having removed the rind, samples were taken from each cheese, homogenized and frozen
at about -30°C in Whirl-pak@ vacuum packages (Cole-Parmer, Chicago, IL), until analysed.
Chemical analyses
The total protein content of cheese was determined on 0.3 g samples by the micro-Kjeldahl method (Anon.,
1993) using a Kjeltec system with a 2012 digestor and a 1002 distilling unit (Tecator, Hoganas, Sweden). Biochemical analyses
Cheese samples (0.9 g) were thoroughly mixed with 20 ml of protein solvent as described by Creamer (199 1). Standard ovine casein solution was prepared by isoelectric precipitation of sheeps’ milk at pH 4.3 using HCl; the precipitate was washed several times with dis- tilled water, dissolved in distilled water at pH 6.6 by repeated addition of small volumes of 0.1 N NaOH and freeze-dried (FTS Systems, Stone Ridge, NY). Proteo- lysis in the aliquots of cheese samples was monitored by electrophoresis on 6 M urea-containing polyacrylamide gels (PAGE) (12.5% T, 4% C, pH 8.9) with stacking gel (4.2% T, 5% C, pH 7.6) as described by Andrews (1983) and carried out on a Protean II xi cell vertical slab-gel unit (Bio-Rad Laboratories, Watford, UK). The lOOO/ 500 power supply (Bio-Rad Laboratories) was set at 280 mV for the stacking gel and at 300 mV for the separating gel. Gels were stained with Coomassie Blue G250 (Bio-Rad, Richmond, CA) using the method of Blakesley & Boezi (1977). Quantitation of each band in the electrophoretogram was done at 550 nm using a CD60 Desaga densitometer (Desaga Sarstedt-Gruppe, Heidelberg, Germany); the extent of hydrolysis of os- and /3-caseins was assessed via the ratio of intensities of the corresponding bands at the ripening time to those at the initial time. Each cheese sample was run in two gels prepared on different days. Staining and destaining were done for the same time always using similar amounts of freshly prepared solutions.
Statistical analyses
The Statview@’ 4.0 statistical package (Haycock et al.,
1992) was used for statistical treatment of the results via analysis of variance (ANOVA table) and Fisher’s pro- tected least significance difference test (Fisher’s PLSD). This methodology was acceptable from a statistical point of view because the experimental errors were independent and normally distributed (diagnostics not shown). The two types of tests were employed to deter- mine overall and pairwise, respectively, statistical differences between the concentrations of each casein at the 5% level of significance throughout the ripening period and the cheesemaking season. The same software was employed to calculate correlation coefficients between intact caseins and primary breakdown pro- ducts.
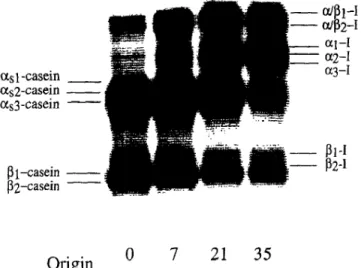
as 1 -casein _ as2-casein - as3-casein - g l-casein - g2-casein Origin 0 7 21 35
Fig. 1. Typical urea-PAGE electrophoretogram of samples of Serra cheese obtained during ripening; the numbers below the
lanes refer to the age of cheese in days.
RESULTS
The urea-polyacrylamide gel electrophoretograms (urea-PAGE) of Serra cheese during ripening (a typical example is available as Fig. 1) show that the caseins from the Bordaleira sheep contain two major groups of electrophoretic bands. According to Richardson & Creamer (1976), the group with the lower mobility consists of p-caseins and is subdivided into two variants, /?i- and &casein, which have a common polypeptide chain and appear to differ only in the degree of phos- phorylation (6 and 5 phosphate residues, respectively). The group with higher mobility consists of u,-caseins and is subdivided into three variants, Q-, os2- and a,s-casein; the clearly dominant CX,~- and ol,a-casein have similar molecular weights and calcium sensitivities but different behaviour in Mg2+-containing PAGE gels (Richardson & Creamer, 1976). The 0 d-sample in Fig. 1 shows bands with greater electrophoretic mobility than /?-caseins but lower than ar,-caseins which decrease in intensity with ripening time. Following the claim by Sousa (1993) that Cynara cardunculus and chymosin possess comparable specificity on bovine p-casein, these two bands were therefore tentatively labelled as &I. Figure 1 also shows the appearance and increase in intensity of bands with greater electrophoretic mobility than those of cr,-caseins. These bands had electro- phoretic mobilities similar to the band produced when bovine Q- casein was incubated with extracts from flowers of C. cardunculus in solution (Sousa, 1993) and were tentatively labelled as a,-I. Two other bands with greater electrophoretic mobility than a,-1 were pro- duced from the very beginning of ripening and became thicker as ripening elapsed. These two bands were tentatively termed c~//&-I1.
Proteolytic activity in cheese is determined chiefly by the levels and type of residual rennet and indigenous milk proteinases present, salt to moisture ratio, temperature of ripening, and changes in pH during ripening (Lawrence et al., 1987). By 35 days of ripening, the Q,- and /?-caseins had undergone extensive degradation, up to 82 and 76%, respectively. For long times of incuba- tion, Sousa (1993) has reported that aqueous extracts of dried flowers of C. cardunculus had higher proteolytic activities in vitro than chymosin and Vieira de Sa & Barbosa (1972) have observed high proteolytic activity (measured as the increase in water-soluble nitrogen and 4% TCA soluble nitrogen contents) of this plant rennet using cow’s and sheep’s milk as substrates. The unusually extensive hydrolysis of B-caseins (degradation of B-and cY,-caseins occur to similar extents in Serra cheese) seems to be related with the type of rennet (plant instead of animal) used since Dinakar et al. (1989) have reported that a plant rennet obtained from Withania coaguluns also extensively breaks down /3-caseins in Cheddar cheese.
In cow’s milk, /l-casein is the most susceptible sub- strate to be hydrolyzed by plasmin leading to the for- mation of y-caseins and some of the proteose peptones (Fox et al., 1993). Plasmin activity in milk is increased by pasteurization, possibly by inactivation of plasmin inhibitors or by increasing the rate of activation of plasminogen (Grufferty & Fox, 1988). It is proposed that a similar situation occurs in cheeses when higher cooking temperatures are used during manufacture (Farkye & Fox, 1990). No bands were detected in the region of y-caseins for Serra cheese (see Fig. l), which is thus a clue to low plasmin activity; since raw milk without any type of thermal treatment is utilized and cooking is not used in Serra cheesemaking, no enhancement of that enzyme is expected either.
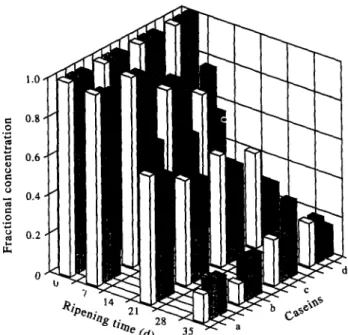
Figure 2 shows the ratio of concentrations of intact As expected, hydrolysis of caseins (os2-, rxs3-, pi-, and a,- and @-caseins to their initial concentrations during &) was affected significantly by the ripening time ripening and during the cheesemaking season. The (P < 0.0001 for all such caseins, see Fig. 2). The results
Table 1. Correlation coetBcien& (P< 0.0001) between intensi- ties of bands accounted for by intact casehs and their primary
degradatioa prod&s Casein substrate as2 aP.3 BI 82 P QYBI-11 -0.849 -0.835 -0.906 -0.931 r a/S241 -0.665 -0.653 -0.792 -0.884 : a!,-1 -0.934 -0.93 1 -0.919 -0.847 CQ-I -0.956 -0.941 -0.938 -0.868 U CY3-I -0.967 -0.953 -0.936 -0.857 C A-1 +0.883 +0.876 +0.928 + 0.912 t 82-7 +0.881 +0.867 +0.935 +0.947
coefficients of correlation between intact caseins and first breakdown products are listed in Table 1.
Fig. 2. Fractional disappearance of caseins (a: ~~2; b: 01~3; c: fii; d: 82) by hydrolysis throughout the ripening period and
throughout the cheesemaking season.
of Fisher’s PLSD analyses for a,-caseins indicate that these proteins were significantly degraded only after 7 days of ripening; ca. 97% of cr,z-casein was still intact at 7 days, 70% at 21 days and 18% at 35 days, whereas in the case of cr,a-casein 95, 60, and 18% of protein was still intact at 7, 21 and 35 days of ripening, respectively. The results of Fisher’s PLSD analyses for @-caseins suggest that these proteins were significantly degraded at all stages of ripening; about 80% of pi-casein was still intact at 7 days, 50% at 21 days and 30% at 35 days; on the other hand, /&asein was degraded faster and to a higher degree with about 60% still intact at 7 days, 40% at 21 days and 20% at 35 days. Although the o!s-caseins were degraded more slowly than #?-caseins during the initial stages of ripening, the degree of degradation of cr,-caseins at the end of ripening (say 35 days) was higher than that of #J-caseins (see Fig. 2). The overall proteolytic pattern during ripening is determined largely by the action of residual rennet enzyme(s) combined with that of enzymes produced by viable (or released by lysed) microorganisms. Although starter proteinases contribute little to the formation of large peptides (i.e. pH 4.6- or water-soluble peptides), proteinases from mesophilic streptococci are capable of hydrolyzing intact caseins in solution, especially /?-casein; appar- ently, only few strains are capable of hydrolyzing Q- casein, although this is hardly noticed in most cheeses since this protein is easily hydrolyzed by chymosin, the major constituent of animal rennets (Fox & Law, 1991). Furthermore, O’Keefe et al. (1975) found that the rate of proteolysis of a,,-casein in cheese was accelerated during manufacture and the early stages of cheese ripening when high levels of starters were used. There- fore, the significant rate of degradation of a!,-caseins only after 7 days may indicate that microflora play an
important role in hydrolysing this protein, especially if it is assumed that the enzymes of C. cardunculus do not hydrolyse ol,-caseins as rapidly as @casein (as discussed before) and that the microflora in Serra cheese are composed mostly of mesopbilic lactic acid bacteria and coliforms, the numbers of which reach values above lo6 cfu/g of cheese only after 7 days (Macedo et al., 1995; Macedo et al., 1996).
Hydrolysis of pi- and cr,z-caseins were not affected significantly by the period within the cheesemaking sea- son (P = 0.921 and P = 0.127, respectively). Hydrolysis of ar,s-casein after 21 days of ripening was lower in February (75% of protein still intact) than in May
(P=O.O42) or in November (P=O.O39), but these latter periods were statistically similar to one another (52%,
P= 0.664); for the remaining ripening times, no statis- tical difference was detected at the 5% level of sig- nificance. Fisher’s PLSD analyses showed that hydrolysis of fi2-casein at 7 days and 21 days of ripening is lower in May (69 and 49%, respectively, of protein still intact) than in the other 2 months (57 and 30%, respectively), but was statistically similar in all months tested in the case of cheeses ripened for 35 days
(P= 0.184). As mentioned before, proteolysis in cheese is affected by such factors as salt to moisture ratio, pH and temperature of ripening. In Pedroches and Serena cheeses (both made from sheep’s raw milk and Cynara sp.), the extent of hydrolysis of ol,-casein decreases with increasing ash concentration while that of p-casein is unaffected (Marcos et al., 1976, 1979). In our study, one verified that both as3- and &-caseins were positively correlated with moisture content (r=0.724 and
r = 0.652, respectively) and negatively correlated with ash to moisture ratio (I = -0.702 and r = -0.823, respec- tively) at the 5% level of significance. One also verified that 7 and 21 day-old cheeses manufactured in May possessed a significantly lower moisture content (51.2 and 48.21%, respectively) and higher ash to moisture ratio (7.44 and 7.86%, respectively) than those manu- factured in November (7 and 21 day-old cheeses possessed 54.3 and 50.9% moisture content, respec- tively, and 6.65 and 7.11% ash to moisture ratio, respectively) and in February (7 and 21 day-old cheeses possessed 56.11 and 53.27% moisture content, respec- tively, and 6.91 and 7.21% ash to moisture ratio, respectively). The pH in 7 and 21 day-old cheeses did not show significant variations throughout the cheese- making season (Macedo & Malcata, 1996). Therefore, the higher extent of hydrolysis of flz-casein can probably be explained by differences in the moisture content and ash to moisture ratio in cheeses. However, the varia- tions in the concentration of as3-casein during the chee- semaking season for 21 day-old cheeses are not consistent with the variations in the aforementioned compositional factors; therefore, it seems that the ripening temperature may affect hydrolysis of this pro- tein, especially knowing that after 7 days the ripening temperature is no longer constant but becomes mainly
determined by the outside weather (which tends to be cooler in February, about 5°C on average, than in November, about lO”C, or May, about 14°C).
The results in Table 1 indicate that concentrations of all primary degradation products were statistically cor- related with the concentrations of o,- and ,5- caseins at a significance level below 0.01%. However, based on the value of the correlation coefficients, it seems that the breakdown products, LYE-I, az-I, and cy3-I correlate better with a,-caseins than with intact pi-casein or, to a lesser extent, with intact &casein. This observation is expec- ted because, as mentioned before, the mobility of the electrophoretic bands associated with these proteins were similar to those produced by bovine asl-casein incubated with extracts of flowers of C. cardunculus in solution (Sousa, 1993). Conversely, the breakdown products /3,-I and b2-1 correlated better with fir- and #&- caseins (r>0.91) than with intact a,-caseins (rcO.88). This result agrees with Sousa (1993) in that proteinases from C. cardunculus and chymosin exhibit comparable specificities on bovine /l-casein. The breakdown pro- ducts labelled as cr//?i-II and (r/&II correlate better with /?-caseins than with a,-caseins (see Table 1). These products could result from the action of the plant rennet on the p-caseins because, as Sousa & Malcata (1996) have emphasized, cheeses manufactured with calf rennet do not show similar bands. These observations require, however, more fundamental work in order to clearly identify the degradation products via sequencing and to ascertain whether other low molecular weight products (not detectable by electrophoresis) result from hydro- lysis of (Y,- and /?-caseins.
Andrews, A. T. (1983). Proteinases in normal bovine milk and their action on caseins. J. Dairy Res., Jo, 45-55.
Anon. (1993). Milk. Determination of Nitrogen Content. IDF standard 20B.
Barbosa, M. (1983). ‘Cardo’ (Cynara cardunculus) as a vege- table rennet. Report of the Department of Technology for the Food Industry (DTIA), 58 (45). National Laboratory of Engineering and Industrial Technology (LNETI), Lisbon, Portugal.
Blakesley, R. W. & Boezi, J. A. (1977). A new staining tech- nique for proteins in polyacrylamide gels using Coomassie Brilliant Blue G2.50. Anal. Biochem., 82, W&582.
Creamer, L. K. (1991). Electrophoresis of cheese. Chemical methods for evaluating proteolysis in cheese maturation. Bull. Int. Dairy Fed., 261, 14-28.
Dinakar, P., Mathur, M. P. & Datta, R. D. (1989). Differences in proteolytic behaviour in Cheddar cheese prepared with calf and vegetable rennet. Indian J. Dairy Sci., 42, 792-796. Farkye, N. Y. & Fox, P. F. (1990). Observations on plasmin
activity in cheese. J. Dairy Res., 57, 413-418.
Fox, P. F. & Law, J. (1991). Enzymology of cheese ripening. Food Biotechnol., 5, 239-262.
Fox, P. F., Law J., McSweeney, P. L. H. & Wallace, J. (1993). Biochemistry of cheese ripening. In Cheese: Chemistry, Physics, and Microbiofogy, Vol. I. ed. P. F. Fox. Chapman and Hall, London, pp. 389438.
Grufferty, M. B. & Fox, P. F. (1988). Functional properties of casein hydrolyzed by alkaline milk proteinases. N. Zealand J. Dairy Sci. Technol., 23, 95-108.
Haycock, K., Roth, J., Gagnon, J., Finzer, W. F. & Soper, C. (1992). Statview v. 4.0: The Ultimate Integrated Data Ana- lysis and Presentation System. Abacus Concepts, Berkeley, CA.
ACKNOWLEDGEMENTS
Lawrence, R. C., Creamer, L. K. & Gilles, J. (1987). Sympo- sium: cheese ripening technology. Texture development during cheese ripening. J. Dairy Sci., 70, 1748-1760. Macedo, A. C., Malcata, F. X. & Oliveira, J. C. (1993). The
technology, chemistry and microbiology of Serra cheese: a review. J. Dairy Sci., 76, 1725-l 739.
Macedo, A. C., Malcata, F. X. & Hogg, T. A. (1995). Micro- biological profile in Serra ewes’ cheese during ripening. J. Appl. Bacterial., 79, l-l 1.
The authors are grateful to the members of the technical board of ANCOSE (the Portuguese Association of Breeders of Serra da Estrela Sheep) for their coopera- tion encompassing the local manufacture and transport of the experimental cheeses. Financial support for author A. C. M. was provided by the Ph.D. fellowship CIENCIA BD- 1741/91-IF (JNICT, Portugal). Finan- cial support for the research work was obtained via project grants MAQUETTE: MelhorAmento de QUEi- jos Tradicionais e sua TEcnologia (AI, Portugal) and Design and production of an enzymatic and microbial mixture to improve the process ewe’s cheese (Spain, France, Italy and Portugal) safety and quality and to get a novel functional food as a response to European demand for new products low in cholesterol and protein enriched (AAIR, European Union).
Macedo, A. C., Costa, M. L. & Malcata, F. X. (1996). Chan- ges in the microflora of Serra cheese: Evolution throughout ripening time, lactation period, and axial location. Int. Dairy J., 6, 79-94.
Macedo, A. C. & Malcata, F. X. (19963). Secondary proteo- lysis in Serra cheese during ripening and along the cheese- making season. Z. Lebensm. Unters. Forsch. (in press). Marcos, A., Esteban, M. A. & Fernandez-Salguero, J. (1976).
Influencia de algunos factores quimicos y fisicos en la pro- teolisis de las caseinas de1 queso. Arch. Zootec., 25, 73-82. Marcos, A., Fernandez-Salguero, J., Esteban, M. A. & Leon,
F. (1979). Relation of ash/moisture quotients in some cheeses to hydrolysis of (Y,- and /?- caseins. J. Dairy Sci., 62, 392-397.
REFERENCES
Morgado, J. M. (1990). Estudo comparative da accdo de tres proteases coagulantes do leite sobre as caseinas isoladas e em micelas. M.Sc. thesis, University of Coimbra, Portugal. O’Keefe, R. B., Fox, P. F. & Daly, C. (1975). Proteolysis in
Cheddar cheese: influence of the rate of acid production during manufacture. J. Dairy Res., 42, I 1 l-122.
Richardson, B. C. & Creamer, L. K. (1976). Comparative micelle structure. V. The isolation and characterization of the major ovine caseins. N.Z. J. Dairy Sci. Techno!., 11.46 53.
Adda, J., Gripon, J. C. & Vassal, L. (1982). The chemistry of Sousa, M. J. C. F. (1993). Plant rennet substitute from flowers flavour and texture generation in cheese. Food Chem., 9, of Cynara cardunculus. M.Sc. thesis, National University of
Sousa, M. J. & Malcata, F. X. (1996). Effect of plant and animal rennets on microbiological, chemical and biochemical characteristics of ovine cheese. J. Agric. Fd Chem. (in press). Vieira de Sa, F. & Barbosa, M. (1970). Experiences de fabri- cation de fromage en employant un enzyme coagulant
extrait du chardon (Cynuru cardunculus). Page IF: 294 in Proc. 18th Congr. Int. Luiterie, Sydney, Australia.
Vieira de Sri, F. & Barbosa, M. (1972). Cheese-making experiments with a vegetable rennet from cardo (Cynuru cardunculus L.). J. Dairy Res., 39, 335-343.