Developing a tool to help retailers better
position themselves in the food retail market
Deloitte - WeShare - Serviços de Gestão, S.A
Francisca Leão Cerquinho Ribeiro da Fonseca
Supervisor Vera Miguéis Company Supervisor
António Mota Lopes
Faculdade de Engenharia da Universidade do Porto, Mestrado Integrado em Engenharia Informática e Computação
Developing a tool to help retailers better
position themselves in the food retail market
Francisca Leão Cerquinho Ribeiro da
Fonseca
Mestrado Integrado em Engenharia Informática e
Computação
Abstract
Retailers have always tried to identify the products competitors offer, define the prices to charge for a product and properly define their market positioning. Although software that collect competitors’ market prices and that present solutions to optimize prices already exist, none are capable of ensuring an entire online footprint of a particular product that has direct, indirect and location-specific competitors.
The aim of this thesis is the development of a rich data source, with permanently updated and reliable data, based on the online platforms that accompany the price changes of the products sold by several retailers. This project is supported by software as a service (SaaS) and has three main objectives: (1) to develop a search bot to collect products information from different online stores, (2) to match similar competitor products and develop a database and (3) to develop a graphical interface from data collected from online platforms, that will support decision making in sales, marketing and operations.
The solution was developed using Amazon Web Services (AWS) technologies, which provide a set of fully managed services used to build and run serverless applications. Through this service, it was possible to create a scalable, reliable, and flexible product, since AWS manages time and space. The architecture of the project has two main layers: data ingestion and data transformation. This last layer is divided into three processes: the creation of a database, cleaning, and standardization of data, and creation of the product match algorithm. For the data collection layer, two techniques were used: web-scraping and web crawler. To match the products, a comparison was made between the image and string attributes, such as name, brand, and packaging content. For image comparison, a pixel-by-pixel calculation was used to determine the differences between two input images. To assess the similarity between string attributes, two approaches were studied: one that uses word embeddings and another that uses the Levenshtein Distance. Furthermore, two approaches to compare the string attributes were used: the first calculates the similarity of the values of the string attributes individually and sums the similarities returned and the second combines the value of the three string attributes into a single string separated by a space. After being analyzed and tested, comparing the string attributes together and using Levenshtein distance to assess similarity proved to be the best approach. Through the product matching algorithm, it was possible to build a database with all the existing products from different retailer’s online stores. For each product, the information about who has it is stored in that same database. With this information, it was possible to create a dashboard that enables retailers to analyze their competitors.
Summing up, this project enabled to create a solution that can provide retail com-panies with the information they need to take real-time action for competitive excellence. The result of the project is a dashboard to support decision making, namely pricing.
Resumo
Os retalhistas precisam, diariamente, de identificar os produtos que os concorrentes oferecem, definir preços a serem cobrados por um produto e definir adequadamente o seu posicionamento no mercado. Apesar de já existirem alguns software que recolhem os preços praticados e que oferecem soluções para optimizar os preços, não existe nenhum capaz de assegurar toda a oferta online de um determinado produto.
O objetivo desta tese é o desenvolvimento de uma fonte de dados rica, atualizada e confiável, com base nas plataformas online que acompanham as variações de preço dos produtos vendidos por vários retalhistas. Este projeto é suportado por um software as a service (SaaS), tendo três objetivos: (1) desenvolver um bot que faça a recolha automática de detalhes de produtos de diferentes lojas online, (2) fazer o match entre produtos semel-hantes da concorrência e construir uma base de dados e (3) desenvolver um dashboard de suporte a tomada de decisões em vendas, marketing, atendimento ao cliente e operações.
A solução foi desenvolvida usando tecnologias da Amazon Web Services (AWS), que fornece um conjunto de serviços para criar e executar aplicativos sem servidor, per-mitindo criar um produto escalável, confiável e flexível. A arquitetura do projeto possui duas camadas: recolha e transformação de dados. Esta última camada é dividida em três processos: criação de uma base de dados, limpeza e padronização de dados e criação do algo-ritmo product match. Para recolher os dados foram utilizadas duas técnicas: web-scrapping e web crawler. Para fazer a correspondência entre os produtos, foi feita uma comparação entre as imagens e atributos de string, como nome, marca e conteúdo da embalagem. Para a comparação de imagens, foi usado um cálculo pixel por pixel para determinar as difer-enças entre duas imagens. Para avaliar a semelhança entre os atributos das strings foram estudadas duas abordagens: uma que usa word embeddings e outra que usa a distância de Levenshtein. Além disso, foram utilizadas duas formas de comparar os atributos de string : a primeira calcula a similaridade dos valores dos atributos individualmente e soma as semelhanças retornadas e a segunda combina o valor dos três atributos numa única string separada por um espaço. Após ser analisado, foi provado que a melhor abordagem é aquela que compara os atributos de string numa única string e usa a distância de Lev-enshtein para avaliar a similaridade. Através do algoritmo de product match, foi possível criar uma base de dados com todos os produtos existentes nas diferentes lojas online. Para cada produto, as informações sobre quem o possui são armazenadas na mesma base de dados. Deste modo, foi possível criar um dashboard que permite analisar a concorrência.
Resumindo, este projeto permitiu criar uma solução que fornece às empresas de retalho alimentar as informações necessárias para que realizem ações em tempo real, ob-tendo excelência competitiva. O resultado do produto é um dashboard atrativo que apoia na tomada de decisão, nomeadamente o preço.
Acknowledgements
I would like to thank my advisors, Professor Vera Miguéis for the constant dedi-cation, persistence, and demand and António Mota Lopes for the guidance and sharing of knowledge in the development of the project.
To my parents for the education they gave to me and for having always believed in me and my abilities.
To my siblings and boyfriend for their support. My friends who accompanied, supported, taught and strengthened me during my academic career, namely Mariana Silva, Xavier Fontes, and Luís Saraiva. A special thanks to Mariana Silva for all the support and friendship she provided me during my academic career.
In addition, I would like to thank Cláudia Pimenta, whom I met at Deloitte but who has always supported me and contributed in large part to my personal and professional growth within the company.
Finally, I could not fail to mention my grandmother who, despite not having been present in recent academic years, has always accompanied me during my student life and has always contributed to my growth.
“I can accept failure, everyone fails at something. But I can’t accept not trying.”
Contents
1 Introduction 3
1.1 Context . . . 3
1.2 Motivation . . . 5
1.3 Problem and Specific Goals . . . 6
1.4 Report Structure . . . 7
2 Background 9 2.1 Software as a Service (SaaS) . . . 9
2.2 Web scraping vs Web crawling . . . 9
2.2.1 Web Scraping . . . 10
2.2.2 Web Crawlers . . . 11
2.2.3 The difference between web scraping and web crawling . . . 11
2.3 Serverless Applications . . . 13
2.4 Price Optimization in Retail . . . 14
2.5 Product Match . . . 14
2.6 Summary . . . 15
3 State of the Art 17 3.1 Price Comparison Platforms . . . 17
3.1.1 Price Grabber . . . 18
3.1.2 KuantoKusta . . . 19
3.2 Product match for building a price comparison platform . . . 20
3.2.1 Product Matching based on feature matching . . . 20
3.2.2 Product Match based on binary classification . . . 21
3.3 Competitor Analysis tools . . . 22
3.4 Conclusion . . . 24
4 Implementation 25 4.1 Software Overview . . . 25
CONTENTS
4.2.1 Data Ingestion Process . . . 27
4.2.2 Data Transformation Process . . . 30
4.2.2.1 Database . . . 30
4.2.2.2 Data cleaning and standardization . . . 31
4.2.2.3 Product Match . . . 34
4.3 Conclusions . . . 39
5 Results 41 5.1 Exploratory Data Analysis . . . 41
5.2 Product Match Algorithm . . . 42
5.2.1 Exploratory Analysis of Ground Truth Data . . . 43
5.2.2 Match between images . . . 44
5.2.3 Match between string attributes . . . 44
5.2.3.1 First Approach - Comparing string attributes individually and using Word Embedding to evaluate the similarity . . . 45
5.2.3.2 Second Approach - Comparing string attributes together and using Word Embedding to evaluate the similarity . . . 46
5.2.3.3 Third Approach - Comparing string attributes individually and using Levenshtein Distance to evaluate the similarity . 47 5.2.3.4 Fourth Approach - Comparing string attributes together and using Levenshtein Distance to evaluate the similarity . 48 5.2.3.5 Comparison between the different approaches used . . . 49
5.3 Dashboards . . . 50 5.4 Conclusions . . . 52 6 Conclusion 53 6.1 Main Difficulties . . . 54 6.2 Main Contributions . . . 55 6.3 Future Work . . . 55
A Price Grabber Main Page 57
B Data Relationship Model in PowerBI 59
References 62
List of Figures
1.1 Portugal Market Share . . . 4
2.1 Architecture of a standard Web Scraping . . . 10
2.2 High-level architecture of a standard Web crawler . . . 11
2.3 Schematic web scraping procedure . . . 12
2.4 Traditional vs Serverless Architecture . . . 13
3.1 pricegrabber.com . . . 18
3.2 kuantokusta.pt . . . 19
3.3 Search results from KuantoKusta . . . 19
3.4 Classification: True vs. False and Positive vs. Negative . . . 22
3.5 Pricing Tracking Tools . . . 23
4.1 Solution Architecture . . . 26
4.2 Example of robots.txt file . . . 27
4.3 Find XHRs requests using Chrome developer tools . . . 28
4.4 Proxy connection . . . 28
4.5 Ingest and Parse Process - Step Function . . . 29
4.6 Database . . . 30
4.7 UML Diagram . . . 31
4.8 An example of six products sold on two platforms. The columns refer to their attributes and their values are listed under them. . . 32
4.9 An example of the transformation of the same product sold by different retailers . . . 33
4.10 An example of a product image transformation process. On the left the original image is represented and on the right the result of the image after the transformation. . . 34
4.11 An example of images referring to the same product sold by different retailers 35 4.12 Cosine similarity for similarity between words . . . 37
4.13 Comparison between strings attributes - First Approach . . . 38
LIST OF FIGURES
5.1 Attribute evaluation for those matching products . . . 43
5.2 Comparing cut boundaries or not for image matching . . . 44
5.3 Comparison between string attributes individually and use of Word Embed-ding to evaluate the similarity. On the top without image matching, and on the bottom with the match between images. . . 45
5.4 Comparison between string attributes together and use of Word Embedding to evaluate the similarity. On the top without image matching, and on the bottom with the match between images. . . 46
5.5 Comparison between string attributes individually and use of Levenshtein Distance to evaluate the similarity. On the top without image matching, and on the bottom with the match between images. . . 47
5.6 Comparison between string attributes together and use of Levenshtein Dis-tance to evaluate the similarity. On the top without image matching, and on the bottom with the match between images. . . 48
5.7 An example of misclassified products. . . 49
5.8 Dashboard overview of Market Products . . . 51
5.9 Dashboard overview of Market Categories . . . 51
5.10 Dashboard overview of Market Prices . . . 52
List of Tables
2.1 Distinction between web scraping and web crawling . . . 12
5.1 Number of Different Products by Retailer . . . 41
5.2 Product attributes of each retailer . . . 42
5.3 Exploratory Data Analysis . . . 43
Abbreviations
API Application Programming Interface AWS Amazon Web Services
CA Competitor Analysis CSS Cascading Style Sheets
DTTL Deloitte Touche Tohmatsu Limited EAN European Article Number
GTIN Global Trade Item Number HTML HyperText Markup Language HTTP Hypertext Transfer Protocol IP Internet Protocol
JSON JavaScript Object Notation NLP Natural Language Processing SaaS Software as a Service
TF-IDF Term Frequency – Inverse Document Frequency URL Uniform Resource Locator
VM Virtual Machine WEB Word Wide Web XHR XMLHttpRequest
Chapter 1
Introduction
This chapter provides an introduction to this dissertation by defining its scope, motivations and goals. Section 1.1 outlines the context of the problem and the environment in which this is developed. Section 1.2 defines the main forces driving this thesis. Section 1.3 explains the problem in detail and describes the objectives. Lastly, Section 1.4 explains the composition of the rest of the document.
1.1
Context
Retail is the process of selling consumer goods or services to customers through multiple channels of distribution aiming for customer consumption rather than re-selling. The retail industry is a broad industry, with a myriad of different types of companies falling under this industry category. Food retailing is an activity of enormous economic significance which, in recent years, has been exposed to significant structural changes in response to a combination of economic forces, consumer trends, competitive initiatives, technological developments and environmental regulations [1]. It is a constantly growing sector, namely through new competitive channels, formats and outlets.
In the past, the small food trade guaranteed the supply of the entire population. The retail market was characterized by having a large number of small establishments, and the food distribution network was characterized by the existence of a large number of small distributors, being covered in a restricted distribution area [2].
However, in the 1980s, food distribution in Portugal began to suffer some changes due to the increase in large distribution. Consumers started looking for large stores in which they began to enjoy a wide variety of products (food and non-food), in one space. Allied to the size of these stores, this period was also characterized by the growing extension of economic groups reinforcing negotiating capacity of these companies with their suppliers. As a result of this situation, large quantities of products, including food products, were sold at lower prices to consumers, due to the favorable conditions obtained with the food chains and their suppliers [2].
In the second half of the 1980s, Portugal’s entry in the European Union brought a significantly positive impact for the food sector due to the liberalization of markets and the sharp growth in imports of more sophisticated food products [2].
Currently, and according to 2018 data, Sonae MC leads the food retail industry in Portugal, with the most diversified format portfolio. Sonae MC is the leader in market share, diversity of formats, location in stores, electronic commerce for food retail and
Chapter 1. 1. Introduction
finally price positioning, characterized by a strong promotional action. The figure below demonstrates the growth of the retail industry in Portugal, between 2017 and 2018.
Figure 1.1: Portugal Market Share Source: Planet Retail RNG as of March 2019.
The growth and distribution of supermarkets depends on a number of factors such as the consumption habits of the local population, state of the economy, and central and local government regulations. In the past, the consumer would only have access to small gro-cery stores and markets, however throughout the years, many other channels have emerged, as hypermarkets, or the rapidly growing e-commerce channel. Hypermarkets, for example Continente, are characterized by having large store sizes, which enable the existence of a great diversity of products and brands, in an organized and appealing space. Hypermarkets are also frequently characterized by great promotional offers and other associated services, such as parking and loyalty cards, and are normally visited by customers in a biweekly or monthly basis. Supermarkets, such as Continente Bom dia and Pingo Doce, have less product diversity than hypermarkets, as they are usually smaller establishments. The ex-istence of affordable prices, combined with the location and convenience factor, determine that supermarkets are normally associated with daily or weekly purchases. The discount format, like MiniPreço, corresponds to a type of establishment dedicated to customers who consider price as driving factor when shopping. They are characterized by spaces that are less appealing and less organized, due to the existence of a fewer diversity of products and a great investment in white label products with more accessible prices.
However, in recent years, there is another format that has been growing, the online format also known as e-commerce. In this channel the goods are therefore presented in Internet stores. Customers generally place their orders through electronic checkout or can use traditional email or communication methods (for example, mail, phone and fax) to do so. There are three key dimensions that affect consumer satisfaction with online shopping activities and subsequent purchase: user experience (for example, the quality of broadband connection and website design), transaction (for instance, purchase price, convenience, warranty, entertainment and evaluation) and service (such as, order processing, delivery and after-sales service). User experience is closely linked to the general satisfaction, as it acts as a motivating force for the consumer to continue browsing, searching and buying on a specific website. Meanwhile, the quality of the transaction process also plays a crucial role, as convenience, value and security are essential requirements to the online consumer. Finally, the level of compliance determines consumer confidence in online transactions and can also help provide greater convenience and value for electronic buyers.
More customers now expect a seamless, personalized shopping experience. Whether they are buying in person or online, consumers search for a quick and easy experience, something that is being facilitated with retail technologies. In an ever-changing competi-tive environment, grocers and online food retailers are constantly innovating and utilizing
Chapter 1. 1. Introduction
technology to ease and improve the consumer shopping experience. The increasing volume of rapidly expanding data is forcing online retailers to introduce data analytic platforms, as a means to gain a transparent overview of the market. Companies need to spend less time analyzing data and more time gaining meaningful insights from it.
Advanced Analytics, relates to the science of forecasting future trends based on the study of present-day and past data. Today, inexorably, it is making inroads into the retail sector. Grocery retailers and supermarkets are increasingly turning to this data-driven science to help them get a leg up over the competition. Additionally, Advanced Analytics is becoming one of the key drivers of profit, as it represents a portfolio of tools, techniques, and organizational capabilities that can be applied to specific decisions across a wide range of business concerns. Advanced Analytics can help retailers improve the way they analyze, set, and deliver pricing in a sustainable and predictable manner. With a broad data set, analytics can allow retailers to derive valuable insights by measuring differences in demand across customer segments, identifying key value items, clustering stores into zones, and assessing shopping behavior across channels. These findings allow retailers to develop a tactical framework to set prices while accounting for distinctions across customers, channels, competitors, and categories [3].
Companies need a comprehensive and structured approach to optimize their cate-gory planning — one that combines data-based insights across customers, competitors, pricing, promotions and channels with Advanced Analytics for analysing and scenario planning. Such an approach can identify growth opportunities in the category, inform negotiation strategies, and, ultimately, enhance relationships with customers, improving both margins and sales. Analytics software is a class of tools that leverages data to create context-rich, actionable insight. Business analytics is focuses on the questions – why is this happening, what if the trends continue, what will happen next (predict), and what is the best that can happen (optimize).
In the new normal of retailing, where the consumer is value-conscious, always-on, mobile-enabled, socially active and channel-agnostic, retailers are finding it difficult to differentiate themselves based on traditional factors such as price, promotions, location and assortment alone. On the other hand, with consumers themselves reliant on technology – personal computers, tablets, mobile and smart phones, the Internet, and social media – they are leaving behind digital breadcrumbs and displaying their “digital body language”. Combined with how consumers interact with retailers across their own channels, loyalty programs, promotions and customer service, this mass of consumer data offers retailers their best chance yet to really know their customer [4].
Knowing the customer better than the competition and having the ability to orches-trate business decisions at close to real-time speed is the new retail competitive battlefield and business analytics can be one of the strongest weapons in a retailer’s arsenal. Business analytics will only evolve further into a strategic capability that sits at the intersection of customer preferences, business strategy, and business processes. Insights will be deeply embedded across a retailer’s functional value chain, giving it both the ability to be in-vestigative and predictive (strategic), as well as the adeptness to be efficient and agile (operational) [4].
1.2
Motivation
The retail sector is constantly changing and retailers feel compelled to increase the efficiency in operations, revenues, market shares, as well as offering a consistent and integrated omnichannel experience. The battle for consumers’ grocery spend is more
in-Chapter 1. 1. Introduction
tense than ever, with new store concepts, pricing strategies, delivery formats and market volatility, putting retailers under pressure to deliver increased value with limited costs.
Nowadays, retailers have the necessary services, such as price comparison platforms, required to analyse the price at which a specific product X is being sold at competitors’ stores. Despite this, there are two significant limitations regarding these services’ func-tionalities. To begin with, the first limitation relates to their inability to adapt, added to the complexity and re-occurrence of maintenance required to ensue their functional-ity. In addition, it is almost impossible to build an effective price strategy by means of price comparison engines, since the analysis they provide is neither of a good quality nor complete.
Despite the existence of the services mentioned above, there is currently no software in the Portuguese food industry capable of providing near real-time information on what is happening in the market. Retailers need to be one step ahead of their competitors and with the constant growth of technology, it is necessary to develop a software that augments management efficiency and effectiveness.
This thesis focuses on providing retail companies with the crucial information needed to take action in real-time, for competitive changes in any frequency required, with a focus on the online retail channel. More specifically, this project aims to develop a technology capable of identifying similar or equivalent products available in retailers web-sites and construct a database with relevant data characterizing those products, namely their price. For this, the biggest difficulty lies in the handling of highly heterogeneous product descriptions and a shortfall in standards for clear product identification (GTIN). A well-designed software as a service (SaaS) will enable a large improvement over the current methods of managing food retail and will allow quick responses to high-level business decisions. Furthermore, it will improve staff efficiency, freeing staff to concentrate on their primary job functions, rather than repetitive data entry tasks.
The project’s development will be undertaken at Deloitte Consultores S.A., a Por-tuguese member firm of DTTL which provides audit & assurance, consulting, financial advisory, risk advisory, and tax.
1.3
Problem and Specific Goals
Price is one of the dimensions that affects companies in meeting objectives, always trying to answer questions such as: what is the pricing strategy that should be adopted?, how does the location influence prices?, what is the composition of the final price (with-/without discounts, with(with-/without associated services)?, what is the trend of the price of a product in a certain period?
These issues pose enormous challenges to the companies in this market, namely with the increasing use of digital channels by consumers to compare prices in the market, identifying promotions/campaigns, or even identifying trends.
This project will seek to support the definition of the business strategy and aid de-cision makers in defining prices and designing promotional strategies, using an application based on different technologies that enables the capture of, near real-time, information on price and product ranges of competitors in the food-retail market. In addition to allowing the monitoring of direct and indirect competition in the food retail market through on-line channels, retailers will be able to have a better view and understanding of the global market.
Chapter 1. 1. Introduction
Thus, this project has three main objectives:
1. To develop a search bot to collect details of retail products from different online stores;
2. To match similar competitor products and develop a database;
3. To develop a data interface from data collected from online platforms, that will support decision making in sales, marketing, customer service, and operations.
Essentially, the objective is to search and collect, automatically, food-retail product data from Portuguese online stores and implement a use case of Product Match that is transversal to any retail company in the sector.
From a user’s point of view, the output of the project should be an iterative dash-board that allows the retailer to understand their market position: analyzing prices and category composition, coverage of assortments and categories, comparison of promotions and framing in the product portfolio. This aims to decrease the time needed to understand competitors’ pricing strategies, improve efficiency in pricing by product and store type and increase the effectiveness of promotion planning. This dashboard allows the retailer to ensure parity with competitors by carefully analyzing the data collected to discover and address trends that may soon help or hurt the business.
1.4
Report Structure
This thesis is, then, developed in the following manner: Chapter 2 introduces the concepts that support this report. Chapter 3 presents an inspection of the current state of the art associated with the development of similar projects. Chapter 4 describes the entire solution developed for the problem mentioned above. Chapter 5 describes the strategy that was used to validate the work developed and the results obtained. At last, Chapter 6 reflects the results of the project, its goals and future development.
Chapter 2
Background
This chapter introduces significant concepts that will support the comprehension of this report. Section 2.1 describes what is SaaS. Section 2.2 explains the most common methods to extract data from the internet. Section 2.3 describes the potential of a serverless when associated with Saas. Section 2.4 describes the applicability of price optimization in retail. Section 2.5 introduces the product match concept. Finally, Section 2.6 summarizes this chapter.
2.1
Software as a Service (SaaS)
SaaS is a software distribution model in which a third-party provider hosts ap-plications and makes them available to customers over the Internet. Unlike traditional packaged applications that users install on their computers or servers, the SaaS vendor owns the software and runs it on computers in its data center [5].
Traditional software is conventionally sold as a perpetual license with an up-front cost (and an optional ongoing support fee). In contrast, SaaS providers generally price applications using a subscription fee, most commonly a monthly fee or an annual fee. Consequently, the initial setup cost for SaaS is typically lower than the equivalent enterprise software.
SaaS guarantees easier, speedier and cheaper implementations. The fact that the software’s upgrades are automatically pursued in a seamless manner (as there is no need to customize the software) ensures that users always access the most recent version of the program, without having to re-install it. In traditional packaged software solutions, this automatic upgrade is not possible, whereas in SaaS, the vendors just push the upgrades and updates out to the customer base.
2.2
Web scraping vs Web crawling
The process of creating a SaaS goes through different phases, of which the starting phase consists of data collection. In this phase, data is collected from several different sources, in the best quality manner. Without data collection, no transformation can occur, leading data to be one of the crucial resources that today’s businesses have. Despite this, many still lack to give data the importance it should have.
There are many ways to gather information or data from the internet. Of those many ways, two of the most popular ones are web crawling (or data crawling) and data
Chapter 2. 2. Background
scraping (or web scraping). While both web crawling and data scraping are essential meth-ods of retrieving data, the information needed and the processes involved in the respective methods differ in several ways.
Web scraping and crawling services can come in handy for retail industry at this juncture of technological growth in the retail space. These services provide the ability to extract data from any website and transform it into useful informational patterns and statistics. These techniques offer businesses competitive advantage of key industry trends that company needs to follow. Web scraping and crawling services hold significance in monitoring the physical market stores as well as the e-commerce variants. Web scraping services help in collecting retail data from different websites and use the collected data to perform market research and data analysis [6].
Web crawling combined with data mining helps retailers in extracting key trends and following websites used by competitors. Using these techniques, businesses are gaining wisdom from the strategies of their competitors, which help them to predict the future trends. Scrape retail data aid companies to gain visibility across purchasing markets, com-petitors and consumers, which eases in keeping pace with demand, even if it shifts quickly. Collecting and analyzing retail data aids in following latest retail industry trends. It helps in monitoring the competition and discovering major insights to enhance market share.
In order to understand the difference between the two methods, the subsection Section 2.2.1 and Section 2.2.2 explain each method, and finally the Section 2.2.3 explains the differences between them.
2.2.1 Web Scraping
Web scraping is a relatively new method for collecting online data. The term de-scribes the automated process of accessing websites and downloading specific information, such as prices. Allowing the creation of large, customised data sets at low costs, web scraping is already applied for scientific and commercial purposes in many areas, such as marketing, industrial organisations, or inflation measurement. With the increasing number of prices published online and as online grocery retail is slowly gaining market share in many parts of the world, web scraping may be a promising alternative to get data for food price research [7]. The figure below gives a glance at the web scraping architecture.
Figure 2.1: Architecture of a standard Web Scraping Source: Pinterest - softprodigy.com [8]
Chapter 2. 2. Background
2.2.2 Web Crawlers
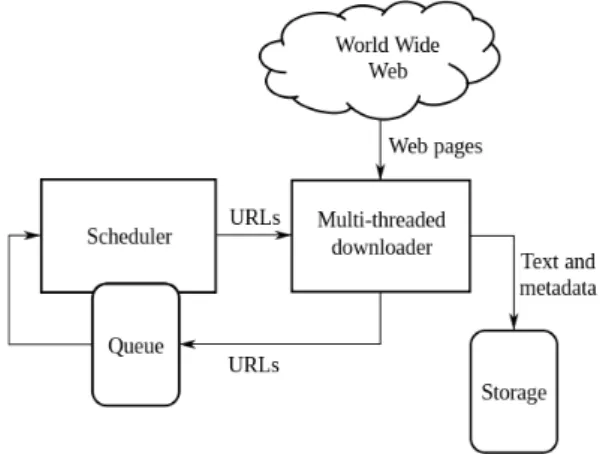
On the other hand, Web crawling means accessing web content and indexing it via hyperlinks, thus, only the URL but no specific information is extracted. Instead, the full content is made available through the hyperlink but is generally not archived.
A Web crawler, sometimes called a spider or spiderbot and often shortened to crawler, is an Internet bot that systematically browses the World Wide Web, typically for the purpose of Web indexing (web spidering) [9]. They are called “web crawlers” because crawling is the technical term for automatically accessing a website and obtaining data via a software program.
These bots are almost always operated by search engines. The application of a search algorithm to the data collected by web crawlers enables search engines to provide relevant links in response to user search queries, by generating the list of webpages that show up after a user types a search into Google or another search engine.
Web crawlers are a central part of search engines, and details on their algorithms and architecture are kept as business secrets. When crawler designs are published, there is often an important lack of detail that prevents others from reproducing the work. There are also emerging concerns about “search engine spamming”, which prevents major search engines from publishing their ranking algorithms. The graph below illustrates the archi-tecture of a web crawler.
Figure 2.2: High-level architecture of a standard Web crawler Source: bcc.ime.usp.br
2.2.3 The difference between web scraping and web crawling
All things considered, web scraping involves a script that accesses the websites hosting the data, finds the relevant, previously defined elements and then downloads, and stores them in structured data sets.
Chapter 2. 2. Background
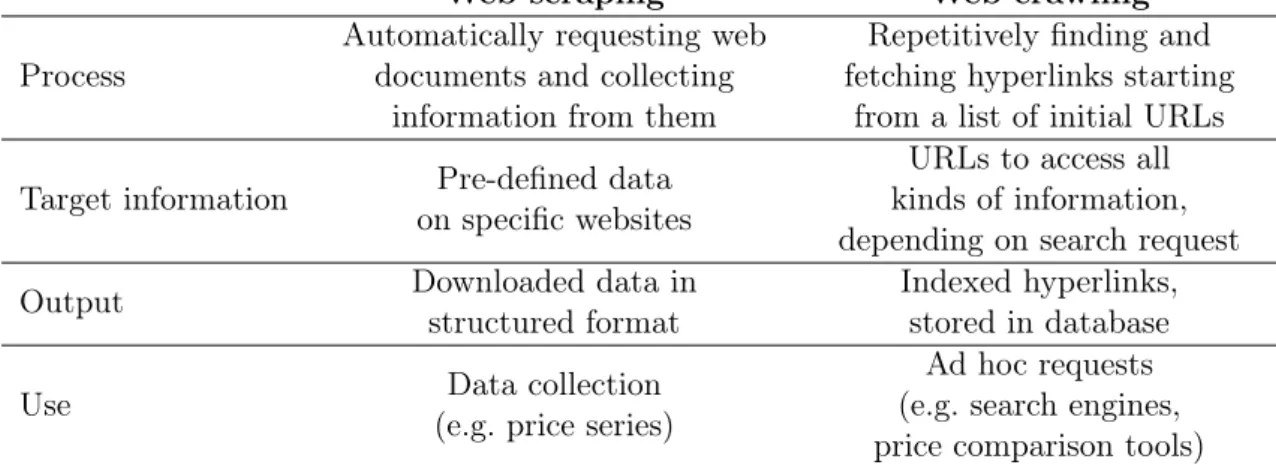
Table 5.3 shows the main differences between Web Scraping and Web Crawling.
Web scraping Web crawling
Process
Automatically requesting web documents and collecting
information from them
Repetitively finding and fetching hyperlinks starting
from a list of initial URLs Target information Pre-defined data
on specific websites
URLs to access all kinds of information, depending on search request
Output Downloaded data in
structured format
Indexed hyperlinks, stored in database
Use Data collection
(e.g. price series)
Ad hoc requests (e.g. search engines, price comparison tools) Table 2.1: Distinction between web scraping and web crawling
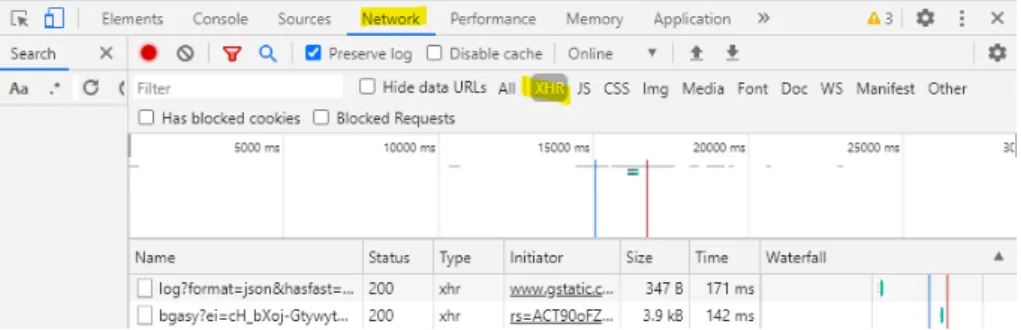
Figure 2.3 gives a schematic overview of the several steps required to build a web scraper. Technically, the script can be coded in most of the common programming lan-guages, like python. Although such code elements are certainly helpful as building blocks, there is always a need to adapt the script to the targeted website, depending on how the website is set up, the page structure, authentication requirements, etc., because many web-sites use reactive elements, so simple HTTP requests cannot be used. This is especially relevant in large online food retail websites mostly have online catalogues but no applica-tion programming interface to access their food prices directly. Therefore, the script needs to navigate a “real” web browser and “click” through the website [7].
Figure 2.3: Schematic web scraping procedure Source: Representation of Judith Hillen [7]
Chapter 2. 2. Background
2.3
Serverless Applications
Software as a Service has been transformed significantly with serverless computing. This is a boom in a continually shifting landscape of customers and load profiles, that essentially virtualizes runtime and operational specifics through a third-party provider. With serverless SaaS, developers can focus on their business logic and attain faster time-to-market [10].
Serverless is an application design and deployment paradigm that is event-driven and incorporates scalable cloud services as computing resources from a third-party provider. With serverless computing, developers can drop in code, create backend applications and event handling routines, and process data without concerns about servers, virtual machines (VMs), or the underlying computing resources which are maintained by the provider.
Traditionally, physical servers were prevailing, where with just a single core server, multiple physical devices were connected with the main database system. The server ac-tually worked as a connecting link between those devices and the database. Serverless application security can be greater than that of a traditional web application due to the ability and leading practice of limiting access to resources on a function-by-function level. Given the complex nature of this task, permissions are most successfully implemented in serverless applications when considered as part of the design of the application and built in from the start. Serverless architectures offer significantly reduced complexity and en-gineering lead time. Service providers follow a pay-as-you-go model that accounts for the actual amount of resources consumed by the customers’ applications without associating costs to idle, down-time.
Figure 2.4 is a diagram of a traditional model that relies on configured cloud servers compared to a serverless model.
Figure 2.4: Traditional vs Serverless Architecture Source: zetavisual.com - cloud-architecture [11]
Serverless has wide applicability in retail, yet, its adoption must be incremental and well thought through. The first few use cases should be smaller and simpler processing, before aiming to target complex functions (such as with workflows and state management). Event-driven and pipeline-based architecture also lends itself well to the decoupling of processing and makes it easier to implement serverless functions [12].
Chapter 2. 2. Background
2.4
Price Optimization in Retail
Pricing is an important decision-making aspect after the product is manufactured. Price determines the future of the product, acceptability of the product to the customers and ultimately the return and profitability from the product. It is a tool of competition [13]. Generally, pricing strategies include the following five strategies:
1. Cost-plus pricing - imply calculating company costs and adding a mark-up. 2. Competitive pricing - setting a price based on what the competition charges. 3. Value-based pricing - setting a price based on how much the customer believes
the company is worth.
4. Price skimming - setting a high price and lowering it as the market evolves. 5. Penetration pricing - setting a low price to enter a competitive market and raising
it later.
Particularly regarding competitive pricing, the business may sell its products at a price above or below such benchmark. Setting a price above the benchmark will result in higher profit per unit but might result in less units sold as customers would prefer products with lower prices. On the other hand, setting a price below the benchmark might result in more units sold but will cause less profit per unit [14].
The main dilemma for retailers when trying to accurately price their products is when they attempt to tackle this question: What is a fair price for this item considering the market, the current time of year, demand, and the product’s attributes? The fact that these factors are constantly changing makes this question to become increasingly difficult to answer.
Pricing optimization software is suitable for businesses of all sizes, from an online clothing store to a supermarket chain. For this, a whole set of complex data is used. This data is obtained as a result of monitoring the price range in the market, the range of products available and pricing strategies conducted by competitors. For the success of this process, it is necessary to collect data from competitors, such as prices, discounts, and promotions. Successful price analysis and its strategy depend on the quality of the information collected. The more data sources a retailer uses to set prices, the more accurate they will become [15].
When implemented correctly, competitive based optimization solutions are power-ful tools that offer retailers a competitive advantage, not only by having a tool capable of setting optimal prices and promotional products that achieve merchandising and marketing goals, but also by ensuring that the entire catalog is sold [15].
2.5
Product Match
In order to develop competitive based optimization approaches, companies need to match the products offered by the competitors with the products company offers. This match is a very difficult task. Retailers use product matching, which is basically a mix of algorithmic and manual techniques to recognize and match identical products from different sources. Many retailers try to do it themselves, but since it takes up so much time and resources, it can distract them from their core businesses. This is how the Product Match
Chapter 2. 2. Background
concept was born, which makes it possible to match the same product as sold by multiple retailers.
Product matching is a process in which one is given two products with all available data-points from each source and is able to determine if these products are identical. Thus, it aims to develop an algorithm that decides whether two product descriptions from different stores describe the same product or not.
Product matching can be done manually or automatically. In manual product matching, a team goes through many websites and tries to find a perfect match for the wanted product. When performing this task, the team does not only check product names, but also technical specs and product images in order to ensure that a match is indeed a proper one. Contrarily, automated product matching (automatch) is a continual automated product matching process based on an algorithm [16].
In the development of this project, the Product Match concept is used to assist the retailer in market analysis, by allowing for the easy comparison of offers held by different vendors. The development of the Product Match algorithm is done before using Advance Analytics. It is necessary to make a match between competitor products and original products, to make it possible to study and analyze the data resulting from the Product Match algorithm.
2.6
Summary
Retailers that make the transition to SaaS can look forward to transforming every aspect of their organization for the better, from the customer experiences they provide, to how their employees work, to the underlying business processes which support their operations. SaaS is a perfect solution, because the applications would connect to other components easily, thus augmenting the systems at little cost.
Furthermore, with the help of web scraping experts, companies can increase the chances to collect the necessary data to do better business, sales, inventory and marketing decisions. Posteriorly, analyzing web data helps companies derive insights as to how to increase traffic and sales, manifest ideal conversation rates, and ultimately, lead to closure in sales. Including data matching and record linkage tools in companies’ data quality management framework is one proven way to minimize the negative impact of bad data. Data matching tools automate the process of segmenting the raw data through multiple layers, profiling, cleansing, deduplicating, and merging it for accurate insights through analytics.
Chapter 3
State of the Art
This chapter describes the state of the art of the project. Firstly, section 3.1 intro-duces price comparison platforms and it current state of art. Secondly, Section 3.2 describe the current state of the art of the product match concept. Thirdly, Section 3.3 describes the power of advanced analytics and price monitoring tools and its current state of art. Finally, Section 3.4 summarizes this chapter.
3.1
Price Comparison Platforms
In today’s hyper-competitive e-commerce scenario, companies grab every opportu-nity to attract potential customers. Price comparison websites are one of the opportunities e-retailers leverage to attract customers. A few years back, a typical online buyer looking to buy apparel or an electronic gadget would scour the web to compare prices from differ-ent e-commerce sites and look for the best deals available. Prices of the same commodity would differ over different sites which in turn prompted sites to monitor price changes in real-time using analysts.
Price comparators are tools that enable users on the internet to identify different product prices practiced by different e-commerce stores. By doing so, these comparators help consumers through their purchase journey, allowing them to find the best deals and offers [17].
On the consumer perspective, price comparison websites work in a similar manner as a typical search engine. The main difference held in price comparison websites is the fact that they will show products side-by-side, and additionally, display how these products stack up against one another in terms of pricing. In contrast, typical search engines gen-erally serve up straightforward results without sorting these by price or comparing them to other products. On the business side, each price comparison site is a little different. Es-sentially, companies pay a certain fee, submit the required content (product photos, URL, price, description, etc.), and list their products. Companies products will then show up for relevant searches along with comparable products, ranked by price. These platforms are useful to inform the different pricing strategies applied in the market, which is key for businesses. Companies do not want to be in an uncompetitive price position, charg-ing much higher prices than their competition, for similar products [18]. Price comparison mechanisms help retailers to increase brand visibility, allowing them the ability to compare different prices and promotional activities to those of competitors, while also enabling them to identify how popular their products are versus their competition.
Chapter 3. 3. State of the Art
of different Price Comparators [18] [17] [19], PriceGrabber [20], and KuantoKusta [21] are described bellow.
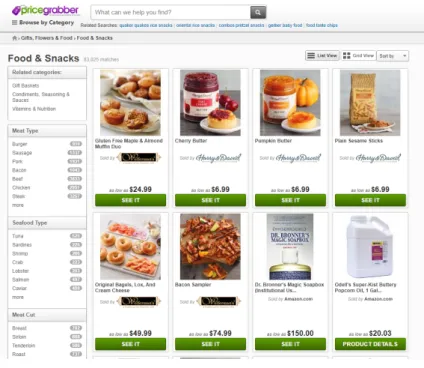
3.1.1 Price Grabber
Figure 3.1: pricegrabber.com
PriceGrabber is a leading distributed e-commerce platform and shopping site that connects millions of shoppers each month with thousands of merchants. Consumers use PriceGrabber.com to shop and compare products prices from different merchants. In addi-tion to being a comparison shopping site, PriceGrabber is a leading distributed e-commerce platform with a network of over 400 digital publisher partners. PriceGrabber is a unit of CPL Holdings LLC and headquartered in Los Angeles, CA with operations across North America and in the United Kingdom [22].
Price Grabber presents on the main page, with a top-down approach (Appendix A): a bar at the top with small menus of auxiliary information to the entire site, a search bar, the categories of products and services, two advertising banners, most popular categories and, in the bottom, contact information, support and more.
The user can start looking for a product through the search bar, categories, or also use the advertising banners that take him directly to the product’s shopkeeper, without the opportunity to make any kind of comparison. However, if the search is done by normal means, that is, through the search bar or the categories, the user will be presented with an interface with a list of possible products to compare. The difference between PriceGrabber and KuantoKusta, is that it adds a way of comparison, where the user can choose up to four products from the presented list to compare them side by side. In addition to the list of products, each product on the list features has a button to view the product directly in the store, or compare it directly with other similar products from different e-commerce stores, and in turn, this entire process is followed by a sidebar with options for filtering product characteristics, such as: price, brand and others.
Chapter 3. 3. State of the Art
3.1.2 KuantoKusta
Figure 3.2: kuantokusta.pt
Kuantokusta helps consumers to compare the products displayed by traders, in order to find the best offers of products and services available. It is the Portuguese leader of price comparators.
The user can start searching for a product using the search bar, advertising banners and/or categories. If the user uses the search bar, he will be presented with the results interface with a product listing. If the user uses advertising banners or categories, he will be redirected directly to the page where the product is sold. The figure 3.3 shows the result of a search, that presents a list with products of the same kind, ordered by the best price, with the logo and hyperlink of the store that sells the product.
Chapter 3. 3. State of the Art
3.2
Product match for building a price comparison platform
To build a price comparison engine, it is necessary to compare and display the data. There are many ways to collect data for comparison. Price comparison sites can collect data directly from merchants. Retailers who wish to list their products on the website, provide their product and price lists through commercial feeds, which are compared to the original database. As some sites provide data through Application Programming Interface (APIs), it is only necessary to invoke suitable endpoints to get data. Scraping the Web, which was discussed earlier, is another option for collecting data that focuses more on transforming unstructured data on the Web to a structured result. Many companies today opt to invest certain resources in collecting information about their competitors from the web and other channels. This is a routine procedure that companies tend to do, in order to keep track of what their competitors are doing, what products and services they offer, and any news that concern about them. This is usually done by the marketing team through manual navigation.
After collecting data from the different stores, it is necessary to make a corre-spondence between the different products. Most of the solutions discussed above use the product match concept to match products. Product matching aims to build algorithms that perform the intelligent task of deciding whether two products information from two different stores describe the same product or not.
Matching a seller listed item to an appropriate product has become a fundamental and one of the most significant steps for e-commerce platforms [23]. Lots of studies have been focused on structuring the products inventory by extracting and enriching attribute-value pairs from various sources, and feed them into a matching function [24] [25]. In addition, there are also several studies that use machine learning to solve the problem, as is the case with the solutions presented in the sections below. These sections have been divided into two different approaches: Product matching based on feature matching and Product matching based on binary classification.
3.2.1 Product Matching based on feature matching
Products can be described in terms of their features such as brand, color, size, etc. Using different attributes that are available in different sources, it is possible to make a match between attributes and discover the similarity between products. For example, titles of matching products may not be identical but contain semantically alike tokens. On the other hand, mismatching products may differ on a single attribute and consequently their corresponding titles may differ by as little as one character. High price differential may be a strong indicator of a mismatch but by itself is rarely conclusive since identical products may have highly varying prices across different sellers while certain kinds of mismatched products may still have very close or equal prices [26].
Ajinkya More [26] proposes an approach that leverages product information that the author deem the most reliable — title, description, images, and price to arrive at a matching decision. The system consists of several components and depending on the specific use cases, some or all of these components may be leveraged.
Neural networks and deep learning techniques are used to identify and learn from both similarities and differences, and to create word-level embedding to the creation of a system of representation for common words. A distinctive feature of deep neural networks is that they learn to extract what is invariant about data with respect to a given task. For in-stance: a neural network that should recognize cats on photographs can learn what pictures
Chapter 3. 3. State of the Art
with cats all have in common — the “cattiness” of an image [27]. Petar Ristoski et al.[28], use neural language models and deep learning techniques in combination with standard classification approaches for product matching and categorization. The authors inspect the use of different models for three tasks: (1) Matching products described with structured annotations from the Web (2) Enriching an existing product database with product data from the Web, and (3) Categorizing products. For those tasks, the authors employ Condi-tional Random Fields for extracting product attributes from textual descriptions, as well as Convolucional Neural Networks to produce embeddings of product images.
On the other hand, Rosie Hodd [29] uses machine learning approach to provide high accuracy and scalability with the world’s single biggest source of real-time retail data. Natural language processing (NLP) is a sub-field of machine learning, which aims to understand how computers analyze human language. One common NLP task is word embedding, mapping words to vectors that represent them, and many models exist to perform this task. At their most complex, this can be a model trained on millions of words or phrases to produce fixed length vectors based on features learned during training, where the representation of a word is distributed across several elements in a vector.
Juan Li et. al [30] proposed a neural product matching model by considering the respective characteristics of product titles and attributes, and the authors cast the problem as ranking and classification scenarios. The authors also tried different classical classifica-tion algorithms and ranking algorithms to combine their neural matching features and some other features.
Finally, Cenk Çorapcı [2] implemented a model capable of recognizing whether two product titles are the same or not. The model consisted of an embedding layer that learns character embeddings for every character input sequence on the fly, two siamese layers of one dimensional convolutions, a concatenation layer for the outputs of the convolutional layers and feed forward layers that later connect to a single sigmoid output. The output neuron gives a similarity score between 0 and 1, 1 meaning the two titles are same. The results were pretty promising and had a great likelihood of being successful.
3.2.2 Product Match based on binary classification
Another widely used approach to compare two products and assess whether they are identical or not is the classification method. In this scenario, two product descriptions are given, including their titles and attributes and the result is in two classes: 1 - represents the two products are identical and 0 - represents that they are different.
A classification model attempts to draw some conclusion from observed values. Given one or more inputs a classification model will try to predict the value of one or more outcomes. Outcomes are labels that can be applied to a dataset [31]. In machine learning, classification problems are one of the most fundamentally exciting and yet challenging ex-isting problems. The implications of a competent classification model are enormous. These models are leveraged for natural language processing text classification, image recognition, data prediction, reinforcement training, and a countless number of further applications.
In the field of machine learning and specifically the problem of statistical classifica-tion, a confusion matrix, also known as an error matrix, is a specific table layout that allows visualization of the performance of an algorithm, typically a supervised learning one (in unsupervised learning it is usually called a matching matrix). A confusion matrix is a table that is often used to describe the performance of a classification model (or "classifier") on a set of test data for which the true values are known.
Chapter 3. 3. State of the Art
Two denominations are possible, depending on the number of possible classes in the output - one used when the output is superior to two, and another one used when there are only two possible classes. In the first output case, each matrix row represents the number of instances in a predicted class, while each column demonstrates the number of instances in an actual class (or vice versa). In the second output case, the matrix displays two rows and two columns. These report the number of false positives, false negatives, while representing also the number of true positives and true negatives [32].
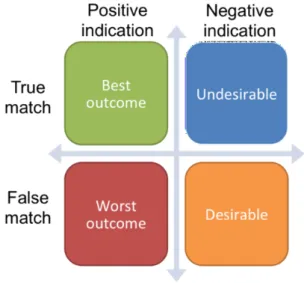
Semantics3 [33] defends that the basic immutable rule of product matching is to minimize false positives. All algorithmic end-goals point to this result over time in an iterative fashion. A false positive is generated when the algorithm indicates that two products are identical, but are not.
Figure 3.4: Classification: True vs. False and Positive vs. Negative
In order to minimize the false positives, the author employs nine different strategies in combination, as a series of “safety valves”. A product is pushed through this series of safety valves if it passes the test (Yes or No), or if the algorithm lacks sufficient data to make a judgement (Don’t know). The product-matching “safety valves” include the follow-ing: image matching, brand normalization, unique identifier (EAN checks) and keywords similarity.
The governing principle behind safety valves is to invalidate dissimilar features in products. A product that fails the test is immediately discarded. Additionally, some checks can be difficult to do and analyse, like image matching, keyword similarity checks and brand. Feature normalization are not straightforward, different retailers would use different formats and nomenclature to describe products.
3.3
Competitor Analysis tools
The end result of this project is a dashboard with real-time analysis of what is happening in the market. Although this may seem similar to the price comparison tools, it differs from these in the sense that it is more focused for retailer use than for customer use, having a more analytical component, aiming to understand the behaviour of products, promotions and prices. The tools as the one created throughout this project are named Competitor Analysis (CA) tools, and play a crucial part in the strategic planning pro-cess. Spying every move of the competitors, offers companies an advantageous position in
Chapter 3. 3. State of the Art
decision-making. After collecting data from different platforms and matching products it is necessary to analyse what the competitors are doing and what products and services they offer. In the past CA was conducted manually and it was a tedious process. For e-commerce businesses in particular, a competitive analysis can help retailers identify industry trends and determine price strategies [34].
According to Forrester Consulting [35], 81% of buyers compare the offers of several stores in search of a better bargain. Retailers that can collect and analyze market data, map their position against competitors, and offer optimal prices are the ones who catch these buyers’ eyes first and foremost.
Competitor price monitoring tools uses data science and machine learning to pro-duce competitive pricing by considering a number of internal and external parameters such as competitor pricing, market, demand and supply. Price monitoring is the action of consistently keeping an eye on competing for product prices that match with companies assortment in a systematic and organized way.
As we can see in the figure 3.5, there are plenty of pricing analysis software solutions available on the market today [36].
Figure 3.5: Pricing Tracking Tools
Source: capterra.com - Pricing Tracking Tools [36]
Even though their complexity, accuracy, and reliability may vary, the three fun-damental processes underlying the work of pricing analysis software are the same. These include: (1) Data collection, (2) Procession and analysis and (3) Recommendations deliv-ery. There is no single set of features and benefits offered by software vendors. Choosing a specific solution depends primarily on a retailer’s business goals. Many of these price anal-ysis software offer many benefits for retailers, such as: customized data sets collected in real-time, highly accurate exact and similar product matches, and total visibility of market changes.
Revionics is an American-based pricing software provider for retailers and spe-cializes in AI-based pricing software. Revionics Price Optimization utilizes AI, data, and business strategies to offer optimal prices for products. They offer clients the ability to cus-tomize categories, channels, and items according to their business needs. Revionics price
Chapter 3. 3. State of the Art
optimization software provides insights such as consumer demand forecasts, price sensi-tivity reports, changes in costs, and competitive price positions which help retailers set optimal prices for their products. Their price optimization software can help companies avoid price wars, which is a common issue in highly competitive retail markets. By giving a detailed insight into competitor price changes and the impact this can have on-demand and sales, Revionics can make companies more competitive across all channels. Revionics promises transparency into what rules are used for price recommendations and gives a comprehensive “confidence score” of the recommendations given. Ultimately the user de-cides whether or not to accept the price recommendations given by their price optimization software, but Revionics assures that the price recommendations their software provides will result in profit and customer satisfaction [37].
In price monitoring, the online supermarket sector faces a different paradigm than the rest. This sector contains an almost infinite catalog size and a product stock that is as variable as it is sensitive, meaning that online supermarket price comparison must be treated in a completely different way. In this type of market not only other supermarkets participate, but other giants of Internet sales are also sticking their noses in and com-peting in the shipment of household products and groceries to consumers’ homes. In any case, whatever competition the supermarket faces, the main stumbling block that must be overcome in this area is the numerosity of the products on sale. This makes it practi-cally impossible to track prices by hand and preventing, in many cases, the possibility of maintaining competitiveness in the face of certain offers and price reductions. Minderest’s supermarket price comparison software is capable of matching products by equivalence even if they are not identical to each other. In this way it is possible to make an effective price comparison between the different products of each supermarket [38]. Minderest is already trusted by major national and international accounts, such as Carrefour and the Auchan Group. One of the strengths of Minderest’s software is its supermarket-specific matching technology. With this, the software can match fresh products by similarity or equivalence, as well as private label products. Matching own brands is one of the most complex, as it requires the identification of the alternatives to be covered by each product, so it is undoubtedly a high added value for the tool. Online supermarkets now also need to adapt to the new online competitiveness, and to do so it is necessary to have the right technology to keep them in the battle to attract, capture, and retain customers.
3.4
Conclusion
Although there are several data collection and analysis platforms on competitors’ products, operating in diverse industries throughout many cities in Europe, there is yet to be one to focus in the Portuguese food retail sector. These platforms require extremely high maintenance - starting right from the simple data collection and analysis from all the different websites. Each retailer presents their product information in a different way, and the information may change from day to day, thus, requiring a high level of maintenance. The development of this project is still an innovative one in Portugal, regardless of the fact that the product may be transversal to any country or industry. Despite this, its proximity to the Portuguese market and business models makes it more suitable to fit the Portuguese retail sector, for which it was developed. An example of this strong suitability related to the fact that the display of data and strategies shifts from market to market, and from retailer to retailer - having been developed specifically for Portugal, this product brings a significant advantage in Portugal when compared to similar products existent around Europe, due to the fact that no one actually knows the Portuguese market as well as Portuguese people themselves.
Chapter 4
Implementation
The main focus of this project is aimed at providing Portuguese retailers in the online food sector with real-time information regarding what is happening in the market. In order to do so, the development of a SaaS that is transversal to any retail company is the main goal. By utilising this SaaS, retailers will be able to analyse price evolution over time, and consequently, discover which price strategy each of their competitors applies and which companies are monitoring each other. Through the development of the project, the most significant challenge faced is to match the products from different retailers, as it is not trivial and requires a thorough analysis of the different products. When completed, the project’s output should be an iterative dashboard that allows the retailer to understand their market position: analysing prices and category composition, coverage of assortments and categories, comparison of promotions, and framing in the product portfolio.
The following chapter will enable a better understanding of the implementation of this SaaS, by describing the entire solution developed for the problem mentioned above. Initially, the high-level overview of the developed solution is described, briefly covering the technologies and methodologies chosen to make the whole system function. Posteriorly, each of the software components is thoroughly analyzed so that the project’s architecture and algorithms are clear. Doing so will enable the understanding of how the whole system will be able to deliver the proposed features.
4.1
Software Overview
This software has been designed to automatically collect product data from dif-ferent online retail stores and implement a product match capable of identifying a match between competitor products.
The development of this SaaS is divided into four phases: (1) data collection from different online stores, (2) data cleaning and standardization, (3) product match and (4) the implementation of an analytical layer. This last layer is developed after the completion of the product match algorithm, and is implemented through the use of the Microsoft Power BI service [39]. This service is used to find insights about the data. Power BI can help connect disparate data sets, transform and clean the data into a data model and create charts or graphs to provide visuals of the data.
The software is developed using Python and AWS technologies. Amazon Web Ser-vices (AWS) is the world’s most comprehensive and broadly adopted cloud platform, of-fering over 175 fully featured services from data centers globally. Millions of customers — including the fastest-growing startups, largest enterprises, and leading government agencies
Chapter 4. 4. Implementation
— are using AWS to lower costs, become more agile, and innovate faster. Cloud computing is the on-demand delivery of IT resources over the Internet with pay-as-you-go pricing [40].
Figure 4.1: Solution Architecture
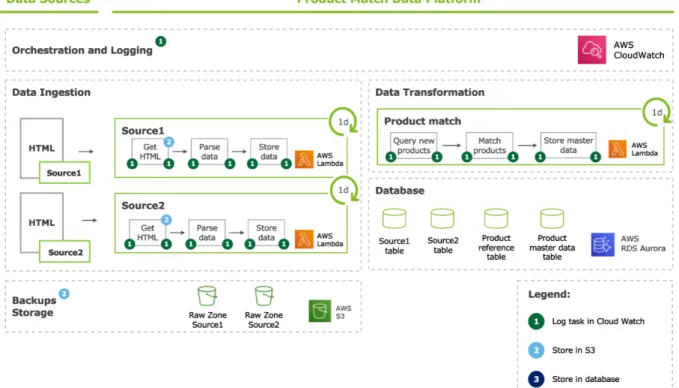
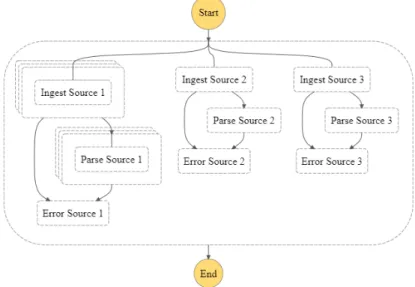
Figure 4.1 is a diagram of the project architecture, highlighting the two main processes: data ingestion and product match. To better comprehend the layout, the tech-nologies used are explained below. Each process is executed through AWS lambda. AWS lambda is an event-driven, serverless computing platform provided by Amazon as a part of Amazon Web Services. It is a computing service that runs code in response to events and automatically manages the computing resources required by that code. For each of these processes represented by lambdas to be executed daily, the AWS CloudWatch service was used as a scheduler (running the task once a day) and a task recorder (event manager). CloudWatch collects operational and monitoring data in the form of logs, metrics, and events, providing a unified view of AWS resources, applications, and services that run on AWS and on-premises servers. This resource is represented at the top of figure 4.1, and all processes using this service are identified with the corresponding number in the legend (1). Data from different retailers’ websites collected daily is saved as it comes from the source in the Amazon S3 bucket. Amazon Simple Storage Service (Amazon S3) is an object storage service. This process is represented in the "Backup Storage" section identified in Figure 4.1, and all methods using this service are identified with the corresponding number in the legend (2). After that, the data is processed as desired and saved in a PostgreSQL database. This process is also identified in Figure 4.1, labeled "Database", and all meth-ods using this service are identified with the corresponding number in the legend (3). To make the configuration of this database with the AWS service easier, Amazon RDS was used. Amazon RDS supports a variety of database mechanisms for storing and organizing data and helps with database management tasks such as migration, backup, recovery, and patching. The integration of these processes is made easy by the fact that it is a serverless application. The Serverless Framework was designed to provision AWS lambda Functions, events, and infrastructure resources safely and quickly. It does this via a couple of methods intended for different types of deployments.

![Figure 2.1: Architecture of a standard Web Scraping Source: Pinterest - softprodigy.com [8]](https://thumb-eu.123doks.com/thumbv2/123dok_br/15702753.1067525/28.892.249.650.845.1035/figure-architecture-standard-web-scraping-source-pinterest-softprodigy.webp)