YourNow: Daimler’s and BMW’s
joint road towards new mobility?
Lisa Maria Scherer
Dissertation written under the supervision of Patrícia Machado
Dissertation submitted in partial fulfilment of requirements for the MSc in
International Management, Specialization in Marketing at the
Abstract
In the late 1990s the Dynamic Capabilities framework by Teece et al. (1997) shifted the focus of strategic management to an individual company’s resources and its ability to adapt them to external market trends. Refined by Barreto (2010), this resource-based view serves as a theoretical framework for this thesis, which aims at examining the development of a strategic, technological partnership between two established industrial companies.
Hereby, Daimler and BMW, two of Germany’s leading automotive manufacturers are used as a real-world example in the form of a case study. The case depicts the current developments in the automotive industry and the opportunities available in the field of new mobility for traditional manufacturing companies. It outlines Daimler’s and BMW’s historical milestones and their path towards their mobility joint venture YourNow, launched in early 2019.
From a strategic point of view, the case highlights the companies’ motives for the joint venture. It analyzes the exogenous shocks the companies faced, urging the former rivals to cooperate. Furthermore, the case evaluates the joint venture’s capabilities to succeed in the highly competitive mobility market as of mid 2020.
Keywords: Exogenous Shocks, Dynamic Capabilities, New Mobility, Strategic Partnership, Joint Venture
Dissertation Title: YourNow: Daimler’s and BMW’s joint road towards new mobility? Author: Lisa Maria Scherer
Sumário
No final dos anos 1990, a framework das Dynamic Capabilities de Teece et al. (1997) mudou o foco da gestão estratégica para os recursos internos de uma empresa e para a sua capacidade de adaptá-los às tendências do mercado externo. Refinada por Barreto (2010), essa visão baseada em recursos serve como base teórica para esta tese, que visa examinar o desenvolvimento de uma parceria tecnológica estratégica entre duas empresas industriais já estabelecidas no mercado.
O caso de estudo da Daimler e da BMW, dois dos principais fabricantes de automóveis da Alemanha, é utilizado como exemplo do mundo real das empresas. O caso descreve os desenvolvimentos atuais na indústria automóvel e as oportunidades disponíveis no campo da nova mobilidade para os fabricantes tradicionais. São relatados os marcos históricos da Daimler e da BMW e o seu caminho para a joint venture de mobilidade “YourNow”, lançada no início de 2019.
Do ponto de vista estratégico, o caso destaca os motivos das empresas para a joint venture. Analisa ainda os choques exógenos enfrentados pelas empresas, que motivaram os antigos rivais a cooperar. Além disso, o caso avalia as capacidades da joint venture ser bem sucedida no mercado altamente competitivo da mobilidade, em meados de 2020.
Palavras-chave: Choques Exógenos, Mudança Estratégica, Dynamic Capabilities, Nova Mobilidade, Parceria Estratégica, Joint Venture
Título da dissertação: YourNow: o caminho conjunto da Daimler e da BMW em direção a uma nova forma de mobilidade?
Acknowledgments
First of all, I would like to express my gratitude to my supervisor Patrícia Machado. Thank you for your constant support during these unprecedented times throughout the development of this thesis. Your theoretical knowledge and your practical insights inspired me, helped me to nourish my ideas, and enabled me to grow during this process.
Furthermore, I would like to thank my family for supporting me during my academic career. Thank you for enabling me to collect unforgettable experiences in Asia, Lisbon or Germany which allowed me to grow professionally and personally. All while keeping me on the ground during sometimes challenging and difficult times.
Lastly, a huge thanks to my friends for motivating me to become the best version of myself. For making me laugh, for accompanying me on my path, and for experiencing the highs and lows with me.
Table of Contents
Abstract ... II Sumário ... III Acknowledgments ... IV Table of Contents ... V List of Abbreviations ... VI 1. Introduction ... 1 2. Literature Review ... 3 2.1 Dynamic Capabilities ... 3 2.2 Joint Venture ... 5 2.3 Mobility as a Service ... 7 3. Teaching Case ... 93.1 From the first automobile to the leading luxury car manufacturer: Daimler AG ... 10
3.2 An innovative force in the heart of Bavaria: BMW ... 11
3.3 Looking further down the Road: The New Mobility Market ... 12
3.4 On the road to success? The milestones of the mobility joint venture ... 16
4. Appendix ... VII 5. Teaching Notes ... 20 5.1 Overview ... 20 5.2 Teaching Objectives ... 20 5.3 Intended Contribution ... 21 5.4 Pedagogical Overview ... 21
5.5 Assignment Questions & Analysis ... 22
5.6 Board Plan ... 29
6. Discussion ... 30
7. Conclusion ... 35 Bibliography ... XIII Endnotes ... XIX
List of Abbreviations
bn Billion
CAGR Compound Annual Growth Rate
CS Car Sharing
DC Dynamic Capabilities
EBIT Earnings Before Interests and Taxes
JV Joint Venture
m Million
MaaS Mobility as a Service
M&A Mergers and Acquisitions
OEM Original Equipment Manufacturer
RBV Resource-Based View
RH Ride-Hailing
1. Introduction
Fast-growing cities and disruptive technologies combined with an increased environmental consciousness are challenging the traditional and well-established automotive industry. According to Accenture (2018) the revenue growth of the automotive industry has reached its plateau, with profits shrinking slightly until 2030. However, every cloud has a silver lining, and in the case of the classical automotive manufacturers this silver lining is called Mobility as a Service (MaaS). Mobility as a Service is defined as “the integration of various forms of transport services into a single mobility service accessible on-demand” (Transit Protocol, 2019). This new market sounds promising as it is expected to grow to an estimated $451bn until 2030 within the European Union, depicting a CAGR of 25% (Statista, 2020). The opportunities seized by engaging in the MaaS sphere are vast: from ride-hailing to car-sharing to smart parking it encompasses the whole mobility experience.
The entry barriers of this market seem to be predominantly low for the automotive manufacturers. However, Möller et al. (2019) estimate the investments needed to successfully enter this market to be around $70bn for each individual company. Consequently, traditional automotive manufacturers increasingly engage in partnerships to cover the enormous investments and risks associated with the newly established mobility market.
As a consequence, what better way to face this challenge than to build a $1.13bn joint venture through Germany’s biggest and most renowned car companies – Daimler and BMW – which comprises the entire mobility infrastructure (Hawkins, 2019)?
Given the high economic relevance of the automotive industry, this dissertation aims to portray the strategic path BMW and Daimler took to face the exogenous shocks in the manufacturing and car sales market. It highlights the importance of a long-term strategy, with the companies’ move into the previously untapped sector of MaaS, and the overall reorientation of a traditional industry. Furthermore, it analyzes the motives to engage in a strategic partnership as well as potential risks and benefits associated with joint ventures. Ultimately, this thesis might serve to illustrate an example of the use of the Dynamic Capabilities framework in order to evaluate how firms can cope with changing environments.
After years of excessive growth in the early 2000s, the German car manufacturers have faced a decline in profitability, forcing them to cut expenditures, primarily by reducing personnel costs and by downsizing production (Manager Magazin, 2019). Focusing on bottom-line growth,
both companies have long been undervaluing the external environment and the potential of the new mobility market. Those challenges led to the question of how Daimler and BMW can use their mobility venture to respond to the changing market developments. The answers will be evaluated by using three theoretical concepts. Firstly, through the Dynamic Capabilities approach established by Teece et al. (1997) and refined by Barreto (2010): a four-dimensional strategic framework that defines DCs as “the firm’s potential to systematically solve problems, formed by its propensity to sense opportunities and threats, to make timely and market-oriented decisions, and to change its resource base”. Secondly, Klijn et al. (2010) provide an overview of the motives leading to strategic partnerships and list key success drivers for long-term cooperation. And lastly, a theoretical presentation of the MaaS ecosystem is provided, serving as an introduction to understand the industry setting of the case.
The teaching objective of this case is for students to understand the current developments in the automotive industry – history, challenges, and trends – based on the real-world example of the Daimler and BMW mobility venture YourNow. Additionally, students are asked to classify those developments from a strategic management point of view by connecting the previously mentioned frameworks to the concepts of MaaS and the underlying case. Lastly, the endeavors of Daimler and BMW are critically evaluated concerning future strategic success and competitiveness.
This thesis consists of five chapters. First, the Literature Review provides an overview of the main theoretical concepts relevant to the case. This chapter is followed by the Teaching Case that illustrates the case of BMW, Daimler, and their joint mobility venture YourNow. Then, the Teaching Notes dismantle the case from a pedagogical perspective, before the Discussion and the Conclusion complete the thesis.
2. Literature Review
2.1 Dynamic Capabilities
The starting point of the theoretical frameworks for this thesis is the Dynamic Capabilities (DC) framework. First established by Teece et al. in 1997, it has continuously gained importance in the area of strategic management.
The concept of DC originates in the theory of the “resource-based view” (RBV), represented by scholars such as Dierickx and Cool (1989) or Barney (1986). Representatives of the RBV argue that the ability of a firm to achieve a competitive advantage is embedded in its coherent set of unique and non-replicable resources. According to Priem and Butler (2001), the approach illustrates a “business level” view of a firm’s assets, that challenges the earlier theories of Porter (1979) or Ansoff (1965), which are more focused on responding to the competitive market environment.
The original RBV has been unable to answer two main questions, which have become more substantial given the fast technological developments in the 1990s: how to react to an ever-changing environment and how to make the advantage sustainable (Bleady et al., 2018). As a response, Teece at al. (1997) introduced the idea of DC, defining it as “the firm’s ability to integrate, build and reconfigure internal and external competencies to address rapidly changing environments”.
In order to determine a firm’s unique capabilities Teece et. al (1997) established three categories: processes, positions, and paths.
Processes describe organizational routines and operations, the ability to embed external knowledge and to spur learning. This is complemented by the necessity to observe markets and competition as well as to transform and reconfigure one’s assets. Consequently, the external environment has to be taken into account. Teece (2007) claims that the DC approach is best suited for underdeveloped markets subject to technological change which is rapid and systematic. However, Zollo and Winter (2002) suggest that DC can also play a role in slower-moving environments, allowing for a broader application of the theory. Eisenhardt and Martin (2000) claim that not solely possessing the DC but rather having the ability to act upon them leads to success. Teece (2007) elucidates those thoughts by evaluating DC on the ability to sense external opportunities and threats, capturing those opportunities, and lastly responding accordingly by adapting or re-orientating the firm’s resources. Those “behaviorally based” DC can be extended from a psychological point of view. The three capabilities are closely related
to intuition and emotional reactions which are linked to neuroeconomics (Hodkinson & Healey, 2011).
Next, positions describe the company’s current assets. Excluding physical assets which can be acquired easily, the assets listed by Teece are predominantly intangible. They range from technology (know-how), reputation, market position to institutional assets.
Lastly, a company possesses path dependencies, past circumstances that now influence future directions. Those path dependencies are, for example, influenced by network externalities and developed economies of scale. Furthermore, this path is shaped by technological opportunities that lie ahead of the company. Barreto (2010) challenges path dependencies and the underlying uniqueness of a firm’s DC. Eisenhardt and Martin (2000) support his thinking, claiming that the cornerstones of DC might be similar in various corporations.
In conclusion, DC aim at creating a competitive advantage through an improved firm performance. This includes paths, current processes and opportunities that lie ahead (Teece et al., 1997). However, Eisenhardt and Martin (2000) argue that DC do not serve as a source for a firm’s sustainable competitive advantage, especially in dynamic environments. This standpoint is contradicted by multiple scholars, claiming that creating DC lies at the heart of fast-moving markets. And due to a firm’s ability to react quickly, this creates an inimitable sustainable advantage (Barney & Wright, 2001; Wang & Ahmed, 2007). Synoptically, Barreto (2010) suggests an “indirect link” between performance and DC. He states that the latter “may change the resource base”, which creates a new standing in the market and consequently impacts the performance.
The DC theory is considered to be relatively scattered, given several definitions and characteristics that developed over the years (Wang & Ahmed, 2007). This is largely due to the lack of quantitative assessment and its rather self-evident description of business processes (Winter, 2003). The theory faces several boundaries. First, there is no proven record regarding what type of firm profits most from the concept of DC (Barney, 1986; Barreto, 2010). Second, the type of external environment, in which the development of DC generates the most return is controversial and has yet to be researched (Barreto, 2010).
Hence, to assess the current state of the DC view, Barreto (2010) proposes an amended definition that takes into account the previously mentioned critiques. He defines DC as “the firm’s potential to systematically solve problems, formed by its propensity to sense opportunities and threats, to make timely and market-oriented decisions, and to change its
resource base”. This definition allows scholars to analyze the concept of DC from four dimensions. Firstly, the ability to sense opportunities and threats, which means scanning the external environment and the capabilities landscape. Secondly, the skill to make timely decisions, which is consistent with what was highlighted by Eisenhardt and Martin (2000): responding quickly is regarded as a capability itself. Thirdly, those decisions need to be market-oriented, which involves the ability to respond to customer behaviour and preferences (Priem, 2007). Lastly, the capacity to change the firm's resource base is vital, meaning that a company continuously has to reinvent its required resources to stay competitive. Conceptualizing DC as an “aggregate multidimensional construct” (Barreto, 2010), allows scholars to unravel the theoretical concept of DC, making it more tangible and applicable to real-world business cases.
2.2 Joint Venture
Intensifying competition, fast global market developments, and quick technological changes are drivers for companies to engage in strategic alliances, one of them being joint ventures (JV; Yasuda, 2005). JVs are “separate entities owned jointly by two or more firms that represent a partial combination of their resources” (Johnson & Houston, 2000). In comparison to M&A activities, the JV partners remain autonomous, oftentimes settling for a 50-50 ownership (Moskalev & Swensen, 2007). JVs are typically horizontally or vertically structured, with a horizontal JV displaying a balanced relationship whereas a vertical JV depicts a “buyer-seller relationship” (Lou, 2002). JVs are used as cooperative strategies in mature markets, predominantly to influence the competitive conditions (Harrigan, 1988) or as an accelerator for expansion (Tsang, 1998). According to Harrington (1988), the occurrence and the form of joint ventures depends on various factors such as demand uncertainty and growth, product differentiation, customer sophistication, or the industry structure.
Primarily, JVs serve as a means to reduce costs and risks for the partner companies. This includes the sharing of investment costs and risk diversification among multiple companies and projects (Klijn et al., 2010). Besides the obvious cost savings in production through economies of scale, Kogut (1988) underlines the importance of transaction costs, namely administrative tasks and the power of relationships.
Furthermore, collaborating in a JV increases the companies’ market power, be it through expansion or a more effective competitive position (Klijn et al., 2010). Especially when aiming to achieve international expansion, JVs abroad help a domestic company to enter a new market
(Gomes-Casseres, 1989). However, the creation of synergies is mainly associated with horizontal joint ventures, while operational synergies predominantly appear in JVs of similar companies (Johnson & Houston, 2000; Kaplan & Weisbach, 1992).
Another motive closely linked to market power is the ability to combine knowledge, particularly in the field of technology (Klijn et al., 2010). Innovative companies are more inclined to engage in strategic partnerships, generally leveraging the positive relationship between R&D and profitability (Hagedoorn & Schakenraad 1994). JVs can “supplement existing resource-based advantages” (Brouthers et al., 2008), which inspire the development of new capabilities. Especially highly technological industries call for strategic alliances, due to their fast-paced market environment (Vilkamo & Keil, 2003). Hereby, a JV is the best option for multiple business partners to transfer knowledge and technology (Wahab, 2010). Concerning the motivational ability, Habib and Mella-Barral (2007) summarize that “to acquire skills and technical knowhow” is the main motive for firms to engage in a JV.
Whereas the previously mentioned motives to engage in a JV are more practical, managerial aspects are becoming more significant. Managers sometimes do not act in the firm’s best interest. They might engage in a strategic alliance to profit from the increased power the alliance offers them in terms of budget or managerial responsibility (Das et al., 1998). Those agency problems (managers vs. stockholders) can ultimately result in inefficiencies and losses for stockholders, since the decision making authority lies in the management’s hands (Fama & Jensen, 1983).
According to Kogut (1991), nearly 70% of all JVs fail, given the high potential for conflict in this type of business partnership. From plant location, to growth plans to advertisement budget – every decision could lead to discrepancies between the partners. So how is it possible to successfully create and manage a JV? Das and He (2006) differentiate between “task-related criteria” and “partner-related criteria”. Hereby, task relatedness encompasses the companies’ resources, technological capabilities, reputation as well as management style. Furthermore, connecting the task-related criteria to the DC theory, achieving a fit here helps partners to create and assess new capabilities. Partner-related criteria, on the other hand, consist of strategic fit, objectives, and commitment. Additionally, the creation of reasonable expectations on both sides and the generation of trust serve as the main pillars for a successful strategic alliance (Elmuti & Kathawala, 2001). Ultimately, Harrigan (1986) summarizes both aspects stating that a successful JV is created through “strategic symmetries and resource asymmetries”.
2.3 Mobility as a Service
Kumaraswamy et al. (2018) describe the 21st century as “an era of continual disruption”, in
which technological innovation questions and overrules existing business models. Those innovations are blurring the lines between consumers and producers through the emergence of the sharing economy. Consumption has moved from the ultimate goal of ownership to an “access-based consumption”, which is defined as “transactions that may be market mediated in which no transfer of ownership takes place” (Bardhi & Eckhardt, 2012). This new form of collaborative consumption has largely been motivated by the development of the Web 2.0 (Belk, 2014). One of the industries that has moved into this direction, especially due to technological advancements, is the transport industry (Jittrapirom, et al., 2017). Comparable to a mobile phone subscription, nowadays transport services are tailored to the customer’s needs and are easily adaptable (Hietanen, 2014). The combination of the transport industry with the new form of ownership can be compiled in the term “Mobility as a Service” (MaaS). Its main advantages, compared to traditional forms of transportation, are flexibility, ease of use, and transparent pricing (Kamargianni & Matyas, 2017). The International Association of Public Transport (2011) distinguishes between public vs. private access as well as collective use vs. individual use. Furthermore, it limits the scope of transport modes that are available for MaaS, namely (shared) taxi, bike-sharing, car-sharing, renting services as well as car pooling. Predominantly, those services combine the ideas of individual use on the one hand, while being publicly accessible on the other (Appendix 1). Wong et al. (2018) differentiate the services in terms of mode (road vs. air), product type, and ownership type, consequently enabling a broader and more futuristic view of the concept.
Due to the innovative nature of MaaS, the characteristics are flowing and continuously expanding. Nevertheless, recent research proposes the following main characteristics of MaaS solutions. Firstly, multiple forms of transportation are combined in one digital platform, mainly app-based. Through this platform users can gather information and book their preferred transport service (Jittrapirom et al., 2017). Tickets and payments are already integrated, ensuring a seamless transaction (Kamargianni et al., 2016). Furthermore, it tracks real-time supply and demand and informs the user accordingly (Utriainen & Pöllänen, 2018). Secondly, MaaS is user-centric, it offers personalized information, such as recommendations and removes the consumer’s hassle of finding the right transport option (Jittrapirom et al., 2017). Lastly, the MaaS ecosystem combines several types of public and private transport. This includes for example ride-hailing (RH), car-sharing (CS), and bicycles, which can be booked altogether.
Overall, the objective of the MaaS infrastructure is to achieve a new level of transport, that offers a “higher service level or lower costs, simultaneously” (Utriainen & Pöllänen, 2018).
3. Teaching Case
“But time is changing. There are people who are not interested in car ownership, but in mobility. Individual mobility, on-demand.”
- Dieter Zetsche, Daimler CEO “We can combine our strengths and become a champion. This is the vision.“
- Harald Krüger, BMW CEO In February 2019, Daimler and BMW, two of the world’s leading car manufacturers, announced their JV in the start-up hub Berlin. Consistent with the location, they presented their new mobility venture YourNow, which encompassed five pillars: ReachNow, ChargeNow, ParkNow, FreeNow, and ShareNow. Those entities contained 14 different brands with more
than 60 million active usersi, underlining where the companies were heading, namely towards
“sustainable, connected and future-oriented urban mobility”.ii The traditional manufacturers were thus embracing new business models such as car-sharing, ride-hailing, digital parking, and electronic charging. Given the reduced growth in vehicle sales on the one hand and the increased potential of new business areas on the other, the companies were aiming for the $1.5 trillion automotive revenue pool created by new mobility (Appendix 2).iii However, due to this paradigm shift in the mobility sphere, the manufacturers not only had to face inter-industrial competition but were also competing against technology giants such as Uber and Google.iv Consequently, Franz Reiner, CEO of Daimler’s Mobility AG, believed that the JV had been the logical next step, since “Partnerships are becoming increasingly important to succeed in the market”.v
The venture consisted of a 50:50 ownership split, which provided both companies with equal decision-making authority.vi Given these challenges, both firms planned to invest around €1.13bn in the venture, creating approximately 1,000 new jobs.ii In order to catch up with existing technology players, the companies were willing to increase investments through external partners, ultimately aiming at listing the venture at the German stock exchange. The balance sheet valuation of the JV was set at €3.3bn internally in 2019; new financial
investments could push the valuation to more than €5bn.vii The numbers sounded promising,
nevertheless, the question remained whether the JV was the right decision for the car manufacturers. What led to the venture? Did the venture serve as the further development of the companies’ capabilities? And was it sufficient to remain competitive in the age of new mobility?
3.1 From the first automobile to the leading luxury car manufacturer: Daimler AG
History
When Carl Benz patented the first version of the modern automobile, the so-called “Motor-wagen”, in 1886 nobody could have imagined the sweeping implications this innovation was going to have on modern-day transportation.viii From the first test drive to the economic crisis in the 1920s – the first steps of the new automobile were full of stumbling blocks. Benz’s competitors Gottlieb Daimler and Wilhelm Maybach were facing similar problems, but focused their strategy on their newly developed combustion engine. The merger of the Daimler-Motoren-Gesellschaft and the Benz & Cie. was signed on June 28, 1926, resulting in the Daimler AG with their newly created brand Mercedes-Benz.ix After the war, the company profited from the "economic miracle”, achieving a one billion dollar turnover for the first time and breaking sales records. Daimler-Benz expanded into new markets, started outsourcing production, and capitalized on the rapid industrialization in the 1950s.ix In 1998, Daimler merged with Chrysler and formed the DaimlerChrysler AG, with the ultimate goal to create the “world-leading automotive group”. The deal was annulled in 2009 due to miscommunication
and Chrysler’s weak performance, and resulted in a loss of around €40bn for Daimler.x After
the economic crisis in 2008, Daimler diversified its portfolio in the area of trucks and vans. Furthermore, the company invested heavily in the Asian market, reaching double-digits in sales growth, primarily in China. The years after 2012 heralded the company’s future orientation: electric mobility, autonomous driving, and the mobility JV.xi
Financial Outlook
As of November 25, 2019, the company was divided into four business units, the parent company Daimler AG (strategy, governance, and services), Mercedes-Benz AG (cars and vans), Daimler Truck AG (trucks and busses), and the Daimler Mobility AG (Mobility and Financial Services). Even though the company sold around 2.4m cars in 2019 – a new record –
EBIT decreased significantly and dropped by almost 50% compared to 2018 (Appendix 3).xii
The most promising markets were China, Germany, and South Korea, all depicting a positive development from 2018 to 2019. However, especially the truck, van, and bus branches were struggling, displaying a negative or stagnating EBIT. Looking at the company’s ten-year development it became apparent that overall revenue was still growing but slowing down. R&D expenditures had increased dramatically from 2013 onwards, which was also reflected in the increased capital expenditure investments. As a result, the operating margin experienced a sharp
decline in 2017.xii This was due to problems such as the China-US trade dispute, mass recalls because of the diesel scandal, and internal inefficiencies.xiii
3.2 An innovative force in the heart of Bavaria: BMW
History
The “Bayrische Motoren Werke” AG was founded in 1916 by Karl Rapp and Gustav Otto, proudly presenting its iconic logo, which incorporated the Bavarian flag, in 1917. The company produced its first motorcycle in 1923, followed by the first car in 1928. In the following years the company had a diverse product portfolio, producing luxury cars and motorcycles, as well as airplane engines during the war. The first post-war automobile was produced in 1951. However, BMW was struggling in the commercial sector and was almost bought by Daimler in 1959.xiv With the introduction of the “New Class” in 1962 the rise of the sports car started, and likewise the rise of BMW as one of the world’s leading car manufacturers. BMW acquired the British Rover Group, including brands like Land Rover and Mini, in 1994 and Rolls Royce in 1998. However, as a consequence of a company realignment in 2000, the firm ended up selling the Rover Group, keeping only Mini within BMW. In 2007 the company presented its “Strategy Number ONE” which outlined BMW’s long-term future strategy. In the company’s 2020 mission statement the goal became clear: “to become the world’s leading provider of premium products and premium services for individual mobility”.xv
Financial Outlook
BMW’s vehicle deliveries have increased steadily over the last ten years, resulting in around 2.5m automobiles and 175k motorcycles sold in 2019. Coherently, revenue was on an all-time high in 2019. This was primarily due to the 16% sales growth in China that offset the decline in the European and American markets. Looking at financial figures, such as EBIT and return on sales, the numbers have decreased since 2017 (Appendix 4).xvi However, as stated by chairman Oliver Zipse the company was “working intensively to bring the EBIT margin in the Automotive Segment back within our target range of 8 to 10 percent”. Consequently, BMW was heavily investing in electric and hybrid solutions, with the goal to produce more than one million electric vehicles by 2021. To compensate for the heavy investments, BMW simultaneously aimed at reducing expenditures by €12bn until 2022, mainly by cutting down personnel costs.xvii
3.3 Looking further down the Road: The New Mobility Market
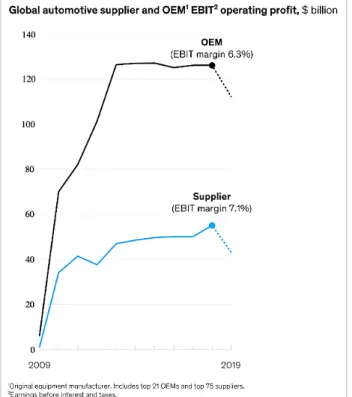
According to KPMG Consultingxviii three megatrends were shaping the future of mobility: i)
connected and autonomous vehicles, ii) electric vehicles and alternative powertrains, and iii) mobility as a service. Through those developments the mobility market was expected to double its size until 2030.xix In the last couple of years the traditional carmakers faced enormous challenges after a decade of high profits, with operating profits declining sharply (Appendix
5).xx What challenges were automakers like BMW and Daimler facing? And what opportunities
did new business models offer in order to circumvent those obstacles? McKinsey differentiated between short-term and long-term challenges.xxx
Short-term Challenges
Mostly, challenges could arise from geopolitical and market-specific risks such as trade wars, Brexit, and market saturation. The US-China trade war in 2019 led to a €300m loss for BMW and Daimler even readjusted its profit targets due to the conflict.xxi Furthermore, the formerly fast-growing Chinese market was slowing down. Whereas in 2007 car ownership was at only 6.1 cars per 100 households, this number had increased to 37.5 in 2017. Especially the urban upper and middle class households were well-equipped, lessening potential future sales.xxii In
addition, governmental CO2 limits were challenging the manufacturers. Those limits differed
worldwide, however, in Europe emissions had to be reduced by 37.5% until 2030.xxiii In order to circumvent those regulations, many companies engaged in illegal procedures that ultimately resulted in the diesel emissions scandal. The scandal led to high litigation costs, with Daimler expecting to pay up to €1.5bn to German authorities.xxiv Lastly, “classic automotive drivers”, such as segment shifts, intense competition, and new entrants were challenging the traditional market players. Examples were specialized players such as Tesla or the “big four” Chinese car manufacturers.iii
Long-term Challenges
From a long-term strategic perspective, two challenges had been sticking out: the investment in new technologies and the change in consumer behavior. The technological investment focused primarily on the three megatrends mentioned earlier. A successful development of all three areas would require an individual manufacturer to invest more than $70bn within ten
years.xxx To develop those new technologies faster, manufacturers were heavily investing in
entrants with approximately $19bn. The scope of involvement ranged from investment, to M&A, to creating accelerators.xxv Overall, R&D investments were being redistributed, switching from the product itself to software solutions.xxvi Given the high financing costs, it was essential for companies to decide on the right mobility strategy. “The automotive revolution required more than a gut feeling to drive the right decisions for a successful mobility strategy”xxvii, thus, thoughtfully deciding on how to use those investments could be challenging and rewarding at once.
Another long-term challenge was changing consumer behavior. The automotive industry was largely influenced by “the consumers of tomorrow”, a younger, tech-savvy generation. Technology as well as sustainability played an important part in their daily lives. In urban areas public transport served as the main type of transport in the EU, with car-sharing and alternative mobility solutions on the rise. In China, multi-purpose apps for ride- and car-sharing were popular. In rural areas car ownership prevailed, however, the car itself was rather seen as a functional product and lost its role as a status symbol. PwC differentiated between three different buyer personas and three different markets, underlining the consumer complexity and future indications for the car manufacturers (Appendix 6).xxxvii
Car-sharing
The “consumer of tomorrow” was mostly living in big or medium-sized cities; 54% of them were using CS services regularly.xxviii Although the concept had first been established in the US, the concept quickly developed in Europe, with 5.8m users and 68,000 cars in 2016. The market was expected to grow by 32% (CAGR) until 2020, with Germany being the biggest market in Europe. CS services were classified into three business models, which were mainly distinguished by price and flexibility: peer-to-peer CS, stationary CS, and free-floating CS.xxix Peer-to-peer CS was seen as a niche product, representing only 6% of providers.xxx Private individuals offered their car on a platform, allowing others access to the car. Users paid a daily price to use the car, which positioned the service as a direct competitor to rental car services. The market leader was US-based Turo which raised about $450m in funding and started to
expand its business to the UK and Germany in 2018.xxxi The segment was promising, having
depicted the highest growth in CS memberships from 2019 to 2024.xxxii
Stationary CS consisted of fixed stations where customers picked up and dropped off the rental car. The service was used for longer drives and targeted at rural areas or medium-sized cities. Stationary CS were often financed publically or through private investments. The biggest player
in Germany was Flinkster, which was financed by Deutsche Bahn, the national railway provider.xli
Free-floating CS accounted for 90% of the European CS providers.xxxiii The vehicle was picked up and returned anywhere within a specific area. The main advantage was flexibility; the service was primarily used for short trips in urban areas. The pay-as-you-go model provided users with low entry barriers, which led to a high growth in market share of 9% from 2017 to 2018. As of
2016 the biggest market was Asia, followed by Europe and North America.xlii The market was
estimated to generate revenues of €4.7bn yearly, with approximately 35m users worldwide in 2021.xxxiv The majority of free-floating CS were owned by car manufacturers, which primarily used the service as a strategic foothold in the new mobility sector. As of 2018, the market leader in Europe and North America was car2go (Daimler brand) with 24m rentals and 3m users
worldwide.xxxv Other big players were BMW’s DriveNow (1m users in 2017) and Fiat’s Enjoy.
In China the market was extremely fragmented and 90% of the providers were local.xxxvi
Ride-hailing
RH companies offered a “platform where individuals could hail and pay for a ride from a professional or part-time driver through an app”. The service emerged in 2009, supported by
the development of GPS, digital road maps, and smartphone penetration.xxxvii As of 2020 the
RH market encompassed 1.14bn users, corresponding to a user penetration of 15.4%. The average revenue per user was at $190, depicting a CAGR of the whole market of 13.7% from 2020 to 2023. The RH market was by far the fastest-growing in the MaaS sector, due to a straightforward business model which consisted of an app-based approach and cars owned by private drivers. Consequently, entry barriers were low and competition was fierce.xxxviii The main markets were China and the US with a booking volume of $11bn that was expected to grow to more than $25bn in 2021.xxxix The US market was twofold, with Uber having maintained a 70% and Lyft a 30% market share. Uber held a first-mover advantage, having established wide-ranging network effects since entering the market in 2009. Furthermore, both companies were diversifying their portfolio into areas such as scooter and bike sharing, as well as food delivery.xl The biggest RH market was Asia: of the 16bn rides conducted in 2017 worldwide, 70% had been completed in Asia. China, was dominated by Didi Chuxing with a 90% market share and more than 15m daily users. Didi had already outperformed Uber on the
continent, and was aiming at “competing with Uber globally”, according to its cofounder.xli
made it hard for RH to conquer the market.xlii As of 2019 Uber had invested heavily in the European market, however, it faced competition from local players. Mytaxi served as Europe’s biggest licensed taxi app and dominated in Germany and Spain. Bolt (former Taxify) with its 25m users, Yandex in Russia as well as Kapten in France were the main players in the European market.xliii
Digital Parking & Electronic Charging
With the emergence of smart city solutions, digital parking had developed into one of the fastest-growing ideas to help cope with urbanization. The app-based systems used “real-time data and applications, and low-cost sensors that enable users to observe […] parking locations”. The benefits were wide-ranging. Parking became more efficient for the users and new revenue streams e.g. through loyalty programs emerged for the providers. For the community, traffic and pollution were reduced.xliv The opportunities for the asset-intensive sector had been huge: As of 2017 there were around 155m regulated parking spaces in the EU, each generating an estimate of 780€ per year, and on average a car was parked approximately
90% of its time.xlv Furthermore, while in 2019 only 11% of parking spaces worldwide were
digitalxlvi and the smart parking market was about to grow by 20% yearly up until 2025.xlvii The market in Europe was fragmented and reached from simple parking reservation apps for cities, to fully autonomous parking apps regulated by on-site sensors. The industry players consisted of automotive companies, startups and telecommunication providers. Due to the market characteristics, M&As as well as strategic partnerships were frequent, and aimed at capturing promising geographic markets.xlviii
The development of the MaaS sector went hand-in-hand with the advancing electrification of vehicles. The sales of electric and hybrid vehicles were growing rapidlyxlix, however, this growth required the expansion of the respective charging network. For the EU, to reach its goal to be climate-neutral in 2050, there needed to be 15 times more charging stations available to close the “charging gap”.l Consequently, the electric charging infrastructure would create a completely new industry and, thus, market opportunity, which entailed a “digital ‘smartness’” such as transparent pricing and smooth payment.li The market consisted of two actors: e-mobility service providers and charge point operators. The service providers offered access to various charging stations, either of their own or third-party providers. An app helped to find the stations and to process payment. Charge point operators owned and maintained the infrastructure and set prices.lii This capital-intensive sector was dominated by established
players from the power industry, oil and gas, automotive, as well as industrial manufacturing.liii As of 2018 the “battle for electric car supremacy” was still ongoing. Whoever was able to achieve the critical mass of the charging infrastructure first, might be the one to dominate this new industry.liv
3.4 On the road to success? The milestones of the mobility joint venture
“Growth is compulsory”, this statement by Daimler CEO Dieter Zetsche summarized the motivation to engage in the mobility venture with BMW. “If you see changes but you avoid to approach them, you are lost” he added, alluding to the challenges faced by both companies in the automotive segment.lv However, it took some time to get used to seeing those two companies together, having been direct rivals for decades. It was safe to say that the collaboration was no spontaneous idea but a longstanding development from both sides. The motives and risks had been evaluated and the path had been set. Nevertheless, a glance into the past, present, and future of the JV is necessary to further understand its significance.
Joint ventures, M&As, and buy-outs – everyday business for Daimler and BMW? Besides their internal expenditures in the mobility sector, both companies had been heavily investing, buying, and partnering with emerging mobility startups (Appendix 7).
Daimler had a diversivied portfolio in the mobility sector. It reached from classical RH companies like MyTaxi, the US-based company RideScoutlvi, a 60% stake in Hailolvii to a $20m
investment in Blacklane, an on-demand limousine service.lviii Additionally, the company had
invested in mass transport: it was engaged in a partnership with Clevershuttle, a ride-pooling servicelix, and had a stake in Flixbus, the half a billion Euro rated intercity bus service.lx Besides on-road services, Daimler had been funding the flying taxi startup Velocopter with $30m.lxi BMW started its mobility investment in 2014 with a stake in RideCell, a leading software provider for MaaS.lxii Further funding included the carpooling service Scoop, the local journey planer Moovit, as well as the new-generation car rental company Skurt.
BMW, Daimler, and Audi announced their acquisition of Nokia’s mapping and location service in August 2015. The deal, which cost the automakers €2.8bn, was classified as a competitive move against Google, which relied heavily on accurate mapping systems for its self-driving cars.lxiii Daimler additionally invested in Starship, a delivery robot company, ultimately aiming
companies like Carbon and DesktopMetal. The company also had a stake in Nauto, a self-driving startup, together with GM and Toyota.lxv
Daimler launched its accelerator “Startup Autobahn”, “an innovation platform that opens its doors to entrepreneurship in the mobility sector” in mid-2016. The accelerator screened around 1,000 mobility startups yearly, offering 30 of them exclusive collaborations with companies such as Daimler, BASF, and Linde. The offered services reached from mobile payment systems
to AI to blockchain.lxvi BMW’s €500m venture capital fund “BMW i Ventures” invested, inter
alia, in the areas of autonomous driving, digital car, on-demand mobility, and digital life.lxvii As of 2017, BMW and Daimler had stakes in 37 and 36 startups respectively – exemplary for the venture capital efforts of carmakers in startups.lxviii
How two became one – the development of the YOUR NOW mobility JV
Besides their investments in external partnerships, the companies had been heavily investing in mobility solutions internally (Appendix 8). As of 2019, the newly developed Daimler Mobility unit was the company’s only business department that was displaying a positive financial trend.xii The division incorporated financial services (leasing, insurance), fleet management as well as digital mobility solutions. Daimler was pioneering the car-sharing market with car2go since its launch in 2008 and was heavily expanding in European and North American markets.lxix BMW started the new mobility era with DriveNow in 2011, together with the
German rental car company Sixt.lxx In the US the company launched ReachNow, a
multimodality app that combined multiple types of transport in one app.lxxi ParkNow was launched in the US in 2015. Additionally, the company launched the digital charging service ChargeNow.lxxii
The first speculations about the JV started in the beginning of 2017. The plans intensified in May 2017, claiming that both companies were aiming to merge their mobility services in the third quarter of 2017. The overall goal was to establish entry barriers for competitors like Google and Uber. Furthermore, consolidating the companies’ client base to scale operations. As a prerequisite both companies had to repurchase the shares of their car-sharing venture partners. BMW paid €209m for the 50% DriveNow shares of Sixt and Daimler purchased 25% of car2go shares from Europcar.lxxiii The JV was officially announced at the end of March 2018. Both companies had been negotiating for more than one year, which was mainly due to discussions about an adequate valuation of the JV.lxxiv Until then, Daimler was generating €167bn and BMW €99bn with their respective mobility solutions.lv To launch the JV, the
companies’ next step was to convince the European and US competition authorities. The automakers succeeded and the JV was approved by the authorities at the end of 2018.lxxv After
having received legal consent, the JV was launched on 22nd of February 2019. The new brand
YourNow combined a total of 14 brands with 60m users. Just after the launch YourNow encompassed five pillars which represented the main business areas (Appendix 9):
1. FreeNow: Ride-hailing – contained companies such as MyTaxi, Kapten or Beat 2. ShareNow: Car-sharing – included the two companies car2go and DriveNow
3. ReachNow: Multimodal mobility platform for the North American market – offered a MaaS platform that combined all mobility services in one app
4. ParkNow: Digital parking platform – included companies such as ParkNow, ParkMobile
5. ChargeNow: Electronic charging network (e-mobility service provider)
To accelerate growth, both companies announced an investment of €1.13bn in the new JV.i
Besides the internal investment, Daimler and BMW were further looking for external investors, having been in contact with financial investors as well as other automakers.vi By the end of 2019, the JV had published its ambitious growth plan, which aimed at combining the originally five pillars to only three pillars: 1. FreeNow & ReachNow 2. ShareNow 3. ParkNow & ChargeNow. The first developments sounded promising and user numbers had increased by 44% since the launch of the JV, to 90m users worldwide. Especially FreeNow contributed to
the growth, with the number of trips increasing by 120% and a revenue of €2bn in 2019.lxxvi
However, the established car-sharing division of the companies had developed into a problem child. ShareNow was pulled out of the North American market and the UK in early 2020 due to a lack of demand and high costs. Daimler and BMW highlighted that ShareNow will continue its operations in profitable European locationslxxvii, while at the same time announcing to restructure the JV to “pave the way for profitable growth”.lxxviii As of the 1st of January 2020 the new umbrella organization managing the three pillars was launched. Only in mid-January 2020 the new ShareNow app went live, which combined the previously separate entities car2go
and DriveNow.lxxix The publishing of the app was seen as a milestone by the two companies,
A windy road ahead – what is next for the JV?
As of 2019 automotive manufacturers generated 99% of their revenue through car sales. By 2035, this number was projected to decrease to 60%, while new mobility concepts were supposed to account for 40% of revenue.lxxxi
However, the process to embed mobility services into the companies’ business had proven to be more difficult than expected. Firstly, the strategic investments in new mobility did not pay off immediately. The services took time to generate a user base and to become profitable. According to experts, mobility concepts that had been established until 2019 would only generate profits earliest 2025.lxxxii One example was CS, which faced extreme price pressure. On average, one car was estimated to generate 45€ per day. But competition was tense and the service asset-intensive. Consequently, the service’s profitability was low and needed to be backed by investors. Yet, this implied a huge risk, due to them losing interest because of lacking profits and extensive testing which was needed to identify favorable markets.lxxxiii Secondly, technology players were entering the market and fighting for a lead. Compared to the manufacturers those technology companies had extremely high cash reserves and market valuations, which provided them with enormous cash resources and, hence, financial flexibility. This resulted in tech players spending over 10% of their revenue in R&D, while the automakers contributed less than 5%.lxxxiv In various areas, incumbents were miles ahead, with Uber and Didi having achieved more than $50bn in valuation and traditional manufacturers placed in the follower position.lxxxv Lastly, especially regarding the new mobility target customer, the companies were in need to realign their image. The heritage aspect had become less important for young customers, as opposed to a brand equity that was comprised of innovation and digitization.lxxxvi Both companies have been entangled in the diesel emission scandal. Consequently, customer trust had been lost, which had resulted in customers doubting the companies’ promise to work for a more sustainable urban environment.lxxxvii
But there was also hope for the JV and the future orientation of both companies. Their cooperation had been a huge success factor. Sharing investment burdens served as a motive for two-thirds of automotive partnerships since 2004. By engaging in YourNow, as well as incorporating further partnerships and M&As in the JV, Daimler and BMW underlined their willingness to innovate and to invest in the future.lxxxviii Furthermore, the manufacturers had existing and long-established capabilities that provided them with an initial competitive advantage. They were in the front row to leverage this opportunity – “so long as they can bolster their existing capabilities around creating and manufacturing cars, and build new capabilities
around ideating, testing, and rolling out mobility and digital services.” Both companies had the means and experience to follow a “full mobility provider” business model (Appendix 10) by complementing their existing capabilities and by developing their future capabilities.lxxxix As of 2020 the mobility JV of BMW and Daimler was still in its initial phase, having completed one full year which served as an indicator to where it was heading. The overall objective was to solve the problem of new mobility, sensing the opportunities of changing consumer behavior and technological developments on the one hand, while dealing with new technology entrants and declining profits in the core business on the other hand. The ability to make “timely and market-oriented decisions” required extensive and fast-paced R&D investments as well as flexible business models. Consequently, having complemented one’s existing capabilities while consistently adapting them to a changing external environment might have created the companies’ opportunity to seize the market. However, only time will tell whether the road they took will lead them to the pole position in the mobility segment or whether they will be overtaken by the competition.
4. Appendix
Appendix 1: The emerging mobility services landscapexciv
Appendix 3: Financial Key Figures Daimler, Ten Year Summaryxci
2010 2011 2012 2013 2014 2015 2016 2017 2018 2019
€ amounts in millions From the statements of income
Revenue 97.761 106.540 114.297 117.982 129.872 149.467 153.261 164.154 167.362 172.745 Personnel expenses1 16.454 17.424 18.002 18.753 19.607 20.949 21.141 22.186 22.432 22.657 Research and development expenditure2 4.849 5.634 5.644 5.489 5.68 6.564 7.572 8.711 9.107 9.662 thereof capitalized 1.373 1.460 1.465 1.284 1.148 1.804 2.315 2.773 2.526 3.076
EBIT1 7.274 8.755 8.820 10.815 10.752 13.186 12.902 14.348 11.132 4.329
Operating margin (%)1 7,4 8,2 7,7 9,2 8,3 8,8 8,4 8,7 6,7 2,5
Profit (loss) before income taxes1 6.628 8.449 8.116 10.139 10.173 12.744 12.574 13.967 10.595 3.83 Net operating profit (loss)1 5.120 6.240 7.302 9.173 7.678 9.007 9.007 10.88 7.963 3.068 as % of net assets (RONA)1, 3 17,5 19,9 19,6 22,6 18,8 20,1 19,1 22,5 14,8 4,8 Net profit (loss)1 4.674 6.029 6.830 8.720 7.290 8.711 8.784 10.617 7.582 2.709 Net profit (loss) per share (€)1 4,28 5,32 6,02 6,40 6,40 7,87 7,97 9,61 6,78 2,22
Total dividend 1.971 2.346 2.349 2.407 2.621 3.477 3.477 3.905 3.477 963
Dividend per share (€) 1,85 2,20 2,20 2,25 2,45 3,25 3,25 3,65 3,25 0,90
1 The figures for the year 2012 have been adjusted, primarily due to effects arising from application of the amended version of IAS 19.
3 In the context of fine tuning the performance measurement system, the definition of net assets has been adjusted with retroactive effect as of 2015. 2
Appendix 4: Financial Key Figures BMW, Ten Year Summaryxcii
2019 2018 1 2017 2016 2015 2014 2013 2012 2011 2010
€ amounts in millions
Revenues 104.21 96.855 98.282 94.163 92.175 80.401 76.059 76.848 68.821 60.477
Gross profit margin in % 17,3 19,0 20,3 19,9 19,7 21,2 20,1 20,2 21,1 18,1
Earnings before financial result 7.411 8.933 9.899 9.386 9.593 9.118 7.978 8.275 8.018 5.111
Earnings before tax 7.118 9.627 10.675 9.665 9.224 8.707 7.893 7.803 7.383 4.853
Return on sales (earnings before tax / revenues) in % 6,8 9,9 10,9 10,3 10,0 10,8 10,4 10,2 10,7 8,0
Net profit for the year 5.022 7.064 8.675 6.910 6.396 5.817 5.329 5.111 4.907 3.243
Dividend total 1.646 2.303 2.630 2.300 2.102 1.904 1.707 1.640 1.508 852
Dividend per share of common stock / preferred stock 2,50 /2,52 3,50 / 3,52 4,00 / 4,02 3,50 / 3,52 3,20 / 3,22 2,90 / 2,92 2,60 / 2,62 2,50 /2,52 2,30 / 2,32 1,30 / 1,32 1
Prior year’s figures adjusted due to a change in accounting policy in connection with the adoption of IFRS 16; see note 6 to the Group Financial Statements. In addition, figures for the prior year have been adjusted due to changes in presentation of selected items, which are not material overall.
X
Appendix 5: Global Automotive supplier and OEM EBIT operating profitxx
Appendix 6: Comparison of global customer personasxxxvii (easc = electrified, autonomous, shared, connected)
Fig. 2 Comparison of global personas
Source: The 2017 Strategy& Digital Auto Report.
EU US China
modern • Technical innovations
are part of everyday life: Use of smartphones and apps for urban transport
• Sustainable and healthy lifestyle demands pragmatic view of cars as transportation • Increased inter-modal transport
(car versus public transport) • Car ownership less important as
a status symbol • Rural areas still use cars
e + a + s ++ c ++
• Huge interest in digital technology and innovative mobility concepts • Young, urban users
in particular choose variety of transport options that do not involve owning a car • Rural areas are still dependent
on cars due to insufficient infrastructure for long-distance travel
• Journeys in urban areas often rely on inter-modal approach (e.g. Park+Ride) e + a ++ s ++ c ++ • Young, urban generation experiences economic upswing • New technologies are
actively embraced • Car-sharing and
ride-sharing services very popular (e.g.: Didi Chuxing App with > 400 m users)
• Need for own car limited to social status
• Long-distance journeys in rural areas continue to rely on own car
e ++ a ++ s ++ c ++ 2017 2030 33 % 38 % +5 percentage points, relative increase of +15%
transitory • Individuality and
consumption behaviour promote the formation of different mobility profiles
• Primarily young, urban users use alternatives such as car-sharing
• The still traditionally-oriented user group continues to prefer owning a car for reasons of comfort, status and flexibility
e a s + c +
• Both traditional and modern values • Car ownership is
anchored in mobility attitude
• Public transport plays a bigger role in cities • Basically open to new mobility
alternatives
e + a s + c
• Symbolic for the start of the economic upswing • Shared attitude to
modern mobility solutions
• Traditional prevailing use of own car in rural areas • Widespread use of public
transport e ++ a + s + c + 2017 2030 41 % 39 % –2 percentage points, relative decrease of –5%
traditional • Mainly rural population that tends to shy away from technological innovations
• Ownership or access to own car is the norm
• In urban environments, they often turn to public transport to avoid congestion and parking problems
e – a – – s – c –
• Predominantly older groups of society with deeply entrenched values and convictions • Larger share of rural
population in segment comparison
• Mobility is almost exclusively equated with own car • Not interested in innovative
mobility concepts e a – s – c – – • Public transport preferred, especially in cities • Comparatively open to technological developments
• Car use for reasons of flexibility and comfort
• Car ownership to express social status e + a s – c 2017 2030 26 % 23 % –3 percentage points, relative decline of –12%
Appendix 7: Timeline of Daimler’s and BMW’s M&A activities (own illustration; based on available information on the web)
Appendix 8: Timeline of internal developments leading to the YourNow Joint Venture (own illustration; based on available information on the web)
2014
2015
2016
2017
2018
2019
earlier2017
2018
2019
2020
earlier 05.2017: First speculations End of 2017: Buying back shares End of 2018: Competition authorities approve JV 03.2018: Official announcement 22.02.2019: Official launch End of 2019: Growth plan launch01.01.2020: New umbrella organization: From five to three pillars
Early 2020: Share Now exits North American market 2008: Launch 2011: Launch 2015: Launch 2016: Launch 01.2020: App launch
Appendix 9: YourNow Venture Overviewxciii
Appendix 10: Mobility Business Model Options for OEMsxciv
BMW Group Investor Presentation, September 2019 Page 20
YOUR NOW JOINT VENTURE. THE "MOBILITY POWERHOUSE" WITH A SIGNIFICANT END CUSTOMER BASE AND COVERAGE WORLDWIDE.
Customers** Cities** Interactions Overall H1 2019 in millions in millions GMV RR*** in billions € >4 30.4 7.5 33.4* 0.02 >75 18.2 122.0 16.4 111.9* 0.12 268.6 31 130 22 >1,200* n/a >1,200 3.4*
* For the U.S. entity of PARKNOW, the June 2019 figures are estimated.
** Partially, customer data is aggregated and thus, data summation is w/o the consideration of possible redundancies. *** Monthly gross merchandise value run rate is based on the previous month’s figure.
ADOPTING NEW BUSINESS MODELS To compete and win in these new markets, OEMs will have to adopt new business models that enable them to strengthen their existing capabilities, accommodate new ones, and leverage each group with the other. Five business model options present themselves, each of which could deliver a profitability boost, depending on a player’s business strategy and how effectively they apply it (see Fig. 5).
Five major business models for the future
FIGURE 5 LUXURY VEHICLE MANUFACTURER OEM establishes premium/luxury brand, and manufactures, markets and sells cars of the highest quality B2B ASSET PROVIDER OEM focuses on selling high quality autonomous cars mainly to B2B customers VEHICLE & FLEET OPERATOR OEM owns and operates vehicle fleet CAR MOBILITY SERVICE PROVIDER OEM offers its own car mobility service, e.g. car-sharing or ride-hailing services FULL MOBILITY PROVIDER
OEM offers full mobility as a service, combining multiple means of transportation
Car
Intelligence Build Cars & MaintenanceRepair OperationFleet Own Service Brand Car Mobility Aggregator Mutli-Modal Mobility Eco-System Provider BUSINES S MODEL S OEM OPTIONS
OEMs will have to
adopt new business
models
that enable
them to strengthen
their existing
capabilities
Source: Accenture
Function fulfilled by OEM Function potentially fulfilled by OEM
5. Teaching Notes 5.1 Overview
This case study provides an overview of Daimler’s and BMW’s engagement in the sector of new mobility and how the companies’ mobility JV serves as a means of succeeding in this newly established sector. The first part provides the reader with the necessary background on the companies’ histories and underlines the financial struggles due to the prevalent problems in the automotive sector. The second part focuses on the market environment – namely the traditional automotive industry. First, it states the short and long-term challenges of the mobility market. Moreover, it analyzes the four main business models, which are of importance for the YourNow JV, based on their growth potential, target customers, and competitive environment. The third part describes the development and significance of the JV. It includes the preceded M&A strategies of both companies and presents the timeline of the JV, providing an assessment of the companies’ JV as of early 2020. Ultimately, positive and negative future scenarios for the JV’s development are presented.
5.2 Teaching Objectives
The case aims to be taught to university students in the field of management that are focusing on the areas of strategy, dynamic capabilities, organizational change, and disruptive technologies. Furthermore, the case can serve as an example of why to engage in strategic partnerships and how to bundle resources to stay competitive. It demonstrates how traditional manufacturing companies are facing external digital shocks, which force them to realign their existing resources. The case of the discussed companies might serve as an example for other historical first-movers that have to adapt their strategy to the newly developed challenges of the 21st century. Having successfully worked through the presented case, readers should be able to:
› Understand the concepts of DC and strategic partnerships
› Gain an overall understanding of the struggles in a traditional manufacturing industry, based on financial and market data, as well as the opportunities and threats generated by technological disruption in the market
› Analyze the strategic M&A choices of two leading companies and comprehend the motives promoting the creation of a strategic partnership
› Evaluate the prospects of success of a strategic partnership, particularly with regard to realigning a company’s capabilities in line with future market developments