1 Universidade Federal do Tocantins, Curso de Nutrição. Campus de Palmas, Quadra 109 Norte, Av. NS-15, ALCNO-14, Bloco Bala I, Plano Diretor Norte, 77001-090, Palmas, TO, Brasil. Correspondência para/Correspondence to: LC HOLZBACH. E-mail: <[email protected]>.
Article based on the masther thesis of LC HOLZBACH, entitled “Segurança alimentar e qualidade em terapia nutricional de recém-nascidos pré-termo em UTI neonatal”. Universidade Federal do Tocantins; 2017.
Como citar este artigo/How to cite this article
Holzbach LC, Moreira RAM, Pereira RJ. Protein-energy adequacy and nutritional evolution of preterm infants in neonatal intensive care unit. Rev Nutr. 2018;31(2):147-57. http://dx.doi.org/10.1590/1678-98652018000200002
Protein-energy adequacy and nutritional
evolution of preterm infants in
neonatal intensive care unit
Adequação calórico-proteica e evolução nutricional
de recém-nascidos pré-termo em terapia
intensiva neonatal
Luciana Carla HOLZBACH1 0000-0001-8599-8639
Renata Andrade de Medeiros MOREIRA1 0000-0001-9487-4013 Renata Junqueira PEREIRA1 0000-0001-6096-9145
A B S T R A C T
Objective
To evaluate the prescription of protein-calorie nutrition and its adequacy to the requirements of preterm newborns.
Methods
Prospective study with 30 preterm infants from a neonate intensive unit care. Anthropometric and nutritional therapy data were collected daily. Nutritional demands were defined according to the national guidelines. Protein-calorie nutritional support was considered adequate when it reached 70% of the calculated demand. The evolution of nutritional status was evaluated according to the growth curves of preterm infants. Statistical analyses were performed with the Statistical Package for Social Sciences 20.0, at a 5% significance level.
Results
difference between the volume of prescribed and administered nutrition (p>0.05). At birth, 30% of the children were small, 66.7% were adequate, and 3.3% were large for gestational age. At discharge, the percentages were 33.3%; 63.3%; 3.3%, respectively. The values at birth significantly differed from those at discharge (p<0.01).
Conclusion
In the Unit of Neonatal Care studied, inadequate nutrient prescription and support is a factor that can compromise the nutritional status of the newborns at hospital discharge.
Keywords: Infant, Premature. Nutritional therapy. Nutritional status.
R E S U M O
Objetivo
O presente estudo teve como objetivo avaliar a prescrição calórico-proteica em recém-nascidos prematuros, mensurando sua adequação às necessidades individuais.
Métodos
Trata-se de estudo prospectivo, com trinta crianças prematuras de uma Unidade de Terapia Intensiva Neonatal do Tocantins. Foram coletados diariamente dados antropométricos e da terapia nutricional recebida. As necessidades nutricionais foram definidas seguindo as diretrizes nacionais. Considerou-se adequada a oferta calórico-proteica que atingiu 70% das necessidades calculadas. A evolução do estado nutricional foi avaliada pelo indicador peso para idade gestacional. As análises estatísticas foram realizadas no Statistical Package for Social Sciences 20.0, com significância de 5%.
Resultados
As médias das necessidades, da prescrição e da infusão diferiram significantemente entre si. Os valores de calorias e proteínas prescritos e administrados apresentaram inadequação às necessidades calculadas. Não houve diferença significante entre o volume de nutrição prescrito e o administrado. Ao nascer, 30% das crianças eram pequenas, 66,7% adequadas e 3,3% grandes para a idade gestacional. No momento da alta, os percentuais foram, respectivamente, 33,3%, 63,3% e 3,3%, o que indica uma diferença significativa em relação aos valores observados quando do nascimento.
Conclusão
Na unidade estudada, a prescrição e oferta inadequadas de nutrientes são fatores que podem comprometer o estado nutricional dos pacientes, aferido no momento da alta.
Palavras-chave: Recém-nascido prematuro. Terapia nutricional. Estado Nutricional.
I N T R O D U C T I O N
The survival rate of Preterm Newborns (PTNB) is increasing, ranging from 17% to 90%, depending on the Gestational Age (GA) [1-3]. According to DATASUS data, of all children born alive, 14% were born prematurely in Brazil in 2014 [4].
The nutrition of PTNB should promote growth similar to intrauterine growth, without causing stress due to immaturity, and prevent the following consequences resulting from inadequate nutrition: metabolic acidosis, persistent ductus arteriosus, necrotizing enterocolitis,
hypercholesterolemia, hyperuremia, and hyper-ammonemia [5-7].
After the first week of life, rapid recovery weight loss after birth is expected, resulting from changes in tissue fluid composition, clinical and therapeutic conditions, and nutritional support. However, for preterm infants, the action of stressors and inadequacy of Nutritional Therapy (NT) make weight recovery difficult and slow [1].
Parenteral Nutrition (PN) with proteins on the first day of life, followed by the supply of lipids via parenteral and trophic enteral nutrition on the second day. Other studies recommend the use of proteins and lipids during the first hours of life [3,5,8].
The current recommendation is to initiate trophic enteral nutrition within 72 hours of life, except for Necrotizing Enterocolitis (NEC) or malformations of the gastrointestinal tract. However, for a variety of reasons, a significant number of preterm infants are maintained on exclusive PN on the first week [3,5,7,8].
According to the Brazilian guidelines for nutritional therapy, the energetic demand for preterm infants ranges from 50 to 150Kcal/kg/ day, delivering 110 to 130Kcal/kg/day by Enteral Nutrition (EN) and 90 to 100Kcal/day by PN. The efficiency of enteral energy absorption is 85.0% and protein absorption is 88%. Protein nutritional support should be of 3 to 4g/kg/day [7].
Due to the reported importance of nurturing PTNBs at the right time, through the correct feeding route, and in the right quantity, the present study evaluated the prescription of protein-calorie nutrition by measuring its adequacy to individual needs, comparing the volume of prescribed and administered nutritional support, and investigating the relationship between the adequacy of nutritional support and the evolution of the nutritional status.
M E T H O D S
This prospective study investigated children born at Gestational Ages (GA) below 37 weeks at the Neonatal Intensive Care Unit (NICU) of the Dona Regina Hospital and Maternity
Hospital in Palmas, Tocantins, between March
and June 2016.
The sample was calculated considering the prevalence of preterm infants in a 20-bed
unit, during the months of collection, at a 95.0% confidence interval. All newborns who met the inclusion criteria (n=30) received follow up. The PTNBs who had been transferred, discharged, or died before the beginning of Nutritional Therapy (NT) and those who were exclusively breastfed, as it was not possible to quantify intake precisely, were not included in the study. All newborns included in the study received human milk through enteral nutrition.
The NT data were collected daily from the medical, nutritional and nursing records. The nutritional requirements were established in accordance with the national guidelines adopted by the ICU nutrition support team that follow the most current recommendations on the subject [7], considering the following:
- Extreme preterm infants (GA >30 weeks): 50 to 100Kcal/kg/day during the first week and 110 to 150Kcal/kg/day thereafter. These values varied according to the feeding route: PN provided 90 to 100Kcal/Kg/day and EN provided 110 to 130Kcal/Kg/day. The calculated amount of protein was 3g/kg/day on the first day and 3.5 to 4g/kg/day on the subsequent days.
- Preterm infants (GA between 30 and 37 weeks): EN provided 105 to 130Kcal/kg/day and 80 to 90% of this value was provided by PN. The calculated supply was 50Kcal/Kg/day from
the 1st to the 4th day, 60Kcal/Kg/day from the
5th to the 7th day, 85 Kcal from the 8th to the
10th day and 100Kcal/Kg/day thereafter. Protein
nutritional support was of 3 to 4g/kg/day.
The protein-calorie nutritional support considered adequate was the one that reached 70% of the calculated demand, considering the mean nutrient supply during hospitalization, as
proposed by Waitzberg et al. [9].
The evolution of the nutritional status was evaluated by the weight indicator for GA at birth and discharge from the ICU using the growth curves of preterm infants proposed by
because it was proposed for Brazilian newborns and it is a reference used for routine monitoring at the intensive care unit studied.
The newborns were classified as Small for Gestational Age (SGA) when their weight at
birth or discharge was below the 5th percentile;
Adequate for Gestational Age (AGA) when
weight at birth or discharge was between the 5th
and 95th percentiles; and Large For Gestational Age (LGA) when weight at birth or discharge was above the 95th percentile of the growth curve.
Statistical analyses were performed using the Statistical Package for Social Sciences (SPSS; Inc. Chicago, Illinois, united States of America) 20.0, at a 5% significance level. The mean variables energetic demand (1), mean prescribed calories (2), percentage of adequate caloric prescription (3), mean administered calories (4), mean prescribed volume of EN (5), mean administered volume of EN (6), adequate percentage of administered volume of EN (7), adequate percentage of administered protein (8), mean protein requirement (9), mean prescribed protein (10), adequate percentage of prescribed protein (11), mean administered protein (12), adequate percentage of administered protein (13), mean prescribed volume of PN (14), mean administered volume of PN (15), and adequate percentage of administered volume of PN (16) were submitted to the Kolmogorov-Smirnov normality test. Variables 7, 13 and 16 did not present normal distribution.
A descriptive analysis of the data was performed. After the classification of the newborns into groups, according to the classification of weight for GA at birth, the variables that presented normal distribution (1,2,3,4,5,6,8, 9,10,11,12,14,15) were submitted to Analysis of Variance (ANOVA), followed by multiple comparisons by Tukey's test. Variables 7, 13 and 16 were submitted to the Kruskal-Wallis test, followed by the Mann-Whitney test. The nutritional status (weight/age parameter) at birth and discharge was compared by the
Student’s t-test. The variables ‘mean protein’
and ‘administered calories’, and the ‘mean
administered volume of EN and PN’ were
correlated with weight at discharge by Pearson's correlation test.
The study was approved by the Research Ethics Committee involving human beings of the Universidade Federal do Tocantins, under protocol nº 055/2015.
R E S U L T S
We monitored 100.0% of the newborns admitted, representing 69.8% of the calculated sample (n=53). The characteristics found are described in Table 1. Of the preterm infants, 27.0% (n=8) were extreme preterm infants (GA <28 weeks), 30.0% (n=10) were moderate (28-32 weeks) and 43.0% were borderline (n=12) (32-37 weeks), according to the classification of the World Health Organization (WHO) [10]. Prevalence of low birth weight male PTNBs (<1,500g) and AGA were observed. At discharge, 13.3% (n=4) of the children had the same birth weight, 43.3% (n=13) had lower birth weight, and 43.3% (n=13) had weight increase.
On admission and discharge, there was a predominance of AGA preterm newborns. However, the nutritional status of the newborns declined in 10.0% of the sample, it was maintained in 83.8% and evolved in 6.7%.
Of the children followed up, 63.3% (n=19) were discharged from ICU and transferred to an intermediate care unit, 13.3% (n=4) were discharged home, 20.0% (n=6) died, and 3.0% (n=1) were transferred to another hospital.
Table 1. Characterization of preterm newborns at birth (n=30), hospitalized in neonatal ICU of a Public Maternity in Tocantins, 2016.
Variable Values
Gestational age (weeks)* 32.2 ± 3.5
Sex**
-Male 56.7% (17)
Female 43.3% (13)
Newborn height (cm)*** 40.88 (IC 95%: 38.38 – 43.38)
Cephalic perimeter at birth (cm)*** 29.36 (IC 95%: 27.69 – 31.03)
Thoracic perimeter at birth (cm)*** 26.08 (IC 95%: 24.39 – 27.77)
Newborn weight (kg)*** 1.68 (IC 95%: 1.41 – 1.96)
Mean weight gain per day (g/day)* -0.66 ± 15.45
Small for gestational age at birth (SGA)** 30.0% (9)
Adequate for gestational age at birth (AGA)** 66.67% (20)
Large for gestational age at birth (LGA)** 3.33% (1)
Small for gestational age at discharge (SGA)** 33.3% (10)
Adequate for gestational age at discharge (AGA)** 63.3% (19)
Large for gestational age at discharge (LGA)** 3.33% (1)
Length of stay in the intensive care unit (days)* 13.3 ± 6.4
Note: *Mean and standard deviation; **percentage (n); ***(mean and 95% confidence interval).
Source: Research data.
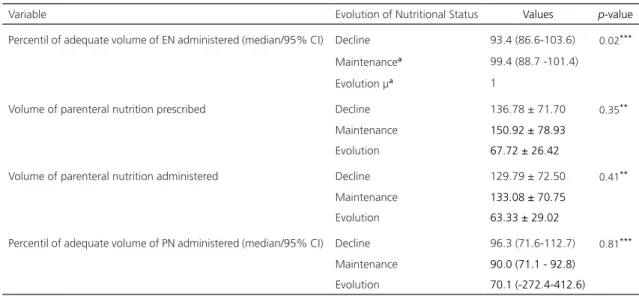
their nutritional status, but without statistical significance. The group in which the nutritional status was maintained was the one that received the most adequate quantity of administered nutrition than the one prescribed. The adequate percentage of administered volume of EN only differed significantly between the group that maintained the nutritional status and the one in
which the nutritional status evolved (p=0.023).
In this study, the mean quantity of calories administered was 114.0 ± 57.2Kcal/day, which was significantly lower than the quantity
prescribed (p<0.05) and calculated for each
patient (p<0.0001).
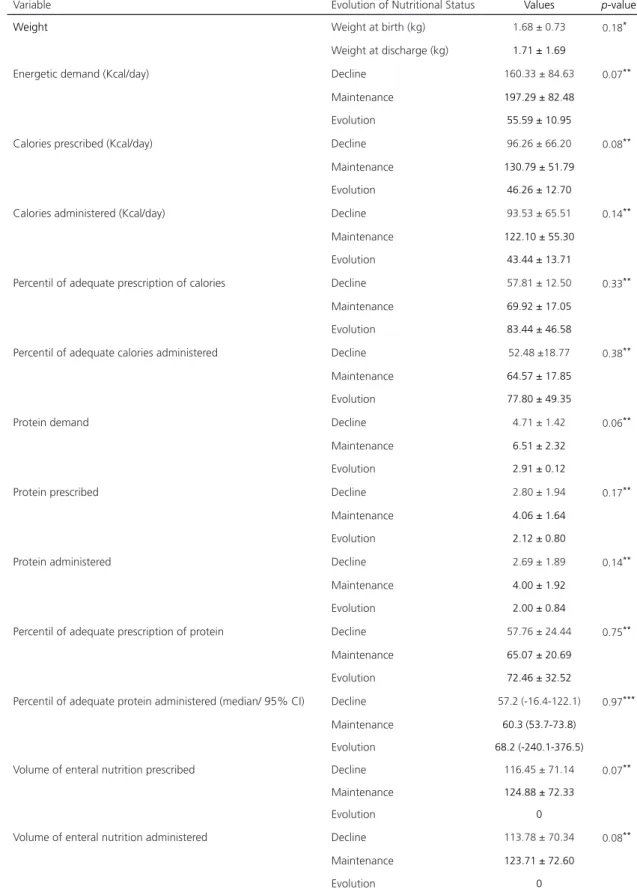
Table 2 shows that only 20 (66.6%) of the 30 patients reached a minimum of 70.0% adequacy, and only the adequacy of the administered volume of EN differed significantly between the groups.
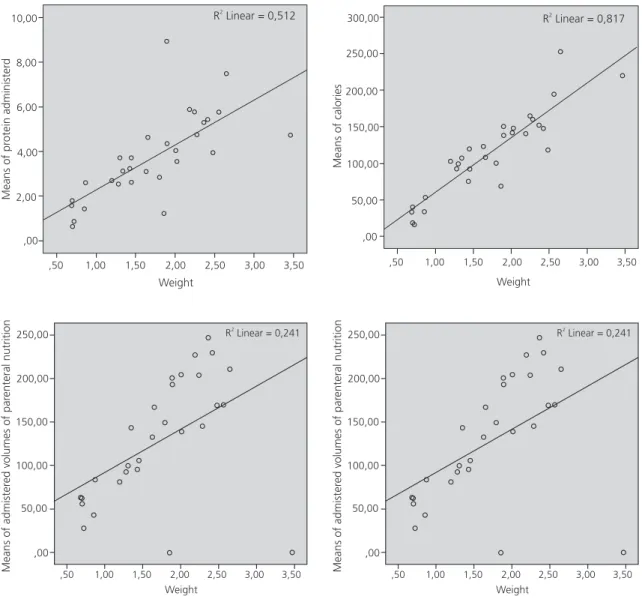
The correlation was significant and positive between weight at discharge and
the means of calories (p<0.0001) and protein
administered (p<0.0001), and between the
administered volumes of EN (p<0.0001) and PN
(p=0.006), as shown in Figure 1.
D I S C U S S I O N
According to the WHO [11], 10.0% of newborns are preterm infants and 80.0% are moderate preterm infants. A descriptive study with 18 preterm infants showed that 88.9% were moderate preterm infants and 11.1% were extreme preterm infants [1].
The increased prevalence of extreme and moderate preterm infants in the sample of the present study is because the study was conducted at a special care unit for high-risk pregnant women, and therefore, a larger number of deliveries were performed at earlier gestational stages.
When evaluating 20 preterm infants, Casteli & Almeida [12] found lower mean birth weight (1,425g + 0.462g) and higher prevalence of children with weight for gestational age
Table 2. Behavior of variables in the study when grouping newborns, according to the evolution of the nutritional status at birth and discharge.
1 of 2
Variable Evolution of Nutritional Status Values p-value
Weight Weight at birth (kg) 1.68 ± 0.73 0.18*
Weight at discharge (kg) 1.71 ± 1.69
Energetic demand (Kcal/day) Decline 160.33 ± 84.63 0.07**
Maintenance 197.29 ± 82.48
Evolution 55.59 ± 10.95
Calories prescribed (Kcal/day) Decline 96.26 ± 66.20 0.08**
Maintenance 130.79 ± 51.79
Evolution 46.26 ± 12.70
Calories administered (Kcal/day) Decline 93.53 ± 65.51 0.14**
Maintenance 122.10 ± 55.30
Evolution 43.44 ± 13.71
Percentil of adequate prescription of calories Decline 57.81 ± 12.50 0.33**
Maintenance 69.92 ± 17.05
Evolution 83.44 ± 46.58
Percentil of adequate calories administered Decline 52.48 ±18.77 0.38**
Maintenance 64.57 ± 17.85
Evolution 77.80 ± 49.35
Protein demand Decline 4.71 ± 1.42 0.06**
Maintenance 6.51 ± 2.32
Evolution 2.91 ± 0.12
Protein prescribed Decline 2.80 ± 1.94 0.17**
Maintenance 4.06 ± 1.64
Evolution 2.12 ± 0.80
Protein administered Decline 2.69 ± 1.89 0.14**
Maintenance 4.00 ± 1.92
Evolution 2.00 ± 0.84
Percentil of adequate prescription of protein Decline 57.76 ± 24.44 0.75**
Maintenance 65.07 ± 20.69
Evolution 72.46 ± 32.52
Percentil of adequate protein administered (median/ 95% CI) Decline 57.2 (-16.4-122.1) 0.97***
Maintenance 60.3 (53.7-73.8)
Evolution 68.2 (-240.1-376.5)
Volume of enteral nutrition prescribed Decline 116.45 ± 71.14 0.07**
Maintenance 124.88 ± 72.33
Evolution 0
Volume of enteral nutrition administered Decline 113.78 ± 70.34 0.08**
Maintenance 123.71 ± 72.60
Table 2. Behavior of variables in the study when grouping newborns, according to the evolution of the nutritional status at birth and discharge.
2 of 2
Variable Evolution of Nutritional Status Values p-value
Percentil of adequate volume of EN administered (median/95% CI) Decline 93.4 (86.6-103.6) 0.02***
Maintenancea 99.4 (88.7 -101.4)
Evolution µa 1
Volume of parenteral nutrition prescribed Decline 136.78 ± 71.70 0.35**
Maintenance 150.92 ± 78.93 Evolution 67.72 ± 26.42
Volume of parenteral nutrition administered Decline 129.79 ± 72.50 0.41**
Maintenance 133.08 ± 70.75 Evolution 63.33 ± 29.02
Percentil of adequate volume of PN administered (median/95% CI) Decline 96.3 (71.6-112.7) 0.81***
Maintenance 90.0 (71.1 - 92.8) Evolution 70.1 (-272.4-412.6)
*t-test; **ANOVA; ***Kruskal Wallis µ Constant value.
Notes: The values of the variables were collected in the form of means during the days of hospital stay. Equal letters differed significantly in the Mann-Whitney test (p≤0.05).
Source: Research data.
to the present study, only the gestational age (32.3 weeks) was similar. In the present study, the mean birth weight was lower than that observed in another study conducted with ICU and intermediate care unit patients [13]. The explanation may be the higher prevalence of extreme preterm infants in our sample. Furthermore, in the present study, mean birth weight and discharge weight did not differ significantly from one another, showing that there was no satisfactory weight gain at admission and the mean weight gain was found to be negative, suggesting that these patients were exposed to factors other than physiological weight loss after birth.
In a study that evaluated 37 preterm infants weighing less than 1,500 grams, a mean gain of 12.3g/day was observed [14]. In the present study, 14 (46.7%) newborns weighted less than 1,500 grams and presented a gain of 4.3 grams, which was much lower than that found by the aforementioned authors, even though the number of extreme preterm
infants in their study (73.0%) was higher. These data point to nutritional therapy failure of the newborns in our study.
Evaluating less severe preterm infants,
Cardoso et al. [1] considered a mean weight gain
of 20.2 to 37.9g/day to be satisfactory. Despite the final positive result, the authors report that 55.6% of the follow ups presented weight loss ranging from 10.0 to 50.0g/day. When comparing these data with those of the present study, we observed that fewer PTNBs (43.3%) presented weight loss and the values of daily weight loss were lower (0.26 to 45.0g/day).
Means of pr
otein administer
d
10,00
8,00
6,00
4,00
2,00
,00
,50 1,00 1,50 2,00 2,50 3,00 3,50
Weight
R Linear = 0,5122
300,00
250,00
200,00
150,00
100,00
50,00
,00
Means of calories
R Linear = 0,8172
,50 1,00 1,50 2,00 2,50 3,00 3,50
Weight
Figure 1. Pearson correlations between newborn weight and neonatal ICU discharge, mean protein and calorie administered, and
mean volumes of enteral and parenteral nutrition administered (p<0.01).
,50 1,00 1,50 2,00 2,50 3,00 3,50
Weight
Means of admister
ed volumes of par
enteral nutrition
250,00
200,00
150,00
100,00
50,00
,00
R Linear = 0,2412
,50 1,00 1,50 2,00 2,50 3,00 3,50
Weight
Means of admister
ed volumes of par
enteral nutrition
250,00
200,00
150,00
100,00
50,00
,00
R Linear = 0,2412
parameter was used since the literature affirms that it is the one that is widely used to evaluate newborns and it adequately reflects the muscle, skin, bone and organ tissue [1].
At the end of the ICU stay, the number of SGA children increased, and the number of AGA children decreased, with a higher prevalence of children who maintained the nutritional status, followed by those in which it declined.
Varaschini et al. [13], using the Fenton
& Kim curves [15], found that 20% of children were SGA, 65% were AGA and 15% were LGA,
which were similar to the values found in the present study only for AGA children. The mean birth weight found by these authors was higher (1,860g).
During the ICU stay, the child is expected to regain lost weight after birth and gain weight continuously; however, it was found that birth weight did not differ from weight at discharge
(p=0.18), corroborating the hypothesis that
as SGA at birth were discharged as AGA, and 10.5% of the children classified as AGA at birth were reclassified as SGA.
Most of the children studied were discharged to an intermediate care unit. The inadequacy of the nutritional support to meet the needs of the children and consequent failure to gain weight may have contributed to their referral to an intermediate care unit rather than going home, increasing hospital stay and exposing them to the risk of infections or other undesirable outcomes.
It was found that 46.7% of the children were fasted due to complications or procedures. The most prevalent complications were: presence of gastric residue (23.3%); other gastrointestinal tract disorders (23.3%); and blood glucose disorders (13.3%). Problems have also been reported with the supplier of the parenteral nutrition formula, such as delayed delivery of the products, which impacted the
patients’ health status.
The European Guidelines [16] recommend 110 to 135Kcal/kg/day. The quantity of calories provided is often below 120Kcal/Kg/day due to the difficulty in managing fluid restriction, development of intolerance to glucose solutions and lipid infusion, respiratory function concerns, hyperbilirubinemia, and sepsis [5]. There are reports of excess weight gain and complications related to it when the daily intake is above 100 to 135Kcal/kg/day [3]. However, in the present study, the energetic demands presented by the patients exceeded these values.
Throughout the analyses, it was found that the adequacy of nutritional support increased and varied in relation to weight at discharge, according to Figure 1, showing that the higher the weight gain, the lower the challenges to feed newborns.
The time to reach an optimal caloric intake is an important factor for the evolution of preterm infants. The American Society of Enteral and Parenteral Nutrition (ASPEN) [17]
cites studies in which preterm newborns who took more than 7 days to reach 90Kcal/kg/day, required greater insulin use, lost more weight on the first week, and presented a higher incidence of NEC and retinopathy of prematurity. According to this guideline, when comparing full parenteral nutrition support during the first hour of life and infusion of dextrose during the first 48 hours, it was found that the supply of amino acids and lipids, as of the first hour of life, provided greater retention of nitrogen and energy intake, compensating for the loss of endogenous protein of 0.5-1g/day observed in preterm infants [18].
In a study conducted in 60 hospitals in Spain, it was observed that 80% of them initiated nutrition within the first 24 hours of life for children with GA between 28 and 31 weeks; 50% for GA between 25 and 27 weeks, and only 25% initiated feeding within 24 hours for children younger than 25 weeks [6].
In the present study, all initial parenteral formula contained carbohydrates, proteins and lipids, but the mean time to initiate infusion was 49.9 ± 21.3 hours after birth.
The studied population received a significantly lower quantity of protein than the recommended amount of 3-4g/kg/day,
according to the Brazilian guidelines (p<0.0001).
The European Society recommends up to 4.5g/ kg/day for children weighing less than one kilogram [7,17]. According to the need or not to catch up growth, 3.8 to 4.4g/kg/day can be offered to children with GA between 26 and 30 weeks; 3.4 to 4g/kg/day to those between 30 and 36 weeks; and 2.8 to 3.4g/kg/day to those born between 36 and 40 weeks [18], which are much higher values than those found in the present study.
food for newborns. Since during the first days of life the use human milk-based enteral nutrition is limited, protein imbalance may worsen [5].
According to Hair et al. [19], adequate
nutrition and weight gain reduce hospitalization time for children dependent on artificial ventilation as they promote growth and lung development. These authors point out that energy restriction causes a decrease in lung function, worsening the prognosis of patients.
There are few studies that associate the nutritional support offered to hospitalized preterm newborns with their prognostic evolution, but it is well established that nutritional deprivation causes delay in growth and development, increases the risk of complications and worsens the prognosis, predisposing the infants to diseases such as obesity, insulin resistance, diabetes and hyperlipidemia in the adulthood [5].
The limitations of the study are related to the small sample, the absence of other anthropometric data, and the lack of publications on the subject in this population that better discuss the results. Despite these limitations, the study indicates the need to monitor and review the nutritional therapies provided in NICUs.
C O N C L U S I O N
It was found that both the prescription and infusion of calories and proteins did not meet the nutritional demands of the patients and the means of the variables studied did not differ between evolution, decline or maintenance of the nutritional status of the groups.
Although the correlation analyses did not show an impact of the adequacy or prescribed and administered volume of the protein-calorie nutritional support in the evolution of the nutritional status, a positive correlation was observed between weight at discharge and nutrient supply.
A C K N O W L E D G E M E N T S
LC HOLZBACH: Design, data collection and interpretation. RJ PEREIRA: Data interpretation, review and final approval. RAM MOREIRA: Data processing and statistical analysis.
R E F E R E N C E S
1. Cardoso MVLM, Moura LM, Oliveira MMC. Ava-liação ponderal do recém-nascido pré-termo na unidade neonatal de cuidados intermediários. Ciênc Cuid Saúde. 2010 [acesso 2016 set 20];9(3):432-9. Disponível em: file:///D:/Arquivos %20Downloads/12555-47692-1-PB.pdf
2. Raiten DJ, Steiber AL, Hand RK. Executive summary: Evaluation of the evidence to support practice guidelines for nutritional care of preterm infants: the Pre-B Project. Am J Clin Nutr. 2016 [cited 2016 Nov 22];103(Suppl):599-605. Available from: http://ajcn.nutrition.org/content/103/2/599S.full. pdf+html
3. Vargas JZ, Romero HA. Alimentación enteral del recién nacido prematuro. Repert Med Cir. 2013 [acceso 2016 oct 13];22(2):81-8. Disponible en: http://fucsalud.edu.co/repertorio/fbp/volumen 22-2-2013/files/assets/basic-html/page6.html 4. Ministério da Saúde (Brasil). Datasus: Sistema de
Informação sobre Nascidos Vivos Brasília: Mi-nistério da Saúde; 2011 [acesso 2016 out 13]. Disponível em: http://tabnet.datasus.gov.br/cgi/ deftohtm.exe?sinasc/cnv/nvuf.def
5. Martinez FE, Camelo Junior JS. Alimentação do recém-nascido pré-termo. J Pediat. 2001 [acesso 2016 out 16];77(supl1):S32-40. Disponível em: http://www.jped.com.br/conteudo/01-77-s32/ port.pdf
6. Moreno Algarra MC, Romero VF, Tamayo TS, Fernández MGE, García ES. Variabilidad en las prácticas sobre alimentación enteral del prematuro entre hospitales espanoles de la red SEN-1500. An Pediatr. 2016 [acceso 2016 nov 22];87(5):245-52. Disponible en: https://www.sciencedirect.com/ science/article/pii/S1695403316302697
7. Associação Médica Brasileira e Conselho Federal de Medicina. Projeto Diretrizes Volume IX. São Paulo: Câmara Brasileira do Livro; 2011.
9. Waitzberg DL, Enck CR, Miyahira NS, Mourão JRP, Faim MMR, Oliseski M, et al. Indicadores de qualidade em terapia nutricional. São Paulo: ILSI Brasil; 2008.
10. Xavier CC, Abdallah VOS, Silva BR, Mucillo G, Jorge SM, Barbieri MA. Crescimento de recém-nascidos pré-termo. J Pediatr. 1995 [acesso 2016 set 20];71(1):22-7. Disponível em: http://www. jped.com.br/conteudo/95-71-01-22/port_print. htm
11. World Health Organization. Born too soon: The Global Action Report on Preterm Birth. Geneva: World Health Organization; 2012 [cited 2016 Oct 5]. Available from: http://apps.who.int/iris/ bitstream/10665/44864/1/9789241503433_eng. pdf?ua=1
12. Castelli CTR, Almeida ST. Avaliação das caracte-rísticas orofaciais e da amamentação de recém--nascidos prematuros antes da alta hospitalar. Rev CEFAC. 2015 [acesso 2016 out 16];17(6):1900-8. Disponível em: http://www.scielo.br/scielo.php? pid=S1516-18462015000801900&script=sci_ abstract&tlng=pt
13. Varaschini GB, Molz P, Pereira CS. Perfil nutricional de recém-nascidos prematuros internados em uma UTI e UCI neonatal. Rev Cinergis. 2015 [acesso 2016 out 13];16(1):5-8. Disponível em: https://online. unisc.br/seer/index.php/cinergis/article/view/5137 14. Marcuartú AC, Malveira SS. Perfil de
recém--nascidos prematuros de muito baixo peso internados em unidade de cuidados intensivos neonatais. Rev Bras Ciênc Saúde. 2017 [acesso 2017 jan 24];21(1):5-10. Disponível em: file:///D:/ Arquivos%20Downloads/28551-70770-1-PB.pdf 15. Fenton TR, Kim JH. A systematic review and
meta-analysis to revise the Fenton growth chart for
preterm infants. BMC Pediatr. 2013 [cited 2016 Oct 17];13:59. Available from: http://bmcpediatr. biomedcentral.com/articles/10.11 86/1471-2431-1 3-59
16. European Society for Paediatric Gastroenterology, Hepatology and Nutrition. Comittee on Nutrition. Enteral nutrient supply for preterm infants. J Pediatr Gastroenterol Nutr. 2010 [cited 2016 Oct 15]; 50(1):80-91. Available from: http://www. espghan.org/fileadmin/user_upload/guidelines_ pdf/Guidelines_2404/Enteral_Nutrient_Supply_ for_Preterm_Infants_.21.pdf
17. American Society for Parenteral and Enteral Nutrition. Clinical Guidelines: Hyperglycemia and hypoglycemia in the neonate receiving parenteral nutrition. J Parenter Enteral Nutr. 2012 [cited 2016 Oct 15];36(1):81-95. Available from: http:// pen.sagepub.com/content/36/1/81.full.pdf+html 18. Ho MY, Yen YH. Trend of nutritional support in
preterm infants. Pediatr Neonatol. 2016 [cited 2016 Nov 17];57:365-70. Available from: http:// www.pediatr-neonatol.com/article/S1875-9572 (15)00189-8/pdf
19. Hair AB, Bergner EM, Lee ML, Moreira AG, Hawthorne KM, Rechtman DJ, et al. Premature infants 750-1250g birth weight suplemented with a novel human milk-derived cream are discharged sooner. Brestfeeding Med. 2016 [cited 2016 Nov 17];11(3):133-7. Available from: https://www. ncbi.nlm.nih.gov/pmc/articles/PMC4827298/pdf/ bfm.2015.0166.pdf