Influence of Small Content Elements Additions on the Glass Forming Ability of Zr-based
Bulk Metallic Glasses Alloys
Nelson Delfino de Campos Netoa* , Wesley Marques de Paulaa, Flavio Soares Pereiraa, Catherine
Jane Parrishb, Marcelo Falcão de Oliveiraa
Received: December 12, 2017; Revised: April 24, 2018; Accepted: August 19, 2018
The present work reports investigation on the Glass Forming Ability (GFA) of Zr-based Bulk Metallic Glasses (BMG’s) by microalloying with early transition metals. GFA was measured as the
amorphous fraction formed in samples with different diameters using optical microscopy (OM) and
image analysis techniques. Samples with the highest GFA had their oxygen content measured in a Leco
RO-400. This study shows that additions of Molybdenum or Iron in a Zr48Cu(48-x)Al4Mx (M = Mo or Fe) alloys resulted in a minor GFA improvement, but far from the results reported in the literature with Nb additions in this system. Niobium microalloying to a Zr62Cu15.5Al10Ni(12.5-x)Nbx and (Zr55Cu30Al10)
100-xNbx alloys have a deleterious effect on the GFA. Oxygen measurements of (Zr55Cu30Al10)99Nb1 and Zr62Cu15.5Al10Ni12.4Nb0.1 alloys have shown similar oxygen content, indicating that oxygen was not a
limiting factor on this study. The amorphous fraction quantification from OM image analysis maintains
the same fraction ratio from the heat released at the crystallization event from heating DSC analysis.
Keywords: Bulk Metallic Glasses, Rapid-solidification, Metallography, Glass Forming Ability, Oxygen.
*e-mail: [email protected].
1. Introduction
The application of Bulk Metallic Glasses (BMG) as engineering materials is the goal of many research teams spread around the globe. BMG have outstanding mechanical properties, compared to the conventional alloys, due to high strength1, resilience2, wear resistance3 and corrosion resistance4. In order to use BMGs in structural applications the research groups are investigating ways of increasing the Glass Forming Ability (GFA) and ductility of such alloys.
The literature shows that GFA and ductility can be both improved with the use of minor addition of elements, or microalloying technique5. Microalloying has improved the GFA of many BMG systems by stabilizing the amorphous phase5, removing deleterious elements from the glass matrix6 or altering its crystallization kinetics7. The ductility of several alloys was increased by the compositional change8-9 or by the formation of a second phase10-11 embedded in the amorphous matrix.
The present work reports our investigation of microalloying
effects on the GFA of Zr-based BMG, sharing some data to
other groups and supporting the development of commercial
BMG. Zr-based BMG was one of the first BMG to achieve
amorphous diameters larger than 10 mm20 and nowadays it is the only commercially feasible, known as Vitreloy21. There is a vast literature of microalloying Zr-based BMG with early22 and late23 transition metals but very few studies with elements from the groups 5-8. This study has the objective of report
the data of the microalloying effect of Molybdenum, Iron
and Niobium upon the GFA of Zr-based BMG. The GFA was measured as the amorphous fraction formed in samples with
different diameters by image analysis of optical microscopy and correlated with differential scanning calorimetry (DSC)
and scanning electron microscopy (SEM). The oxygen content of the best glass formers was also measured showing that not only the GFA was improved but the oxygen deleterious
effect was minimized.
2. Experimental Procedure
The present study was made considering glassy alloys of various compositions based on the Zr-Cu-Al system described by the general formulas (at. %): Zr48Cu(48-x)Al4Mx with M = Mo or Fe; Zr62Cu15.5Al10Ni(12.5-x)Nbx; and (Zr55Cu30Al10)100-xNbx where x could be equal to 0.1; 0.5; 1.0; or 1.5. This set of values was
chosen in order to analyze the influence of microadditions
of the presented elements on the GFA of the glassy alloys. All alloys used in the present study were produced by arc-melting from their respective constituent high pure raw elements (99%+), in a high purity argon atmosphere, on a copper hearth cooled bed with circulating room temperature
water. Each initial ingot was arc-melted at least five times and flipped between steps to assure complete homogeneity.
Afterwards, cylindrical specimens with diameters varying from 2 to 7 mm were produced by suction casting of the liquid metal into copper molds.
aDepartamento de Engenharia de Materiais, Escola de Engenharia de Sao Carlos, Universidade de São Paulo, Avenida João Dagnone, 1100, Jardim Santa Angelina, 13563-120, São Carlos, SP, Brasil
Campos et al.
2 Materials Research
The samples were cut in the cross-section using a diamond saw disc equipment for metallographic preparation. The samples were then embedded in polymeric resin and prepared
for optical microscopy (OM), by grinding and polishing
according to ASTM E3-11. The polishing step was performed on an automatic machine EcoMet 250 BUEHLER® using 1 µm alumina suspension. Subsequently, the samples had their surfaces etched by immersing them in an etching solution
of HF (0.8% wt.), HNO3 (14.6% wt.) and H2O (84.6% wt.)
for five seconds.
The OM analyses occurred by image acquisition of the
samples etched surfaces. For that purpose, it was used the software Axion Vision AxioVs40 V4.8.2.0 in a Scope A.1 Zeiss microscope. The images obtained had their analysis based on ASTM E1245-95. The method consisted in the use of automatic software-controlled segmentation procedure to
select and measure areas of interest in the images. In this case,
these areas corresponded to the bright amorphous region.
Once they were measured, it was possible to calculate its
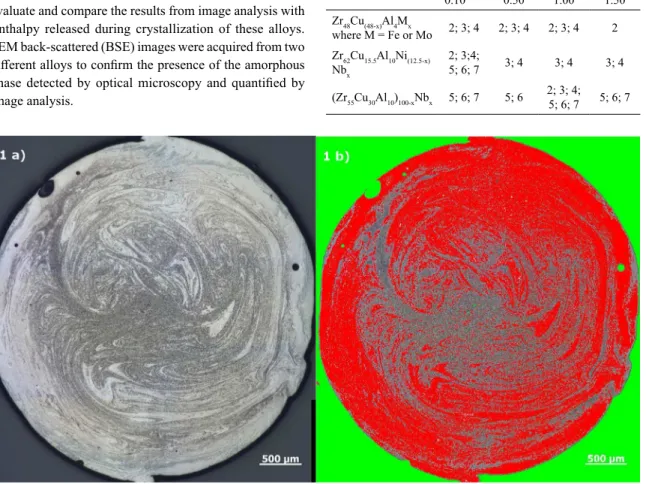
percentage considering the whole sample. Fig. 1 shows an example of measurement by image analysis. The red region corresponds to the amorphous fraction, while the green one is a region excluded from the analysis, i.e. sample mount
and pores. The same quantification procedure was performed by 4 different trained operators in order to reduce the bias
in the measurement method.
DSC analysis was made in four different alloys to
evaluate and compare the results from image analysis with Enthalpy released during crystallization of these alloys. SEM back-scattered (BSE) images were acquired from two
different alloys to confirm the presence of the amorphous phase detected by optical microscopy and quantified by
image analysis.
The samples with the higher GFA, measured by their amorphous fraction, had the oxygen content measured by hot
extraction using the inert gas fusion principle in a LECO
RO-400 equipment following ASTM-E-1019. For that purpose, 9 pieces of around 0.1 g each were used in an oxygen free Ni basket. The oxygen levels of the samples were compared
in order to evaluate any statistically significant difference
among the samples.
3. Results and Discussion
3.1 Optical microscopy analysis
Table 1 shows the samples synthesized relating their composition with the respective diameters produced, in mm.
The OM results of the amorphous fraction by the content
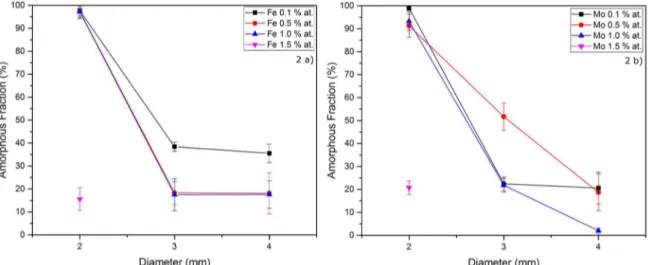
of microalloying added for the Zr48Cu(48-x)Al4Mx (M = Mo or Fe) samples are shown in Fig. 2. Figure 2(a) correspond to M = Fe and Figure 2 b) to M = Mo. Figure 2(a) shows
clearly that the addition of Fe has a negative effect on the
GFA, independently of the amount of Fe added in the alloy, where by increasing the amount of Fe it leads to a decrease
Figure 1. a) Optical micrograph and b) Example of the image analyzes process made in one of the samples.
Table 1. Composition and diameters (in mm) of the samples
produced for OM analysis.
Composition x (in at. %)
0.10 0.50 1.00 1.50
Zr48Cu(48-x)Al4Mx
where M = Fe or Mo 2; 3; 4 2; 3; 4 2; 3; 4 2
Zr62Cu15.5Al10Ni(12.5-x) Nbx
2; 3;4;
5; 6; 7 3; 4 3; 4 3; 4
(Zr55Cu30Al10)100-xNbx 5; 6; 7 5; 6
2; 3; 4;
in the amorphous fraction. Figure 2(b), on the other hand, shows that an increase of the GFA happened with additions of Mo 0.5% at. For both cases, additions of Fe or Mo, when the value of microalloying was increased from 1.0 to 1.5
(at%), even for 2 mm samples it was not observed a significant
amorphous fraction, therefore, the parent composition was the limiting factor.
Figure 3 shows the comparison of our results with the
same based alloy studied with different Nb amounts10,12-13.
All the points were fixed for samples with 3 mm in diameter, as a base for comparison. It is possible to see that our
samples with the addition of Fe and Mo resulted in alloys with the least amount of amorphous phase formed. This
difference between our results and the literature has many possible explanations. The first, and most obvious, is the
alloy composition which indicates that the Nb additions
have a positive influence in the alloy’s GFA over Fe and
Mo additions. The other explanation can be related to the
oxygen content in the samples. It is well-known that the oxygen has a strong influence on GFA of Zr-based BMG14-17.
Once the literature used for the present comparison lacks
the information about the oxygen content of the samples
it is impossible to make an affirmation based only on the sample composition. Comparing the effect on GFA of our
samples with the literature, the addition of 1 at% of Nb on the Zr48Cu(48-x)Al4Mx seems to be the best option to enhance the GFA of this alloy.
The results for the composition of Zr62Cu15.5Al10Ni(12.5-x) Nbx can be seen in Fig. 4. For diameters above 4 mm, the
amorphous fraction measured was not significant, below 30%.
When considering 3 and 4 mm diameter samples however, it was possible to notice that the glass content decreased as
the value of the microalloying element increased. In other words, more additions of Nb tend to affect negatively the GFA. It is possible to assume that the critical cooling rate
(Rc) value for this composition increases drastically. The base alloy Zr62Cu15.5Al10Ni(12.5-x)Nbx, with x=0, is reported
Figure 2. a) Zr48Cu(48-x)Al4Fex with x = 0.1, 0.5, 1.0 and 1.5 % at.; b) Zr48Cu(48-x)Al4Mox with x = 0.1, 0.5, 1.0 and 1.5 % at.
Figure 3. Correlation between amorphous fraction and content of elements added for samples of 3.0 mm in diameter and general composition Zr48Cu(48-x)Al4Mx (M = Fe, Mo, Nb). Collected from
10,12-13
Figure 4. Correlation between amorphous fraction measured by OM
Campos et al.
4 Materials Research
to be feasible to produce a fully amorphous rod up to 5 mm in diameter18. In this study, we have found around 30% of amorphous fraction for the case of Nb addition (0.1 at%) at 5 mm. Therefore, it is possible to extrapolate that the
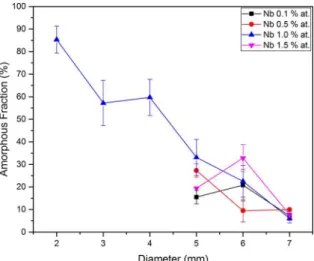
addition of Nb on the base alloy has not a positive effect. Fig. 5 displays the results of OM quantification of
(Zr55Cu30Al10)100-xNbx samples. As can be seen 5, 6 and 7 mm diameter samples presented amorphous content smaller than 30% for practically any content of Nb. A good result in terms of amorphous fraction was only observed for Nb = 1.0% and 2 mm diameter sample, meaning that our equipment was able to achieve cooling rates closer to the Rc of the alloy. When analyzing 3 and 4 mm samples, the amorphous fraction was measured between 47.5 and 67.5 %
for Nb = 1.0%. One drawback related to OM quantification in
samples with larger diameters is that the resolution decreases with the increase of sample size.
3.2 Oxygen content measurement
The compositions with the higher GFA had their oxygen content measured and the results are shown in Fig. 6. For each sample, there were 9 measurements of oxygen content. The
difference in average oxygen measured in these 2 different alloys cannot be based on the difference of the Zirconium
masses between the two alloys as proposed previously19. The two sample t-test failed to reject the null hypothesis. The alloy (Zr55Cu30Al10)99Nb1 has an average of 922 ppm of oxygen and a large dispersion compared to the alloy Zr62Cu15.5Al10Ni12.4Nb0.1, with an average of 981 ppm of oxygen. These results shows that both alloys have the same
oxygen content within a 95% confidence interval.
3.3 Scanning electron microscopy and differential
scanning calorimetry
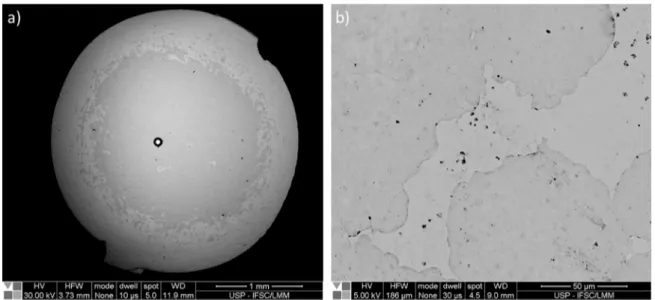
Figure 7 shows two BSE images from 3 mm samples of the alloys a) Zr48Cu47.9Al4Fe0.1 and b) Zr48Cu47.5Al4Mo0.5. From
the images it is clear the presence of a brighter amorphous matrix and darker crystalline phases. The same samples were analyzed by DSC and the results are showed at Table 2 and Figure 8, where the ratio of heat released in the crystallization event is the same as from the ratio of amorphous fraction
quantification by OM image analysis. The samples from 3
mm (Zr55Cu30Al10)99Nb1 and 6 mm (Zr55Cu30Al10)98.5Nb1.5 alloys are also being showed at Table 2 and Figure 8, and the
same effect of ratio in the heat released in the crystallization
event was the same as from the ratio of amorphous fraction
quantification by OM image analysis in these samples. This supports that the amorphous fraction quantification by OM
image analysis is a cheaper and valid process for measuring the GFA from the alloys that maintains the same fraction ratio from the heat released at the crystallization event from heating DSC analysis.
4. Conclusions
The present study performed on Zr48Cu(48-x)Al4Mx, where M = Fe or Mo, showed that the addition of this elements decrease the alloy’s GFA. The GFA of the Zr48Cu(48-x)Al4Mx system have been successfully improved with M = Nb as reported in the literature10,12-13. Therefore, our results show that
the use of Fe or Mo is not a viable alternative. In the second
part of our study, we tried to investigate whether the GFA improvement by the Nb microalloying could be extended to
other Zr-based systems. Our results show that the addition of
Nb from 0.1 at.% to 1.5 at.% in the Zr62Cu15.5Al10Ni(12.5-x)Nbx and the (Zr55Cu30Al10)100-xNbx alloys have a deleterious effect on the alloys’ GFA. Thus, the GFA improvement by the Nb microalloying is not an inherent feature on Zr-based BMG.
The oxygen measurements of the (Zr55Cu30Al10)99Nb1 and Zr62Cu15.5Al10Ni12.4Nb0.1 alloys have shown that the higher content of Zr in the later alloy do not increase the tendency to be contaminated with oxygen. This hypothesis has been raised in a previous study19 where the higher oxygen content
Figure 5. Correlation between amorphous fraction measured by OM
and content of elements added for samples of general composition (Zr55Cu30Al10)100-xNbx.
Figure 7. SEM BSE images from a) Zr48Cu47.9Al4Fe0.1 and b) Zr48Cu47.5Al4Mo0.5.
Table 2. DSC analysis showing the characteristic temperatures from the alloys, where the temperatures Tg = glass transition; Tx =
crystallization; ∆Tx = supercooled liquid region; ∆Hx = enthalpy at crystallization.
Alloys D (mm) T
g(K) Tx(K) ∆Tx(K) ∆Hx(J/g)
Zr48Cu47.9Al4Fe0.1 3 656 744 88 30.2
Zr48Cu47.5Al4Mo0.5 3 650 744 94 41.7
(Zr55Cu30Al10)99Nb1.0 3 665 733 68 54.4
(Zr55Cu30Al10)98.5Nb1.5 6 662 735 73 27.8
Figure 8. DSC heating curves for 3 mm Zr48Cu47.9Al4Fe0.1, Zr48Cu47.5Al4Mo0.5, (Zr55Cu30Al10)99Nb1 and 6 mm (Zr55Cu30Al10)98.5Nb1.5.
of the alloys with higher Zr content would be explained by the Zr gettering nature.
The amorphous fraction quantification by OM image
analysis is a cheaper and valid process for measuring the GFA from the alloys that maintains the same fraction ratio from the heat released at the crystallization event from heating DSC analysis.
5. Acknowledgements
The authors would like to thank Boeing Research & Technology Brazil (BR&T-Brazil) for the support for this research and for support of the University of Sao Paulo - Sao Carlos School of Engineering (EESC).
6. References
1. Zhu SL, Wang XM, Inoue A. Glass-forming ability and
mechanical properties of Ti-based bulk glassy alloys with large diameters of up to 1 cm. Intermetallics. 2008;16(8):1031-1035.
DOI: 10.1016/j.intermet.2008.05.006
2. Xie Z, Zhang Y, Yang Y, Chen X, Tao P. Effects of rare-earth
elements on the glass-forming ability and mechanical properties of Cu46Zr47-x Al7M x (M = Ce, Pr, Tb, and Gd) bulk metallic
glasses. Rare Metals. 2010;29(5):444-450. DOI: 10.1007/
s12598-010-0147-7
3. Zhai F, Pineda E, Duarte MJ, Crespo D. Role of Nb in
glass formation of Fe-Cr-Mo-C-B-Nb BMGs. Journal of
Alloys and Compounds. 2014;604:157-163. DOI: 10.1016/j.
jallcom.2014.03.095
4. Guo SF, Chan KC, Jiang XQ, Zhang HJ, Zhang DF, Wang JF, et al. Atmospheric RE-free Mg-based bulk metallic glass with high bio-corrosion resistance. Journal of Non-Crystalline Solids.
Campos et al.
6 Materials Research
5. Deng L, Zhou B, Yang H, Jiang X, Jiang B, Zhang X. Roles of minor rare-earth elements addition in formation and
properties of Cu-Zr-Al bulk metallic glasses. Journal of
Alloys and Compounds. 2015;632:429-434. DOI: 10.1016/j.
jallcom.2015.01.036
6. Park JM, Park JS, Na JH, Kim DH, Kim DH. Effect of Y
addition on thermal stability and the glass forming ability
in Fe-Nb-B-Si bulk glassy alloy. Materials Science and
Engineering: A. 2006;435-436:425-428. DOI: 10.1016/j.
msea.2006.07.073
7. Jang JSC, Tseng CC, Chang LJ, Chang CF, Lee WJ, Huang JC, et al. Glass Forming Ability and Thermal Properties of the Mg-Based Amorphous Alloys with Dual Rare Earth Elements
Addition. Materials Transactions. 2007;48(7):1684-1688.
DOI: 10.2320/matertrans.MJ200738
8. Chen J, Zhang Y, He JP, Yao KF, Wei BC, Chen GL. Metallographic analysis of Cu-Zr-Al bulk amorphous alloys with yttrium addition. Scripta Materialia.
2006;54(7):1351-1355. DOI: 10.1016/j.scriptamat.2005.12.002
9. Luo J, Duan H, Ma C, Pang S, Zhang T. Effects of Yttrium
and Erbium Additions on Glass-Forming Ability and Mechanical Properties of Bulk Glassy Zr-Al-Ni-Cu Alloys. Materials Transactions. 2006;47(2):450-453. DOI: 10.2320/
matertrans.47.450
10. Wu FF, Chan KC, Jiang SS, Chen SH, Wang G. Bulk metallic glass composite with good tensile ductility, high strength and large elastic strain limit. Scientific Reports. 2014;4:5302.
DOI: 10.1038/srep05302
11. Cheng JL, Chen G, Liu CT, Li Y. Innovative approach to the
design of low-cost Zr-based BMG composites with good glass
formation. Scientific Reports. 2013;3:2097. DOI: 10.1038/
srep02097
12. Ning Z, Liang W, Zhang M, Li Z, Sun H, Liu A, et al. High tensile plasticity and strength of a CuZr-based bulk metallic glass composite. Materials & Design. 2016;90:145-150.
DOI: http://dx.doi.org/10.1016/j.matdes.2015.10.117
13. Wu FF, Chan KC, Chen SH, Jiang SS, Wang G. ZrCu-based bulk metallic glass composites with large strain-hardening capability. Materials Science and Engineering: A.
2015;636:502-506. DOI: http://dx.doi.org/10.1016/j.msea.2015.04.027
14. Castellero A, Bossuyt S, Stoica M, Deledda S, Eckert J, Chen GZ,
et al. Improvement of the glass-forming ability of Zr55Cu30Al10Ni5 and Cu47Ti34Zr11Ni8 alloys by electro-deoxidation of the melts. Scripta Materialia. 2006;55(1):87-90. DOI: 10.1016/j. scriptamat.2006.03.032
15. Gebert A, Eckert J, Schultz L. Effect of oxygen on phase formation
and thermal stability of slowly cooled Zr65Al7.5Cu17.5Ni10 metallic glass. Acta Materialia. 1998;46(15):5475-5482. DOI: https://doi. org/10.1016/S1359-6454(98)00187-6
16. Liu CT, Chisholm M, Miller MK. Oxygen impurity and microalloying effect in a Zr-based bulk metallic glass alloy. Intermetallics.
2002;10(11-12):1105-1112. DOI:
https://doi.org/10.1016/S0966-9795(02)00131-0
17. Kündig AA, Lepori D, Perry AJ, Rossmann S, Blatter A, Dommann
A, et al. Influence of Low Oxygen Contents and Alloy Refinement
on the Glass Forming Ability of Zr52.5Cu17.9Ni14.6Al10Ti5. Materials Transactions. 2002;43(12):3206-3210. DOI: http://doi.org/10.2320/
matertrans.43.3206
18. Liu YH, Wang G, Wang RJ, Zhao DQ, Pan MX, Wang WH. Super Plastic Bulk Metallic Glasses at Room Temperature. Science.
2007;315(5817):1385-1388. DOI: 10.1126/science.1136726 19. Déo LP, de Oliveira MF. Accuracy of a selection criterion for
glass forming ability in the Ni-Nb-Zr system. Journal of Alloys and Compounds. 2014;615(Suppl 1):S23-S28. DOI: https://doi.
org/10.1016/j.jallcom.2013.11.194
20. Peker A, Johnson WL. A highly processable metallic glass: Zr41.2Ti13.8Cu12.5Ni10.0Be22.5. Applied Physics Letters. 1993;63(17):2342-2344.
21. Andreoli AF, Ponsoni JB, Soares C, de Oliveira MF, Kiminami
CS. Resistance upset welding of Zr-based bulk metallic glasses. Journal of Materials Processing Technology. 2018;255:760-764.
DOI: 10.1016/j.jmatprotec.2018.01.034
22. Xi XK, Wang RJ, Zhao DQ, Pan MX, Wang WH. Glass-forming Mg-Cu-RE (RE = Gd, Pr, Nd, Tb, Y, and Dy) alloys with strong oxygen resistance in manufacturability. Journal of Non-Crystalline Solids. 2004;344(3):105-109. DOI: 10.1016/j.jnoncrysol.2004.07.056
23. Conner RD, Maire RE, Johnson WL. Effect of oxygen concentration
upon the ductility of amorphous Zr57Nb5Al10Cu15.4Ni12.6. Materials Science and Engineering: A. 2006;419(1-2):148-152. DOI: