Genetic evaluation and selection in
Jatropha
curcas
L.
Poliane Marcele Ribeiro Cardoso
1*, Luiz Antônio dos Santos
Dias
1, Marcos Deon Vilela de Resende
2, Ricardo Galvão de
Freitas
3, Thais Roseli Corrêa
1, Dandara Rêgo Muniz
1and
Iasmine Ramos Zaidan
1Abstract: J. curcas (physic nut) is one of the most promising oilseeds for biofuel
production and the knowledge about genetic parameter estimates is important for its breeding. Here, we evaluated 121 families, from 48 to 60 months of age, aiming genetic evaluation and selection. The trial was set up in an 11 x 11 lat
-tice design, with three replications and 4-plant plot. The traits evaluated were fruit yield (FY), grain (GY) and oil yield (OY), fruit husk percentage (FH) and seed oil content (OC). Individual heritabilities were low (0.19 to 0.23), requiring accurate selection and improvement methods. Moderate repeatabilities were observed for FY (0.54), GY (0.52), OC (0.30) and OY (0.51), indicating that the families evaluated maintained relative superiority over the years. With selection of the 20 best individuals, the predicted genotypic gains (66%) were greater than the additive gains (56%), indicating greater possibilities of success from cultivation of clones.
Key words:Physic nut, biodiesel, biokerosene, genetic parameters, grain yield
and components, variability.
Crop Breeding and Applied Biotechnology 18: 192-199, 2018 Brazilian Society of Plant Breeding. Printed in Brazil
http://dx.doi.org/10.1590/1984-70332018v18n2a27 ARTICLE
*Corresponding author:
E-mail: [email protected]
Received: 09 October 2017 Accepted: 22 November 2017
1 Universidade Federal de Viçosa (UFV), Departamento de Fitotecnia, 36.560-900, Viçosa, MG, Brazil
2 Embrapa Florestas. Current adress: UFV,
Departamento de Engenharia Florestal
3 Monsanto, 76.650-000, Morrinhos, GO,
Brazil INTRODUCTION
The increase in CO2 in the atmosphere over the past decades has promoted a growing interest in using clean and renewable fuel. Thus, the biofuel market is on the rise, motivated by the need for reducing dependence on petroleum and its derivatives and opting for sustainable development. Brazil has great potential for production of liquid biofuels over a large part of its territory due to its edaphic and climatic characteristics, biodiversity (various potential species for biofuel production adapted to different climates and biomes), availability of arable land and labor, as well as proven technical competence in the field of crop science (Dias et al. 2008).
The main raw materials used for production of biodiesel and biokerosene biofuels in Brazil, in January 2017, are soybean (65%), animal fat (30%), and oil palm (2.5%), and other materials are responsible for only 2.5% of this production (ANP 2017). Therefore, there is the need to diversify production of raw materials through introduction of promising species, such as Jatropha curcas L. Compared to other alternative oilseeds, J. curcas has the advantages
of not being a food species and having high grain (5 t ha-1) and oil (1.9 t ha-1)
biodiesel and biokerosene, such as high oleic acid content (Dias 2011). Although it is a potential species, its genetic improvement is recent and has not yet resulted in improved cultivars (Laviola et al. 2010, Dias 2011, Freitas et al. 2011, Rocha et al. 2012). Low grain yield, lack of fruit maturity uniformity and of cultivars with higher grain yield limit its competitiveness (Dias et al. 2007, Dias et al. 2012). Overview on J. curcas breeding have been reported by Montes and
Melchinger (2016) and Peixoto et al. (2017).
The existence of genetic variability in the population is a basic premise for obtaining gains from selection. In this regard, important instruments for plant breeders have been estimates of genetic parameters and prediction of genetic gain from selection of families and individuals. For this purpose, the REM/BLUP genetic evaluation method, beyond traditional method, has been used in various studies involving families, populations, and clones of J. curcas (Abreu et
al. 2009, Juhász et al. 2010, Freitas et al. 2011, Laviola et al. 2012, Rocha et al. 2012, Borges et al. 2014, Spinelli et al. 2014, 2015, Freitas et al. 2016).
The aims of this study were: i) estimation of genetic parameters for characterization of the genetic structure of a population of Jatropha curcas L. and the study of genetic control of traits, and ii) prediction of genetic gains from
selection of individuals and clones.
MATERIAL AND METHODS
The trial was set up in December 2008 in the experimental field of the Universidade Federal de Viçosa (UFV) in Araponga (lat 20° 39ʹ S, long 42° 32ʹ W, alt 823 m asl), MG, Brazil. According to Köppen classification, the climate of the region is Cwb, subtropical/tropical of altitude, featuring dry winter and hot summer and annual rainfall between 1,300 and 1,500 mm. The soil is classified as dystrophic red-yellow Latosol.
The performance of 121 open pollinated families (with one control) was evaluated, assuming to be half-sib families. An 11 × 11 lattice experimental design was used at a spacing of 2 × 2 m, with three replications and four plants per plot, for a total of 1452 plants. The families were selected phenotypically, based on plant size, plant health, and fruit load in a commercial field of six thousand plants in the municipality of Viçosa, MG, Brazil. The control consisted of the material most planted at that time. The seeds that gave rise to these mother plants were acquired from the pioneer producer Nagashi Tominaga, who produced and distributed their seeds throughout Brazil. Management practices of the experiment were based on the recommendations of Dias et al. (2007).
The traits evaluated in the 2012/13 and 2013/14 crop years, which corresponded to the fourth and fifth years of cultivation, respectively (plants at 48 to 60 months of age), were: fruit yield (FY), grain yield (GY), at 11% moisture content, and oil yield (OY), in kg ha-1, and fruit husk percentage (FH) and seed oil content (OC), in %.
Harvest of the fruits was carried out at the final stage of maturation for evaluation of FY. Mature fruits of yellow and brown were harvested in the plants and on the ground around the plant. After that, they were dried at 60 °C in a forced air circulation oven for 48 hours. The fruit production from each plant was weighed and noted, and then the fruits were processed and quantified in regard to GY. A random sample of 100 fruits was weighed so as to quantify the FH through the following expression [(weight of the husk from 100 fruits/weight of 100 fruits) x 100]. After that, the seed trait OC, in %, was evaluated by the nuclear magnetic resonance method (Oxford Instruments) in the Oilseed Breeding Laboratory in the Plant Science Department of UFV. Then, the OY trait was obtained through the expression [(GY x OC)/100].
The statistical analyses were processed using the SELEGEN-REM/BLUP software (Resende 2007a, 2016). The equation of the mixed model used to resolve the genetic model presented below is described in detail in Resende (2007a). For combined analysis of the crop years, based on repeatability and longitudinal data, the model for half-sib families in a lattice design was used, with various plants per plot and only one location and repeated measurements (model 67 of the SELEGEN-REM/BLUP software). The statistical model adopted was:
y = Xm + Za + Wp + Qs + Tb + e
in which:
m: vector of the effects of the measurement-replication combinations (assumed as fixed) added to the overall mean;
a: vector of the individual additive genetic effects (assumed as random);
p: vector of the plot effects (assumed as random);
s: vector of the permanent effects (random);
b: vector of the block effects (assumed as random);
e: vector of errors or residues (random).
The uppercase letters X, Z, W, Q, and T represent the incidence matrices for the aforementioned effects.
The estimates of genotypic correlations among traits and cluster analysis of families by the Tocher method, using the Mahalanobis distance, were processed using model 104 of the SELEGEN-REM/BLUP software.
RESULTS AND DISCUSSION
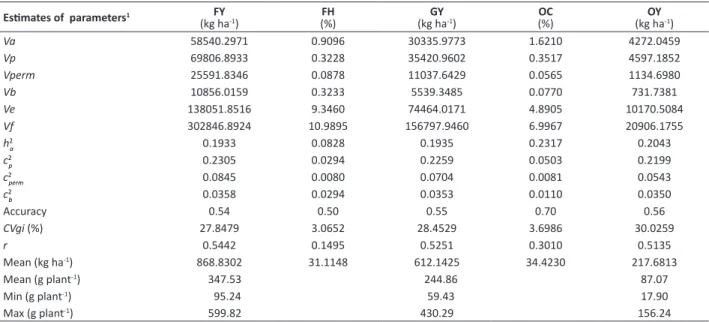
In general, expressive genetic availability was observed among the families under study (Table 1). The coefficients of genetic variation (CVgi) were 27.85%, 3.07%, 28.45%, 3.70%, and 30.03% for FY, FH, GY, OC, and OY, respectively. In
particular the target trait (OY) of the breeding program presented high CVgi. Estimates of heritability (h2
a) were of low magnitudes, from 0.19 to 0.23, requiring accurate improvement and selection methods for all the traits. According to the classification of Resende (2002b), values of selective accuracies were from moderate to high for FY (0.54), FH (0.50), GY (0.55), OC (0.70), and OY (0.56), showing satisfactory precision for selection.
In perennial plants, estimation of genetic parameters must consider measurements over time, and plants at a productive age (Resende 2002b), however few studies show results that meet these conditions. Rocha et al. (2012) also found that few studies that take repeated measurements and evaluation of plants at a productive age into consideration in estimating genetic components and gains from selection. In this sense, the present study is one of the few to estimate genetic parameters in productive plants of J. curcas and with two consecutive years of production.
Table 1. Estimates of genetic parameters for fruit yield (FY), grain yield (GY), and oil yield (OY), and fruit husk percentage (FH) and
seed oil content (OC), through combined analysis in 2012/13 and 2013/14, in 121 families of Jatropha curcas L.
Estimates of parameters1 FY
(kg ha-1) (%)FH (kg haGY-1) OC(%) (kg haOY-1)
Va 58540.2971 0.9096 30335.9773 1.6210 4272.0459
Vp 69806.8933 0.3228 35420.9602 0.3517 4597.1852
Vperm 25591.8346 0.0878 11037.6429 0.0565 1134.6980
Vb 10856.0159 0.3233 5539.3485 0.0770 731.7381
Ve 138051.8516 9.3460 74464.0171 4.8905 10170.5084
Vf 302846.8924 10.9895 156797.9460 6.9967 20906.1755
h2
a 0.1933 0.0828 0.1935 0.2317 0.2043
c2
p 0.2305 0.0294 0.2259 0.0503 0.2199
c2
perm 0.0845 0.0080 0.0704 0.0081 0.0543
c2
b 0.0358 0.0294 0.0353 0.0110 0.0350
Accuracy 0.54 0.50 0.55 0.70 0.56
CVgi (%) 27.8479 3.0652 28.4529 3.6986 30.0259
r 0.5442 0.1495 0.5251 0.3010 0.5135
Mean (kg ha-1) 868.8302 31.1148 612.1425 34.4230 217.6813
Mean (g plant-1) 347.53 244.86 87.07
Min (g plant-1) 95.24 59.43 17.90
Max (g plant-1) 599.82 430.29 156.24
1Va: additive genetic variance; Vp: environmental variance between plots; Vperm: variance of permanent effects; Vb: environmental variance between blocks; Ve: residual
variance; Vf: individual phenotypic variance; h2a: individual heritability in the narrow sense (of the additive effects); c2p: coefficient of determination of the plot effects; c2perm:
Grain yield in J. curcas is one of the most important traits for plant selection (Spinelli et al. 2010, Rocha et al. 2012)
and is related not only to crop management in the field or genetic potential, but also to age of the plant, since J. curcas
is a perennial species. According to Laviola and Dias (2008), J. curcas begins fruit production already in the first year of
growth, although it reaches peak production as of the fourth year, with potential productive capacity around 40 years. The present study evaluated plants at 48 to 60 months of growth, with mean grain yield of 244.86 g plant-1, ranging
from 59.43 to 430.29 g plant-1 (Table 1). Studies in different regions and cultivation ages were recorded in the literature,
demonstrating variability for genotype productivity and low yield of the species due to the lack of improved cultivars. Rao et al. (2008) reported a yield range from 36.6 to 263.97 g, with a mean value of 147.8 g at 60 months of growth, in India. Bhering et al. (2013) found grain yield of 175.95 g, ranging from 57.11 g to 537.10 g, in plants at 20 months of growth. Freitas et al. (2016) related an average yield of 377.9 g, ranging from 169.8 g to 772.1 g, at 52 months of cultivation.
Repeatability indicates the possibility of selecting genotypes that maintain their superiority over the years. Interpretation of measurements over time is fundamental for characterization of productive performance of perennial plants due to their long reproductive cycle and differentiated expression of traits over time (Resende 2002b). In the present study, medium repeatabilities (0.30 < r < 0.60) are reported,according to the classification of Resende (2002b), for the traits FY (0.54), GY (0.52), OC
(0.30), and OY (0.51), indicating that the families evaluated maintain relative superiority over the years, an inference based on the mean value of two measurements or harvests (Table 1). In J. curcas, Teodoro et al. (2016) reported as
necessary at least four measurements for accurate evaluation of the traits, due to the cyclical behavior of the genera (increase of the values measured over time). Spinelli et al. (2015) observed a coefficient of repeatability of 0.52 for grain yield with three consecutive annual measurements. Laviola et al. (2013) verified low repeatability (0.37) for yield with four measurements, suggesting seven as ideal. When a repeatability study is performed with yield in plants not
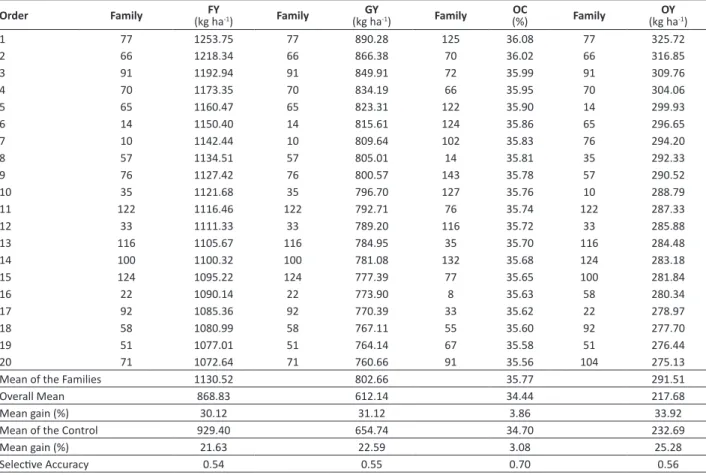
Table 2.Predicted genetic gain from selection of the 20 best families of Jatropha curcas L. for fruit yield (FY), grain yield (GY), seed
oil content (OC), and oil yield (OY), evaluated over two crop years
Order Family (kg haFY -1) Family (kg haGY -1) Family (%)OC Family (kg haOY -1)
1 77 1253.75 77 890.28 125 36.08 77 325.72
2 66 1218.34 66 866.38 70 36.02 66 316.85
3 91 1192.94 91 849.91 72 35.99 91 309.76
4 70 1173.35 70 834.19 66 35.95 70 304.06
5 65 1160.47 65 823.31 122 35.90 14 299.93
6 14 1150.40 14 815.61 124 35.86 65 296.65
7 10 1142.44 10 809.64 102 35.83 76 294.20
8 57 1134.51 57 805.01 14 35.81 35 292.33
9 76 1127.42 76 800.57 143 35.78 57 290.52
10 35 1121.68 35 796.70 127 35.76 10 288.79
11 122 1116.46 122 792.71 76 35.74 122 287.33
12 33 1111.33 33 789.20 116 35.72 33 285.88
13 116 1105.67 116 784.95 35 35.70 116 284.48
14 100 1100.32 100 781.08 132 35.68 124 283.18
15 124 1095.22 124 777.39 77 35.65 100 281.84
16 22 1090.14 22 773.90 8 35.63 58 280.34
17 92 1085.36 92 770.39 33 35.62 22 278.97
18 58 1080.99 58 767.11 55 35.60 92 277.70
19 51 1077.01 51 764.14 67 35.58 51 276.44
20 71 1072.64 71 760.66 91 35.56 104 275.13
Mean of the Families 1130.52 802.66 35.77 291.51
Overall Mean 868.83 612.14 34.44 217.68
Mean gain (%) 30.12 31.12 3.86 33.92
Mean of the Control 929.40 654.74 34.70 232.69
Mean gain (%) 21.63 22.59 3.08 25.28
yet stable, that is, for the production initial, low accuracy estimates can be found. Measurements in the early stages, where there is no complete manifestation of the genetic potential of the studied genotypes, can increase the estimate of repeatability (Laviola et al. 2013).
In selection of the 20 best families, the traits fruit yield (FY), grain yield (GY), seed oil content (OC), and oil yield (OY) contributed 30%, 31%, 4%, and 34%, respectively, to predicted mean gain compared with the overall mean (Table 2). In relation to the control, the gains were 22%, 23%, 3%, and 25%, respectively. The traits exhibited selective
accuracies of 0.54, 0.55, 0.70, and 0.56, respectively. In early selection (second crop) of the 20 best families of J. curcas,
Laviola et al. (2012) observed predicted genetic gain of 48%, with selective accuracy of 0.79 for grain yield.
Given the magnitude of genetic gain for the trait OY (34%) and considering that this is the final product of interest for biodiesel and biokerosene production, the selection of individuals and clones based on OY is recommended here. Nevertheless, from the practical point of view, OY is a difficult trait to measure and was obtained from combination of the GY and OC traits. Spinelli et al. (2010) considered that grain yield (GY) is one of the most important traits for plant selection in Jatropha curcas with greater oil yield. In this respect, it is important to establish the genotypic correlation
of GY with the other traits. Positive genotypic correlations of greater magnitudes were observed between GY and FY (0.99), GY and OY (0.99), and FY and OY (0.99), indicating that it is possible to increase the GY by mean of indirect selection for FY and OY, and increase FY by mean of OY (Table 3). The OC showed positive genotypic correlation values of medium magnitude with OY (0.57), FY (0.53), and GY (0.53). Biabani et al. (2012) found negative correlation (-0.59) between oil content and grain yield per plant, indicating that undertaking selection based on oil content does not lead to an increase in grain yield, in contrast with our study.
Table 3. Estimates of genotypic correlations between fruit yield
(FY), grain yield (GY), seed oil content (OC), and oil yield (OY), in
Jatropha curcas L., evaluated over two crop years
Trait FY GY OC OY
FY 1 0.9987* 0.5318* 0.9960*
GY 1 0.5309* 0.9976*
OC 1 0.5685*
OY 1
* Significant at 5% probability by the t test.
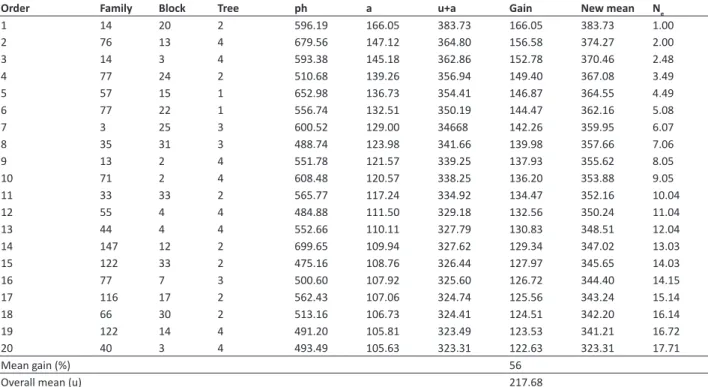
Table 4. Phenotypic values (ph), additive genetic values (a), means plus additive genetic values (u+a), predicted mean gain, new mean
of the population, and effective size (Ne) for selection of the 20 best individuals of Jatropha curcas L., based on additive genetic value, considering oil yield, in kg ha-1, evaluated over two crop years
Order Family Block Tree ph a u+a Gain New mean Ne
1 14 20 2 596.19 166.05 383.73 166.05 383.73 1.00
2 76 13 4 679.56 147.12 364.80 156.58 374.27 2.00
3 14 3 4 593.38 145.18 362.86 152.78 370.46 2.48
4 77 24 2 510.68 139.26 356.94 149.40 367.08 3.49
5 57 15 1 652.98 136.73 354.41 146.87 364.55 4.49
6 77 22 1 556.74 132.51 350.19 144.47 362.16 5.08
7 3 25 3 600.52 129.00 34668 142.26 359.95 6.07
8 35 31 3 488.74 123.98 341.66 139.98 357.66 7.06
9 13 2 4 551.78 121.57 339.25 137.93 355.62 8.05
10 71 2 4 608.48 120.57 338.25 136.20 353.88 9.05
11 33 33 2 565.77 117.24 334.92 134.47 352.16 10.04
12 55 4 4 484.88 111.50 329.18 132.56 350.24 11.04
13 44 4 4 552.66 110.11 327.79 130.83 348.51 12.04
14 147 12 2 699.65 109.94 327.62 129.34 347.02 13.03
15 122 33 2 475.16 108.76 326.44 127.97 345.65 14.03
16 77 7 3 500.60 107.92 325.60 126.72 344.40 14.15
17 116 17 2 562.43 107.06 324.74 125.56 343.24 15.14
18 66 30 2 513.16 106.73 324.41 124.51 342.20 16.14
19 122 14 4 491.20 105.81 323.49 123.53 341.21 16.72
20 40 3 4 493.49 105.63 323.31 122.63 323.31 17.71
Mean gain (%) 56
Selection of the best individuals based on additive genetic value (sexual mating system) and on genotypic value (asexual propagation system) in J. curcas should be studied by breeders with plant yield in a climax, so as to obtain
advances from plant breeding of the species. Laviola et al. (2012) reported early selection for grain yield in genotypes of J. curcas at 24 months, aiming the sexual propagation of plants. For grain production, Borges et al. (2014) verified the
selection of provenances, aiming the asexual propagation of plants with 12, 24 and 36 months of field. In the present study, we present the selection of families based on phenotypic data and referring to the best individuals and clones for oil productivity, in plants with 48 and 60 months of age.
Selection of the 20 best individuals, aiming at sexual propagation, that is, transforming the families into a seed orchard through seedlings, was represented by 16 families, leading to predicted mean gain of 56% (Table 4). After one selection cycle, the new mean of the population is raised from 217.68 to 323.31 kg ha-1 of OY, with effective population size of
17.71, sufficient to prevent the occurrence of inbreeding depression in the generation planted. Genetic gain predicted as based on additive genetic value for selection of individuals, considering the OY trait (56%), was greater than the gain predicted from selection of the best families (34%) for the same trait, indicating that selection of the best individuals is a more adequate strategy than selecting superior families.
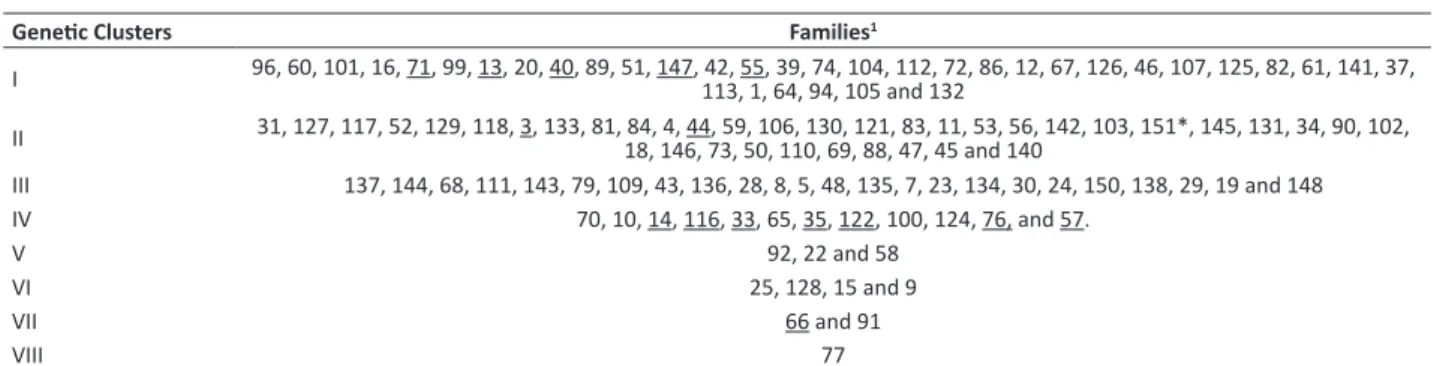
It should be noted that the additive genetic values are also useful in planning crosses for evaluation in the next selective cycle. In breeding program, forming the breeding population is one of the most important steps. This population may be composed of previously selected parents that represent the genetic diversity of the species (Bhering et al. 2011). In this respect, genetic clustering of the families guides the crosses to be made (Table 5). In this study, formation of eight distinct clusters of families was examined, containing the 16 families selected as based on additive genetic value. Cluster IV had the largest number of families (seven), followed by cluster I (five), cluster II (two), and clusters VII and VIII (one family each). The cross between selected individuals belonging to families of different clusters should be emphasized with a view to increasing the probability of obtaining high specific combining ability or heterosis (Resende 2007b). Thus exceptional full-sib families can be generated, with the aim of selecting heterotic hybrids, and establishing them through cloning.
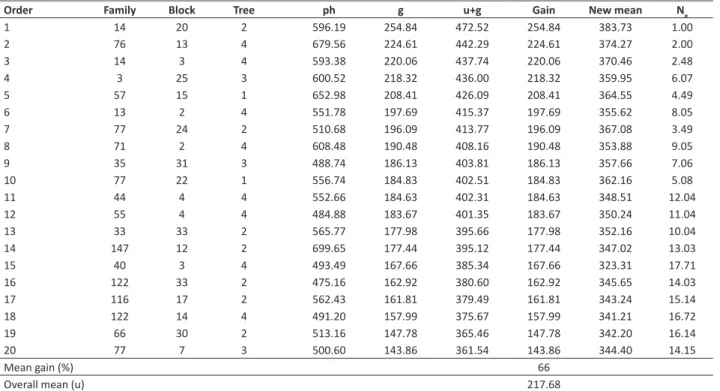
Selection of the 20 best clones for the purpose of asexual propagation consisted of 16 families and provided mean gain of 66%, raising the mean of the population from 217.68 to 344.40 kg ha-1 of oil, with effective size of 14.15, sufficient
for maintaining genetic variability and obtaining gains in subsequent selection cycles (Table 6).
Predicted genotypic gain (66%) was greater than additive genetic gain (56%), which may indicate greater possibilities of gains from setting up cultivation of clones. Nevertheless, it should be emphasized that selection of the best individuals based on the propagation system (asexual or sexual) is closely linked to the purposes of the breeding program for the species. If the objective is transformation of families into a seed orchard through seedlings, individuals should be selected based on additive genetic value. If the objective is supplying material for setting up clonal tests and subsequent establishment of cultivation of clones, then individuals should be selected based on genotypic value so that maximization of genetic gain occurs.
Table 5.Genetic clustering of 121 families of Jatropha curcas L. by the Tocher method, based on the matrix of Mahalanobis distance
Genetic Clusters Families1
I 96, 60, 101, 16, 71, 99, 13, 20, 40, 89, 51, 147, 42, 55, 39, 74, 104, 112, 72, 86, 12, 67, 126, 46, 107, 125, 82, 61, 141, 37,
113, 1, 64, 94, 105 and 132
II 31, 127, 117, 52, 129, 118, 3, 133, 81, 84, 4, 44, 59, 106, 130, 121, 83, 11, 53, 56, 142, 103, 151*, 145, 131, 34, 90, 102, 18, 146, 73, 50, 110, 69, 88, 47, 45 and 140 III 137, 144, 68, 111, 143, 79, 109, 43, 136, 28, 8, 5, 48, 135, 7, 23, 134, 30, 24, 150, 138, 29, 19 and 148 IV 70, 10, 14, 116, 33, 65, 35, 122, 100, 124, 76, and 57.
V 92, 22 and 58
VI 25, 128, 15 and 9
VII 66 and 91
VIII 77
FINAL CONSIDERATIONS
This study presents the first evaluation of variability and simulation of selection of individuals and clones of Jatropha curcas L. based on data from plants at 48 to 60 months of age. Combined analysis of the two crop years manifested
individual heritabilities (h2a) of low magnitudes, from 0.19 to 0.23, requiring accurate selection methods. Estimated values
of repeatability (r > 0.51) were shown by the traits FY, GY, and OY, indicating that two consecutive measurements or
harvests are sufficient, since the families evaluated maintained their relative performances over two years. In predicting genetic gain from selection of the 20 best families, a 34% increase in oil yield, with selective accuracy of 0.56, was observed. Selection of the 20 best individuals for additive genetic value (seeds) resulted in a 56% increase in oil yield. With selection involving the 20 best individuals for genotypic value (clones), the gain in oil yield was 66%. Individuals coinciding for seed and clone selection were 14 20 2, 76 13 4, 14 3 4, 57 15 1, 55 4 4, 147 12 2, and 116 17 2, representing family, block, and tree, respectively.
This set of results strengthens the J. curcas plant breeding program of the Universidade Federal de Viçosa and
identifies the most adequate plants for crosses and for cloning aiming to bring about predicted genetic gains. ACKNOWLEDGMENTS
Research supported by FAPEMIG (Fundação de Amparo à Pesquisa do Estado de Minas Gerais), CNPq (Conselho Nacional de Desenvolvimento Científico e Tecnológico) and CAPES (Coordenação de Aperfeiçoamento de Pessoal de Nível Superior). The authors thank the team of the Oilseed Breeding Laboratory for their help in data collection and two anonymous reviewers for their important suggestions and corrections.
Table 6.Phenotypic values (ph), genotypic values (g), means plus genotypic values (u+g), predicted mean gain, new mean of the
population, and effective size (Ne) for selection of the 20 best clones of Jatropha curcas L., based on genotypic value, considering oil
yield, in kg ha-1, evaluated over two crop years
Order Family Block Tree ph g u+g Gain New mean N
e
1 14 20 2 596.19 254.84 472.52 254.84 383.73 1.00
2 76 13 4 679.56 224.61 442.29 224.61 374.27 2.00
3 14 3 4 593.38 220.06 437.74 220.06 370.46 2.48
4 3 25 3 600.52 218.32 436.00 218.32 359.95 6.07
5 57 15 1 652.98 208.41 426.09 208.41 364.55 4.49
6 13 2 4 551.78 197.69 415.37 197.69 355.62 8.05
7 77 24 2 510.68 196.09 413.77 196.09 367.08 3.49
8 71 2 4 608.48 190.48 408.16 190.48 353.88 9.05
9 35 31 3 488.74 186.13 403.81 186.13 357.66 7.06
10 77 22 1 556.74 184.83 402.51 184.83 362.16 5.08
11 44 4 4 552.66 184.63 402.31 184.63 348.51 12.04
12 55 4 4 484.88 183.67 401.35 183.67 350.24 11.04
13 33 33 2 565.77 177.98 395.66 177.98 352.16 10.04
14 147 12 2 699.65 177.44 395.12 177.44 347.02 13.03
15 40 3 4 493.49 167.66 385.34 167.66 323.31 17.71
16 122 33 2 475.16 162.92 380.60 162.92 345.65 14.03
17 116 17 2 562.43 161.81 379.49 161.81 343.24 15.14
18 122 14 4 491.20 157.99 375.67 157.99 341.21 16.72
19 66 30 2 513.16 147.78 365.46 147.78 342.20 16.14
20 77 7 3 500.60 143.86 361.54 143.86 344.40 14.15
Mean gain (%) 66
Overall mean (u) 217.68
REFERENCES
Abreu FB, Resende MDV, Anselmo JL, Saturnino HM, Brenha JAM and Freitas FB (2009) Variabilidade genética entre acessos de pinhão-manso na fase juvenil. Magistra 21: 36-40.
ANP – Agência Nacional do Petróleo, Gás e Biocombustíveis/ Superintendência de refino, processamento de gás natural e
produção de biocombustíveis (2017) Boletim mensal do biodiesel.
Bhering LL, Barrera CF, Ortega D, Laviola BG, Alves AA, Rosado TB and Cruz
CD (2013) Differential response of Jatropha genotypes to different
selection methods indicates that combined selection is more suited
than other methods for rapid improvement of the species. Industrial
Crops and Products 41: 260-265.
Bhering LL, Cruz CD and Laviola BG (2011) Biometria aplicada ao melhoramento de espécies alternativas para produção de biodiesel.
In Cardoso DL, Luz LN and Pereira TNS (eds) Estratégias em
melhoramento de plantas. Arka, Viçosa, p. 90-119.
Biabani A, Rafii MY, Saleh GB, Shabanimofrad M and Latif MA (2012) Phenotypic and genetic variation of Jatropha curcas L populations
from different countries. Maydica 57: 164-171.
Borges CV, Ferreira FM, Rocha RB, Santos AR, Laviola BG (2014) Productive capacity and genetic progress of physic nut. Ciência Rural 44: 64-70.
Dias LAS (2011) Biofuel plant species and the contribution of genetic
improvement. Crop Breeding and Applied Biotechnology 11(S1):
16-26.
Dias LAS, Leme L, Laviola B, Pallini Filho A, Pereira O, Carvalho M, Manfio
C, Santos A, Sousa L and Oliveira T (2007) Cultivo de pinhão-manso
(Jatropha curcas L.) para produção de óleo combustível. Suprema,
Viçosa, 40p.
Dias LAS, Missio RF and Dias DCFS (2012) Antiquity, botany, origin and
domestication of Jatropha curcas (Euphorbiaceae), a plant species
with potential for biodiesel production. Genetics and Molecular
Research 11: 2719-2718.
Dias LAS, Muller M and Freire E (2008) Potencial do uso de oleaginosas arbóreas em sistemas silvipastoris. In Fernandes EM, Paciullo DSC,
Castro CRT, Muller MD, Arcuri PB and Carneiro JC (Org) Sistemas
agrossilvipastoris na América do Sul: desafios e potencialidades. Embrapa Gado de Leite, Juiz de Fora, p. 283-314.
Freitas RG, Dias LAS, Cardoso PMR, Evaristo AB, Silva MF and Araújo NM (2016) Diversity and genetic parameter estimates for yield and its
components in Jatropha curcas L. Genetics and Molecular Research
15: 1-10.
Freitas RG, Missio RF, Matos FS, Resende MDV and Dias LAS (2011) Genetic
evaluation of Jatropha curcas: an important oilseed for biodiesel
production. Genetics and Molecular Research 10: 1490-1498.
Juhász ACP, Morais DLB, Soares BO, Pimenta S, Oliveira R and Resende MDV (2010) Parâmetros genéticos e ganho com a seleção para
populações de pinhão manso (Jatropha curcas). Pesquisa Florestal
Brasileira 30: 25-35.
Laviola BG and Dias LAS (2008) Teor e acúmulo de nutrientes em folhas
e frutos de pinhão-manso. Revista Brasileira de Ciência do Solo 32:
1969-1975.
Laviola BG, Alves AA, Gurgel FL, Rosado TB, Rocha RB and Albrecht JC (2012) Estimates of genetic parameters for physic nut traits based
in the germplasm two years evaluation. Ciência Rural 42: 429-435.
Laviola BG, Rocha RB, Kobayashi AK, Rosado TB and Bhering LL (2010)
Genetic improvement of Jatropha for biodiesel production. Ceiba
51: 1-10.
Laviola BG, Oliveira AMC, Bhering LL, Alves AA, Rocha RB, Gomes BEL and Cruz CD (2013) Estimates of repeatability coefficients and selection gains in Jatropha indicate that higher cumulative genetic gains can be obtained by relaxing the degree of certainty in predicting the best families. Industrial Crops and Products 51: 70-76.
Montes JM and Melchinger AE (2016) Domestication and breeding of Jatropha curcas L. Trends in Plant Science 21: 1045-1057.
Peixoto LA, Laviola BG, Alves AA, Rosado TB and Bhering LL (2017)
Breeding Jatropha curcas by genomic selection: A pilot assessment
of the accuracy of predictive models. PLoS ONE 12(3): 1-16.
Rao GR, Korwar GR, Shanker AK and Ramakrishna YS (2008) Genetic associations, variability and diversity in seed characters, growth, reproductive phenology and yield in Jatropha curcas (L.) accessions.
Trees 22: 697-709.
Resende MDV (2002b) Genética biométrica e estatística no melhoramento
de plantas perenes. Embrapa Informação Tecnológica, Brasília, 975p.
Resende MDV (2007a) SELEGEN-REML/BLUP: sistema estatístico e
seleção genética computadorizada via modelos lineares mistos. Embrapa Florestas, Colombo, 360p.
Resende MDV (2007b) Matemática e estatística na análise de
experimentos e no melhoramento genético.Embrapa Florestas, Colombo, 535p.
Resende MDV (2016) Software Selegen-REML/BLUP: a useful tool for plant
breeding. Crop Breeding and Applied Biotechnology 16: 330-339.
Rocha RB, Ramalho AR, Teixeira AL, Laviola BG, Silva FCG and Militão JSLTA (2012) Eficiência da seleção para incremento do teor de óleo
do pinhão-manso. Pesquisa Agropecuária Brasileira 47: 44-50.
Spinelli VM, Dias LAS, Rocha RB and Resende MDV (2014) Yield performance of half-sib families of physic nut (Jatropha curcas L.).
Crop Breeding and Applied Biotechnology 14: 49-53.
Spinelli VM, Dias LAS, Rocha RB and Resende MDV (2015) Estimates of genetic parameters with selection within and between half-sib
families of Jatropha curcas L. Industrial Crops and Products 69:
355-361.
Spinelli VM, Rocha RB, Ramalho AR, Marcolan AL, Vieira Júnior JR, Fernandes CF, Militão JSLTA and Dias LAS (2010) Primary and
secondary yield components of the oil in physic nut (Jatropha curcas
L.). Ciência Rural40: 1752-1758.
Teodoro PE, Costa RD, Rocha RB and Laviola BG (2016) Número mínimo de medições para avaliação acurada de características agronômicas
de pinhão-manso. Pesquisa Agropecuária Brasileira 51: 112-119.