Plant Breeding / Article
Application of artificial neural networks in indirect
selection: a case study on the breeding of lettuce
Alcinei Mistico Azevedo (1*); Valter Carvalho de Andrade Júnior (2); Carlos Enrrik Pedrosa (3);
Celso Mattes de Oliveira (3); Marcus Flavius Silva Dornas (2); Cosme Damião Cruz (1);
Nermy Ribeiro Valadares (2)
(1) Universidade Federal de Viçosa (UFV), Departamento de Fitotecnia, Avenida Peter Henry Rolfs, s/n, 36570-900 Viçosa (MG), Brasil.
(2) Universidade Federal dos Vales do Jequitinhonha e Mucuri (UFVJM), Departamento de Agronomia, Rua da Glória, 187, 39100-000
Diamantina (MG), Brasil.
(3) Universidade Federal de Lavras (UFLA), Departamento de Agricultura, Caixa Postal 3037, 37200-000 Lavras (MG), Brasil.
(*) Corresponding author: [email protected]
Received: Mar. 2, 2015; Accepted: June 19, 2015
Abstract
The efficiency of artificial neural networks (ANN) to model complex problems may enable the prediction of characteristics that are hard to measure, providing better results than the traditional indirect selection. Thus, this study aimed to investigate the potential of using artificial neural networks (ANN) for indirect selection against early flowering in lettuce, identify the influence of genotype by environment interaction in this strategy and compare your results with the traditional indirect selection. The number of days to anthesis were used as the desired output and the information of six characteristics (fresh weight of shoots, mass of marketable fresh matter of shoots, commercial dry matter of shoots, average diameter of the head, head circumference and leaf number) as input file for the training of the ANN-MLP (Perceptron Multi-Layer). The use of ANN has great potential adjustment for indirect selection for genetic improvement of lettuce against early flowering. The selection based on the predicted values by network provided estimates of gain selection largest that traditional indirect selection. The ANN trained with data from an experiment have low power extrapolation to another experiment, due to effect of interaction genotype by environment. The ANNs trained simultaneously with data from different experiments presented greater predictive power and extrapolation.
Key words:Lactuca sativa, multi-layer-perceptron, gain selection, plant breeding, computational intelligence.
1. INTRODUCTION
The artificial neural networks (ANN) are non-parametric models of the human brain that recognizes patterns and regularities in the data presented to it. The use of ANN has the advantages of being non-parametric, does not require detailed information about the physical processes to be modeled and to tolerate data loss.
Due to their natural characteristics and the internal parallelism inherent to its architecture, ANNs are able to solve problems of great complexity. In agricultural sciences ANNs have been applied to different purposes, involving the prediction of time series (Oliveira et al., 2010), grouping of individuals by their genetic similarity (Barbosa et al., 2011), regression studies (Sállago et al., 2012), image classification (França, 2010; Tiger & Verma, 2013) and prediction of genetic value (Silva et al., 2014; Ventura et al., 2012).
In genetic improvement of features that are difficult to measure, identify and/or low heritability are usually improved by indirect selection using other correlated traits, with high heritability and simple evaluation (Cruz et al., 2012). However, the efficiency of artificial neural networks (ANN) to model complex problems may enable the prediction of measures of characteristics are hard to measure, providing better results than the traditional indirect selection.
According to Azevedo et al. (2014) the evaluation of the
number of days to anthesis in lettuce (Lactuca sativa) may
cultivation, especially in regions where the temperature exceeds 22 °C (Mota et al., 2003), which is very common in certain periods and regions of Brazil. The result of early flowering is the stem elongation, reduced leaf number, changes in commercial head formation and stimulation of production of latex, which makes the taste of bitter and unsuitable for consumption (Azevedo et al., 2014; Cock et al., 2002; Souza et al., 2008). Despite major advances achieved through plant breeding, with the generation of lettuce cultivars better adapted to tropical conditions, many problems remain, so a constant search for more competitive genotypes is needed (Carvalho et al., 2011), mainly for high tolerance to early flowering. For the development of these genotypes with good adaptability and stability is necessary to evaluate the cultivars in various locations and times, because the lettuce is affected by genotype by environment (Gualberto et al., 2009; Luz et al., 2009; Queiroz et al., 2014; Santos et al., 2009).
Thus, this study aimed to investigate the potential of using artificial neural networks (ANN) for indirect selection, identify the influence of genotype by environment interaction in this strategy and compare your results with the traditional indirect selection using as an example a case where there is a need to practice selection against early flowering in lettuce.
2. MATERIAL AND METHODS
Two experiments were conducted from 16 April to 12 July, 2010 (experiment 1) and 15 November 2010 to 23 March 2011 (experiment 2), in the division of vegetable
crops, located on the campus in the Universidade Federal dos
Vales do Jequitinhonha e Mucuri (UFVJM) in Diamantina (MG), Brazil. The elevation is 1,387 m and coordinates 18º12’01’’S and 43º34’20’’W. In both experiments eleven lettuce cultivars were evaluated: Winslow, Regina 500, Branca Boston, Quatro Estações, Vitória de Santo Antão, Atração, Lívia, Grand Rapids, Lollo Rossa, Romana Balão and Aurélia.
Seeds were sown in polystyrene trays with 128 cells, using the commercial substrate in the greenhouse under 50% shading of sunlight. The area was prepared for planting two months before transplanting by plowing and disking, forming the beds manually with a hoe. Fertilization planting, hedging and other cultural practices were done according to the recommendations for the crop (Filgueira, 2008).
Transplanting was done 30 days after sowing in beds with width of approximately 1.20 m by 0.30 m in height under unheated greenhouse construction, using a spacing of 0.30×0.30 m. The experimental design was in randomized block, with four replications and with twelve plants per plot. Irrigation was by drip and micro-sprinkler irrigation interval following as recommended by Filgueira (2008), during the morning and afternoon.
At 45 days after transplanting, when all plants showed standard commercial, agronomic assessments were conducted at six plants in each plot. The fresh weight of shoots (FWS) and the mass of marketable fresh matter of
shoots (MFMS) were expressed as g plant–1 by weighing on
a precision balance. The commercial dry matter of shoots (CDMS) was obtained by weighing on a precision balance after drying the plants in an oven at 65 °C with forced air
until constant weight, and the results expressed as g plant–1.
To obtain commercial heads were removed the leaves inappropriate for consumption (senescent and damaged). The average diameter (cm) of the head (HD) was obtained on an average of two perpendicular measurements of the head. The head circumference (HC) was measured with a graduated tape at the perimeter delimited by the edges of the leaves and expressed in cm. The leaf number (LN) was obtained by counting excluding senescent and damaged leaves. The other six plants of the plot were used to assess the average number of days from transplanting to anthesis (DA), having monitored daily plant development until the issuance of the flower stem and opening of the first flower.
Analysis of variance was done on the model yij= μ + gi + bj + eij
where: yij= observation of the ith genotype in the jth repetition;
μ = overall mean; gi= effect of the ith genotype, bj = effect
of the jth block and eij = effect of experimental error.
For each experiment, the estimates of heritability and phenotypic, genetic, and residual matrices of covariance and correlation were obtained. To test the significance of genotype-environment interaction was made an analysis
with the model Yijk = m + gi + b/ajk + aj + gaij + eijk where:
yijk= observation of the ith genotype in the jth environment
and kth repetition; μ = overall mean; gi= effect of the
ith genotype, b/ajk = effect of the kth block inside of jth
environment, aj = effect of jth environment, gaij = effect
of genotype-environment interaction, and eij = effect of
experimental error. All these estimates were obtained with genetic statistical software Genes and statistical expressions are presented in Cruz et al. (2012).
For the study of RNAs a large data set to the training process is required, thus a strategy for the best network training is the simulation data sets with several treatments and with the same structure genetic-statistical experiment that originated. From the first experiment simulated a data set called “Simulated Data 1”. From the second experiment also simulated a set of data called “simulated data 2”. Each of these two sets of simulated data consisted of 1,000 treatments (1,000 lettuce genotypes with the same genetic-statistical properties of the experiments that originated them.) and 10 repetitions, totaling 10,000 values for each of the seven study traits.
having in each 1,000 values (corresponding to the effects genotypes) with mean 0 and variance 1. B) Simulation of seven vectors with 10 values (corresponding to the effects of repetition) with mean 0 and variance 1. C) Simulation of seven vectors having in each 10,000 values (corresponding to the effects of the residue) with mean 0 and variance 1. D) The vectors (with traits values of each) obtained in steps A, B and C were pooled, yielding three arrays (one with the treatments effects, other with repetitions effects and the third with residual effects). To ensure average 0, variance 1 and zero covariance among the vectors, the scores of the principal components of each matrix were obtained. E) From the scores of the principal components, was made the spectral decomposition using the covariance matrix of genotype (matrix obtained in A step), the covariance matrix for the block matrix from the matrix B and for the residual covariance matrix obtained in procedure C. This caused the simulated effects to have the same covariance / correlations that the effects obtained in the experiments. F) Finally, it was done the sum of the experimental overall average of each characteristic with the simulated effects of genotype, block and residual. Thus, new sets of experimental data simulated with many observations and with the same genetic properties (covariance and correlation phenotypic, genotypic and residual) of the experiments that had originated them.
For the development of ANNs of MLP type (Multi-Layer
Perceptron), we used the Neural Network Toolbox of Matlab
software (version 8.1.0.604) with back propagation algorithm
and Levemberg-Marquardt optimization. Trainings were conducted using the “Simulate Data1” for “Network 1” and “Simulated Data2” to “Network 2”. For training “Network 3” 50% of the simulated data 1 and 50% of the simulated second data were used simultaneously. A reduction of 50% of the simulated data sets for “Network 3” was done to prevent this network could have better results due to the greater amount of information in the training process. As input file for the three processes of training (Network 1, Network 2 and Network 3), for each of the simulated treatment were considered five information (from repetitions): the lowest value of repetition, the average repetitions, the maximum value of the repetitions, the variance of repetitions and Pi statistic of the repetitions. The Pi statistic was obtained
by the equation wherein: Pii is the statistical Pi value for
the ith genotype simulated, r refers to the rth repetition
ranging from 1 to n, n is the number of repetitions (10),
Valuer is the value of the i-th treatment in the j-th repetition,
MaxValue is highest value observed for the ith treatment. The objective of using these 5 information for each trait in each treatment is increase the experimental information in the training process in order to improve network efficiency. Thus, it was obtained for each set of simulated data a matrix with 1,000 rows (treatments) and 30 columns relating to five information for each treatment in six characteristics (HD, HC, FWS, MFMS, CDMS and LN) used in training.
As desired output file used the average of each treatment to the number of days to flowering.
To input files and desired output file the information of 700 treatments (70%) was used for training, 150 treatments
(15%) for cross-validation – early stopping and 150 treatments
(15%) were designed to calculate mean square error and coefficient of determination (for selection of the best trained network). To ensure that each input parameter received equal attention during training, both the inputs as the output were standardized to the range between 0 and 1 by the following equation: in which is the value normalized; the value observed, is the minimum value of the sample andis the maximum sample result.
The maximum number of epochs of training was defined as 1,000, the MSE (mean square error) minimum to stop the
training was established as 1,0×10⁻⁷ and the largest number
of successive failures in validation (early stopping) was set to
6. All possible combinations of network considering one, two and three hidden layers and two, four and six neurons per layer were tested, consisting in 39 configurations. Knowing that early in training the free parameters are randomly generated and that these initial values can influence the final result of the training (Soares et al., 2014), each configuration of ANN was trained 100 times. A selection of the best trained network was made considering the lowest MSE found to all the trainings conducted. The activation function for the neurons of the hidden layer(s) was the hyperbolic tangent, as for the output layer was used the linear function.
After training of the three networks (Network 1, 2 and 3) predicted genetic values of the number of days to anthesis were obtained in both experiments for ANN. Subsequently, the selection gain obtained were estimated by the expression
GS(%)=100*[(s-o)*h2]/
o, where o the average for the number
of days until the anthesis, h2 is the heritability of the number
of days to anthesis and s is the average number of days to
anthesis of selected individuals based on: values observed in the number of days to anthesis (direct selection gain), rank of the observed values of the other traits (gain indirect selection) and rank the values predicted by the ANN (gain selection based in ANN output).
3. RESULTS AND DISCUSSION
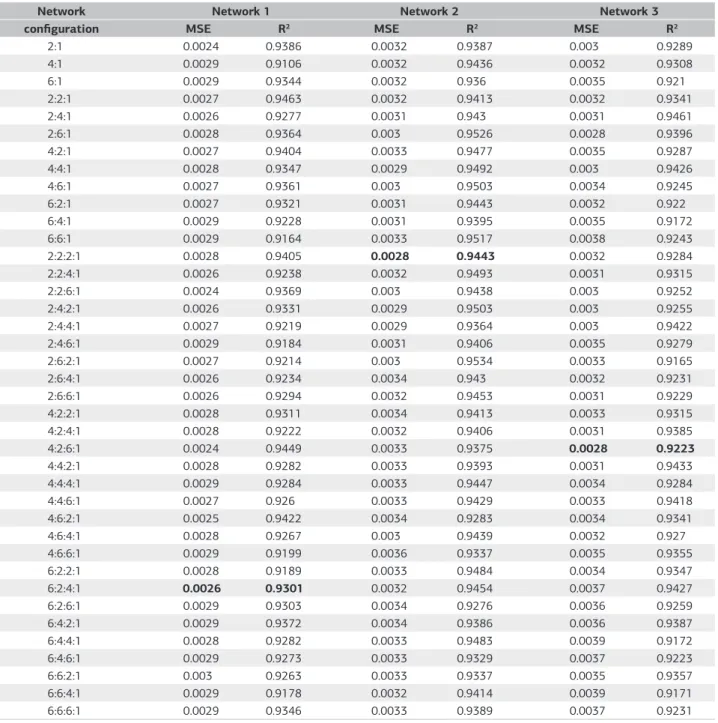
Values close to the lowest mean square error (MSEmin)
Table 1. Smallest mean square error (MSE) and the respective coefficient of determination (R2) in 100 trainings for each network configuration
Network Network 1 Network 2 Network 3
configuration MSE R2 MSE R2 MSE R2
2:1 0.0024 0.9386 0.0032 0.9387 0.003 0.9289
4:1 0.0029 0.9106 0.0032 0.9436 0.0032 0.9308
6:1 0.0029 0.9344 0.0032 0.936 0.0035 0.921
2:2:1 0.0027 0.9463 0.0032 0.9413 0.0032 0.9341
2:4:1 0.0026 0.9277 0.0031 0.943 0.0031 0.9461
2:6:1 0.0028 0.9364 0.003 0.9526 0.0028 0.9396
4:2:1 0.0027 0.9404 0.0033 0.9477 0.0035 0.9287
4:4:1 0.0028 0.9347 0.0029 0.9492 0.003 0.9426
4:6:1 0.0027 0.9361 0.003 0.9503 0.0034 0.9245
6:2:1 0.0027 0.9321 0.0031 0.9443 0.0032 0.922
6:4:1 0.0029 0.9228 0.0031 0.9395 0.0035 0.9172
6:6:1 0.0029 0.9164 0.0033 0.9517 0.0038 0.9243
2:2:2:1 0.0028 0.9405 0.0028 0.9443 0.0032 0.9284
2:2:4:1 0.0026 0.9238 0.0032 0.9493 0.0031 0.9315
2:2:6:1 0.0024 0.9369 0.003 0.9438 0.003 0.9252
2:4:2:1 0.0026 0.9331 0.0029 0.9503 0.003 0.9255
2:4:4:1 0.0027 0.9219 0.0029 0.9364 0.003 0.9422
2:4:6:1 0.0029 0.9184 0.0031 0.9406 0.0035 0.9279
2:6:2:1 0.0027 0.9214 0.003 0.9534 0.0033 0.9165
2:6:4:1 0.0026 0.9234 0.0034 0.943 0.0032 0.9231
2:6:6:1 0.0026 0.9294 0.0032 0.9453 0.0031 0.9229
4:2:2:1 0.0028 0.9311 0.0034 0.9413 0.0033 0.9315
4:2:4:1 0.0028 0.9222 0.0032 0.9406 0.0031 0.9385
4:2:6:1 0.0024 0.9449 0.0033 0.9375 0.0028 0.9223
4:4:2:1 0.0028 0.9282 0.0033 0.9393 0.0031 0.9433
4:4:4:1 0.0029 0.9284 0.0033 0.9447 0.0034 0.9284
4:4:6:1 0.0027 0.926 0.0033 0.9429 0.0033 0.9418
4:6:2:1 0.0025 0.9422 0.0034 0.9283 0.0034 0.9341
4:6:4:1 0.0028 0.9267 0.003 0.9439 0.0032 0.927
4:6:6:1 0.0029 0.9199 0.0036 0.9337 0.0035 0.9355
6:2:2:1 0.0028 0.9189 0.0033 0.9484 0.0034 0.9347
6:2:4:1 0.0026 0.9301 0.0032 0.9454 0.0037 0.9427
6:2:6:1 0.0029 0.9303 0.0034 0.9276 0.0036 0.9259
6:4:2:1 0.0029 0.9372 0.0034 0.9386 0.0036 0.9387
6:4:4:1 0.0028 0.9282 0.0033 0.9483 0.0039 0.9172
6:4:6:1 0.0029 0.9273 0.0033 0.9329 0.0037 0.9223
6:6:2:1 0.003 0.9263 0.0033 0.9337 0.0035 0.9357
6:6:4:1 0.0029 0.9178 0.0032 0.9414 0.0039 0.9171
6:6:6:1 0.0029 0.9346 0.0033 0.9389 0.0037 0.9231
Network 1: MLP trained with simulated data from Experiment 1 (simulated data 1); Network 2: MLP trained with simulated data from Experiment 2 (simulated data 2); Network 3: MLP trained using the simulated data from two experiments (simulated data 1 and 2).
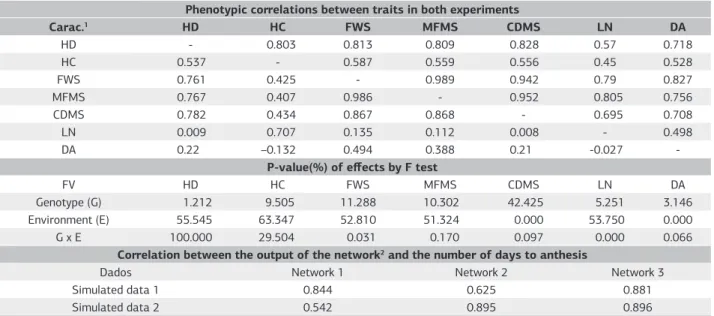
It was found in table 2 correlations ranging from 0.498 to 0.827 in Experiment 1 among the number of days until anthesis (DA) and other traits. The predictive power of ANNs is due to its ability to identify existing patterns among the information presented as desired output (number of days to anthesis) and information from the input layer (other parameters) (Pandolfi et al., 2009). Thus, the presence of features strongly correlated with the characteristic being predicted can provide greater efficiency in the use of ANNs. Souza et al. (2008) also found positive and significant estimates of correlation among flowering and
the other parameters. In the experiment 2 these estimates ranged from –0.132 to 0.494.
and production. Gualberto et al. (2009) also observed the effect of genotype by environment interaction evaluating lettuce cultivars in nine trials and three growing seasons.
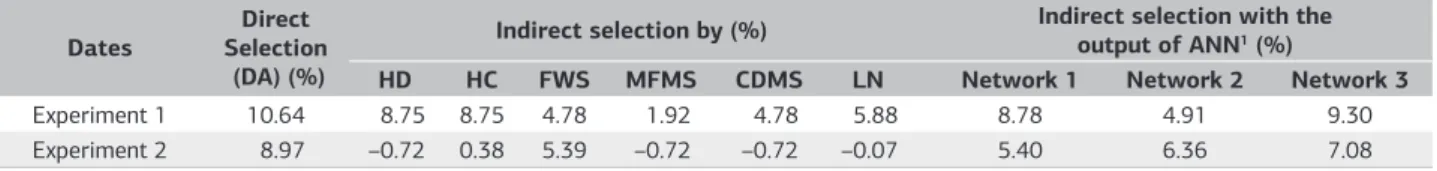
Considering a selection index of 30% increase in the number of days to flowering, estimates gain direct selection of 10.54% and 8.97% for Experiment 1 and 2, respectively were obtained (Table 3). To gain estimates of indirect selection for DA met for the first experiment higher estimates when using the variable diameter and head circumference (8.75%). As for the second experiment the highest estimate for the indirect selection gain was 5.39% from the fresh matter of shoots. According Caierão et al. (2006) the use of indirect selection is dependent on the effects of environment, justifying the difference in selection gain obtained in both experiments.
For indirect selection using the values DA predicted by “Network 1” the gains indirect selection were of 8.78% and 5.40% for Experiment 1 and 2, respectively, values close to the estimates of indirect selection were estimated using the traits head diameter and fresh weight of shoots. Indirect selection using the values DA predicted by “Network 2” a low estimate of gain selection for the Experiment 1 (4.91%) was obtained showing that this trained by simulated data from Experiment 2 has no power extrapolation to the Experiment 1, and that indirect selection in this situation would be unfavorable for improvement. The estimated gain of indirect selection for Experiment 2 using the values predicted by the “Network 2” indirect selection was 6.36%, higher than the estimated gain of indirect selection using the fresh weight of shoots (5.39%) value, showing that in this situation the use of the RNAs would be favorable.
The fact of the Network 1 provide greater predicted gain selection in experiment 1, and Network 2 provide greater gain selection in experiment 2 is also a indicative of genotype by environment interaction in the use of artificial neural networks. The genotype by environment interaction is a major complicating factor for genetic improvement and must be considered for obtaining genotypes with high adaptability and stability (Cruz et al., 2012).
For “Network 3” trained with simulated data from experiments 1 and 2 simultaneously, there were estimates of gains from indirect selection of 9.30 and 7.08% using the values predicted by the network in Experiments 1 and 2, respectively. These estimates are higher than those obtained using indirect selection for agronomic traits and values predicted by using the “Network 1” and “Network 2”. This information is important, showing that training the ANN using information from different experiments increased the power of prediction and extrapolation of the network, enabling higher earnings estimates for indirect selection. Therefore, for breeding companies the use of data from previous experiments may provide good results for the network training. If there is no data from previous experiments to train the network, an alternative may be the use of information sufficiently small samples representative of populations in improvement (in terms of variance and covariance between traits). And then, play selection in the rest of the population (not sampled plants in respect to difficult measurement) using the results predicted by network (trained with the information of the samples).
Table 2. Phenotypic correlations of Experiment 1 (above the main diagonal), Experiment 2 (the bottom of the main diagonal) and correlations between the network output and the desired output (days to flowering) in three trained networks
Phenotypic correlations between traits in both experiments
Carac.1 HD HC FWS MFMS CDMS LN DA
HD - 0.803 0.813 0.809 0.828 0.57 0.718
HC 0.537 - 0.587 0.559 0.556 0.45 0.528
FWS 0.761 0.425 - 0.989 0.942 0.79 0.827
MFMS 0.767 0.407 0.986 - 0.952 0.805 0.756
CDMS 0.782 0.434 0.867 0.868 - 0.695 0.708
LN 0.009 0.707 0.135 0.112 0.008 - 0.498
DA 0.22 –0.132 0.494 0.388 0.21 -0.027
-P-value(%) of effects by F test
FV HD HC FWS MFMS CDMS LN DA
Genotype (G) 1.212 9.505 11.288 10.302 42.425 5.251 3.146
Environment (E) 55.545 63.347 52.810 51.324 0.000 53.750 0.000
G x E 100.000 29.504 0.031 0.170 0.097 0.000 0.066
Correlation between the output of the network2 and the number of days to anthesis
Dados Network 1 Network 2 Network 3
Simulated data 1 0.844 0.625 0.881
Simulated data 2 0.542 0.895 0.896
1Head diameter (HD), head circumference (HC), fresh weight of shoot (FWS), marketable fresh matter of shoots (MFMS), commercial dry matter of shoots (CDMS), leaf
number (LN) and days to anthesis (DA). 2Network 1: MLP trained with simulated data from Experiment 1 (simulated data 1); Network 2: MLP trained with simulated data
ANN presents advantages over the conventional statistical procedures, because traditionally the mean is the main parameter needed to judge the superiority between genotypes (Cruz et al., 2012), and in cases of low heritability, the selection process has lower reliability. However, a more detailed analysis may be performed by taking into consideration not only the mean genotype, but also other relevant statistics and those of high practical aspect, although these make the decision-making process more complex for the data analyst. In the biometrics approach this additional information is neglected, but when utilizing the computational intelligence approach such information is indispensable and make up relevant inputs to be considered in the training process of the ANN (Silva et al., 2014).
The average number of days until anthesis in Experiment 1 and Experiment 2 was 106 and 71 days after transplanting, respectively (data not shown), since the other characteristics were assessed at 45 days after transplanting. Thus, the possibility of indirect selection against early flowering is an important strategy (Azevedo et al., 2014), especially if indirect selection based on values predicted by the ANN is used.
4. CONCLUSION
The use of ANN has great employment potential for indirect selection for genetic improvement of lettuce against early flowering. Selection is based on the values predicted by the network provided estimates of gain greater than selection based on more strongly correlated trait selection. ANNs trained with data from an experiment have low power extrapolation to another experiment, due to the effect of genotype by environment interaction. ANNs trained simultaneously with data from different experiments showed greater predictive and extrapolation power.
ACKNOWLEDGEMENTS
To the Fundação de Amparo à Pesquisa do Estado de Minas Gerais (FAPEMIG), the Conselho Nacional de Desenvolvimento Científico e Tecnológico (CNPq) and
Coordenação de Aperfeiçoamento de Pessoal de Nível Superior (CAPES) for providing scholarships and funding for development of the project.
REFERENCES
Azevedo, A. M., Andrade, V. C., Jr., Castro, B. M. C., Oliveira, C. M., Pedrosa, C. E., Dornas, M. F. S., & Valadares, N. R. (2014). Parâmetros genéticos e análise de trilha para o florescimento precoce e características agronômicas da alface. Pesquisa Agropecuaria Brasileira, 49, 118-124. http://dx.doi.org/10.1590/S0100-204X2014000200006.
Barbosa, C. D., Viana, A. P., Quintal, S. S. R., & Pereira, M. G. (2011). Artificial neural network analysis of genetic diversity in Caricapapaya L. Crop Breeding and Applied Biotechnology, 11, 224-231.
Caierão, E., Carvalho, F. I. F., & Floss, E. L. (2006). Seleção indireta para o incremento do rendimento de grãos em aveia. Ciência Rural, 36, 1126-1131. http://dx.doi.org/10.1590/S0103-84782006000400013.
Carvalho, J. L. S., Fo., Gomes, A. A., Silva, R. R., Ferreira, S., Costa, R. R., & Maluf, W. R. (2011). Parâmetros populacionais e correlação entre características da resistência a nematóides das galhas em alface. Ciências Agrárias, 6, 46-51.
Cock, W. R. S., Amaral, A. T., Jr., Bressan-Smith, R. E., & Monnerat, P. H. (2002). Biometrical analysis of phosphorus use efficiency in lettuce cultivars adapted to high temperatures. Euphytica, 126, 299-308. http://dx.doi.org/10.1023/A:1019949528214.
Cruz, C. D., Regazzi, A. J., & Carneiro, P. C. S. (2012). Modelos biométricos aplicados ao melhoramento genético. Viçosa: Editora UFV. 514 p.
Filgueira, F. A. R. (2008). Novo manual de olericultura: agrotecnologia moderna na produção e comercialização de hortaliças. Viçosa: Editora UFV. 421 p.
França, M. M. (2010). Análise do uso da terra no município de Viçosa-MG mediado por classificações supervisionadas com redes neurais artificiais e Maxver. Revista Brasileira de Geografia Física, 2, 92-101.
Gualberto, R., Oliveira, O. S. R., & Guimarães, A. M. (2009). Adaptabilidade e estabilidade fenotípica de cultivares de alface do grupo crespa em cultivo hidropônico. Horticultura Brasileira, 27, 7-11. http://dx.doi.org/10.1590/S0102-05362009000100002.
Luz, A. O., Seabra, S., Jr., Souza, B. S., & Nascimento, A. S. (2009). Resistência ao pendoamento de genótipos de alface em ambientes de cultivo. Agrarian, 2, 71-82.
Table 3. Gain expected selection to the increase in the number of days until anthesis (direct selection), indirect selection using morpho-agronomic traits and indirect selection from the output of three trained network
Dates SelectionDirect (DA) (%)
Indirect selection by (%) Indirect selection with the output of ANN1 (%)
HD HC FWS MFMS CDMS LN Network 1 Network 2 Network 3
Experiment 1 10.64 8.75 8.75 4.78 1.92 4.78 5.88 8.78 4.91 9.30
Experiment 2 8.97 –0.72 0.38 5.39 –0.72 –0.72 –0.07 5.40 6.36 7.08
Traits: Days to anthesis (DA), Head diameter (HD), head circumference (HC), fresh weight of shoot (FWS), marketable fresh matter of shoots (MFMS), commercial dry matter of shoots (CDMS) and leaf number (LN). 1Network 1: MLP trained with simulated data from Experiment 1 (simulated data 1); Network 2: MLP trained with simulated data
Mota, J. H., Yuri, J. E., Freitas, S. A. C., Rodrigues, J. C., Jr., Resende, G. M., & Souza, R. J. (2003). Avaliação de cultivares de alface americana durante o verão em Santana da Vargem, MG. Horticultura Brasileira, 21, 234-237. http://dx.doi.org/10.1590/S0102-05362003000200023.
Oliveira, A. C. S., Souza, A. A., Lacerda, W. S., & Goncalves, L. R. (2010). Aplicação de redes neurais artificiais na previsão da produção de álcool. Ciência e Agrotecnologia, 34, 279-284. http://dx.doi. org/10.1590/S1413-70542010000200002.
Pandolfi, C., Mugnai, S., Azzarello, E., Bergamasco, S., Masi, E., & Mancuso, S. (2009). Artificial neural networks as a tool for plant identification: a case study on Vietnamese tea accessions. Euphytica, 166, 411-421. http://dx.doi.org/10.1007/s10681-008-9828-9.
Queiroz, J. P. S., Costa, A. J. M., Neves, L. G., Seabra, S., Jr., & Barelli, M. A. A. (2014). Estabilidade fenotípica de alfaces em diferentes épocas e ambientes de cultivo. Revista Ciência Agronômica, 4, 276-283.
Sállago, J. M. V., Cruz, I. L., & García, E. R. (2012). Estimación de la fotosíntesis foliar en jitomate bajo invernadero mediante redes neuronales artificiales. Revista Mexicana de Ciencias Agrícolas, 3, 1289-1304.
Santos, C. L., Seabra, S., Jr., Lalla, J. G., Theodoro, V. C. A., & Nespoli, A. (2009). Desempenho de cultivares de alface tipo crespa sob altas temperaturas em Cáceres-MT. Revista Agrarian, 2, 87-98.
Silva, G. N., Tomaz, R. S., Sant’anna, I. C., Nascimento, M., Bhering, L. L., & Cruz, C. D. (2014). Neural networks for predicting breeding values and genetic gains. Scientia Agricola, 71, 494-498. http://dx.doi. org/10.1590/0103-9016-2014-0057.
Soares, F. C., Robaina, A. D., Peiter, M. X., Russi, J. L., & Vivan, G. A. (2014). Redes neurais artificiais na estimativa da retenção de água do solo. Ciência Rural, 44, 293-300. http://dx.doi.org/10.1590/ S0103-84782014000200016.
Souza, M. C. M., Resende, L. V., Menezes, D., Loges, V., Souto, T. A., & Santos, V. F. (2008). Variabilidade genética para características agronômicas em progênies de alface tolerantes ao calor. Horticultura Brasileira, 26, 354-358. http://dx.doi.org/10.1590/S0102-05362008000300012.
Tiger, B., & Verma, T. (2013). Identification and classification of normal and infected apples using neural network. International Journal of Science and Research, 2, 160-163.