Bayesian Multi-Trait Analysis Reveals a
Useful Tool to Increase Oil Concentration
and to Decrease Toxicity in
Jatropha curcas
L.
Vinícius Silva Junqueira1, Leonardo de Azevedo Peixoto2*, Bruno Galvêas Laviola3,
Leonardo Lopes Bhering2, Simone Mendonça3, Tania da Silveira Agostini Costa4,
Rosemar Antoniassi5
1Animal Science Department, Federal University of Viçosa, Viçosa, Minas Gerais, zipcode: 36570–000, Brazil,2Biology Department, Federal University Viçosa, Viçosa, Minas Gerais, zipcode: 36570–000, Brazil,
3Empresa Brasileira de Pesquisa Agropecuária, Embrapa Agroenergia, Parque Estação Biológica–PqEB s/ n, Asa Norte, zipcode: 70770901, Brasília, Brazil,4Empresa Brasileira de Pesquisa Agropecuária, Centro Nacional de Pesquisa de Recursos Genéticos e Biotecnologia, Parque Estação Biológica, PqEB, W5 Norte, Final PqEB, zipcode: 70770917, Brasília, Brazil,5Empresa Brasileira de Pesquisa Agropecuária, Centro Nacional de Pesquisa de Tecnologia Agroindustrial de Alimentos, Avenida das Americas 29501 Guaratiba, zipcode: 23020470, Rio de Janeiro, Brazil
Abstract
The biggest challenge for jatropha breeding is to identify superior genotypes that present high seed yield and seed oil content with reduced toxicity levels. Therefore, the objective of this study was to estimate genetic parameters for three important traits (weight of 100 seed, oil seed content, and phorbol ester concentration), and to select superior genotypes to be used as progenitors in jatropha breeding. Additionally, the genotypic values and the genetic parameters estimated under the Bayesian multi-trait approach were used to evaluate differ-ent selection indices scenarios of 179 half-sib families. Three differdiffer-ent scenarios and eco-nomic weights were considered. It was possible to simultaneously reduce toxicity and increase seed oil content and weight of 100 seed by using index selection based on geno-typic value estimated by the Bayesian multi-trait approach. Indeed, we identified two fami-lies that present these characteristics by evaluating genetic diversity using the Ward clustering method, which suggested nine homogenous clusters. Future researches must integrate the Bayesian multi-trait methods with realized relationship matrix, aiming to build accurate selection indices models.
Introduction
Jatropha (Jatropha curcasL.) has many economically interesting characteristics, and nowadays, it has been considered as the most important shrub for biodiesel production, mainly due to the large amount of oil content it produces [1]. Additionally, jatropha stands out due to premature production period, when it is compared with other palms commonly used for biofuel produc-tion [2]. Moreover, this culture presents drought resistance [3], low seed cost [4], high seed oil content [5], and easy adaptation [2].
a11111
OPEN ACCESS
Citation:Silva Junqueira V, Azevedo Peixoto Ld, Galvêas Laviola B, Lopes Bhering L, Mendonça S, Agostini Costa TdS, et al. (2016) Bayesian Multi-Trait Analysis Reveals a Useful Tool to Increase Oil Concentration and to Decrease Toxicity inJatropha curcasL.. PLoS ONE 11(6): e0157038. doi:10.1371/ journal.pone.0157038
Editor:David A Lightfoot, College of Agricultural Sciences, UNITED STATES
Received:January 25, 2016
Accepted:May 24, 2016
Published:June 9, 2016
Copyright:© 2016 Silva Junqueira et al. This is an open access article distributed under the terms of the
Creative Commons Attribution License, which permits unrestricted use, distribution, and reproduction in any medium, provided the original author and source are credited.
Data Availability Statement:All relevant data are within the paper and its Supporting Information files.
Funding:CAPES—Coordenação de
Aperfeiçoamento de Pessoal de Nível Superiorhttp:// www.capes.gov.br/and Cnpq—Conselho Nacional de
Desenvolvimento Cientifico e Tecnológicohttp://cnpq. br/.
Approximately 35% of seeds’content is composed of oil, of which 24.6% is crude protein and 47.2% is crude fat [6]. Moreover, jatropha’s oil presents higher oxidation stability than soy-bean’s oil; lower viscosity than castor’s oil; and lower pour point than other palms [7].
Despite the large amount of oil and crude protein content, consumption of seeds can repre-sent a risk for animal health [8]. Indeed, the use of jatropha’s cake (by-product of seeds indus-trial processing) as animal feed, and consequently the crop cultivation economic viability are conditioned by the low toxicity content [9]. Phorbol ester has been considered as the main sub-stance for jatropha’s seeds toxicity [10], and has been differently reported in toxic genotypes (2 to 6 mg/g of dry matter) and in non toxic genotypes (0 to 1.8 mg/g) [9]. Thus, there is the need to achieve highly productive genotypes with respect to high seed oil content and low level of toxicity. Therefore, the use of breeding techniques must be adopted in order to identify supe-rior genotypes aiming at the improvement for these traits.
Bayesian multi-trait models have become useful statistics method for plant and animal genetic evaluations. Many authors have shown that this model is more flexible and effective than the least squares method, since it is not only based on the likelihood function, but it also allowsa prioriknowledge assumption when defining prior distribution [11].
Many previous studies have estimated variance components and genetic parameters under different statistical methods in jatropha [12–15]. However, none of them carried out multi-trait analysis using a Bayesian approach for seed oil content (SOC, %), weight of 100 seeds
(W100S, g), and phorbol ester concentration (PEC, mg/g). Therefore, the Bayesian multi-trait
analysis was carried out in order to estimate variance components and genetic parameters, which were used to evaluate genetic diversity and selection indices, aiming to identify superior genotypes forSOC,W100SandPECtraits.
Materials and Methods
Experimental design
The experiment considered the evaluation of 179 jatropha half-sib families from the Embrapa Cerrados germplasm bank [samples were collected in different Brazilian regions (S1 Table)]. It is settled in the experimental field of Embrapa Cerrados, Planaltina, Distrito Federal, Brazil (15°35’30”S and 47°42’30”W; 1007 m asl). The experiment was implemented in November, 2008, in a complete randomized block design with 2 replications, and 5 plants per plot,
arranged in rows, spaced 4 m between rows, and 2 m between plants. All management practices were based on Dias et al. [16], and they were adapted according to recent research advances regarding jatropha in Brazil [17–19]. The half-sib families were evaluated over 5 crop years (2010 to 2014) forW100S,whileSOCandPECwere evaluated only in 2014. All data used in this study are available in Table inS2 Table.
Phorbol ester was extracted according to procedure described by Makkar et al. [20]. Milled seeds was carried on in accelerated solvent extraction equipment called Dionex (model ASE 350). Tetrahydrofuran was used as solvent, and posteriorly, it was evaporated under nitrogen flow. The Oily residual was transferred to a test tube (10 mL), and extracted repeatedly (four times) using methanol (once using 2mL and three using 1mL). Finally, the oily residual was transferred to volumetric flask (5 mL). The work solution was filtered using VertiPure PTFE Syringe (13 mm, 0.2μm) and 1oo mL of this solution was injected into High Performance
Liq-uid Chromatography (HPLC). A typical column (C18 250 x 4.6 mm) was used, with the tem-perature around 25°C. A UV detector allowed on-column detection operated from 200 nm to 340 nm. The standard curve was built using 12-myristate 13—phorbol Acetate.
Sample (200 g of seeds) for each plant and replicated twice. Soxhlet was used to extract the oil and the hexane was used as solvent.
Despite the five consecutive years of evaluations ofW100S, only the records of 2014 were used becauseSOCandPECtraits were recorded only in this specific year. Additionally, mean phenotypes were used forW100S, and these records were adjusted according to the number of replications within genotypes and blocks. Also, all analyses were carried out using 358 pheno-typic records for each trait of the 179 half-sib families.
Statistical model and analysis
Variance components and genetic parameter estimates were obtained under the Bayesian approach, via Gibbs sampling, using the Gibbs2f90 software, as described by Misztal et al. [21]. We considered a total of 100,000 cycles after discarding the 40,000 initial samples used for burn-in and thinned every tenth iteration, resulting in a total of 6,000 samples. The conver-gence of Markov Chain Monte Carlo (MCMC) was tested by the Geweke criterion [22], using two packages: boa [23], and CODA [24], implemented in the R software [25]. Posterior means, key percentiles and standard deviations (SD) for estimated parameters were obtained from MCMC samples. Multi-trait mixed model was:
yijkl¼miþbikþgijþeijkl ½1
whereyijklis thelth= {1,2,. . .,358} phenotypic value ofith= {1,2,3} trait, onjth= {1,2,. . .,179} genotype, withinkth= {1,2} blocks;μiis the overall mean ofithtrait; andeijklis the residual term.
Under the Bayesian approach, the following joint distribution of data (likelihood function) were:
yijjβ;g;G0;R0Nðx 0
ijβþz
0
ijg;s
2
eÞ ½2
whereβis the vector ofa priorprobability of systematic effects (overall mean and blocks for each trait from Eq [1]);g= {gij}*N(0,I⊗G0) is the vector ofa priorprobability of genotypic values,
whereIis the identity matrix andG0¼
s2a
1 sa12 sa13
sa21 s2a2 sa23
sa
31 sa32 s 2 a3 2 6 6 4 3 7 7
5is the genotypic variance matrix;
e= {eijkl}*
N(0,I⊗R0) is the vector ofa priorprobability of residual values with normal independent identical
distribution; whereR0¼
s2e1 se12 se13
se21 s2e
2 se23
se31 se32 s2e3
2 6 6 4 3 7 7 5
;x0
ijandz0ijare incidence rows that relates systematic and
genotypes effects within traits to the respective phenotypic value; ands2eis residual variance assumed as homogeneous.
The followinga prioriprobability distributions for the location parameters of interest were given by:
βNðb0;VbÞ ½3
whereVbis a diagonal matrix of thea priorivariance ofβ, assumingVb! 1;
Three-dimensional scaled inverted Wishart distributions are assigned as prior process for each of theG0andR0covariance matrices:
G0W 1
3 ðΣg;nÞ ½4
R0 W 1
WhereSgandSeare scale matrices, andn= 5 is the degree of freedom parameter.
The joint posterior density of all parameters, which are dependent on the genotypic effects of the corresponding matrix, but which take over prior independence, is given by
pðβ;g;G0;R0jyÞ /pðyjβ;g;G0;R0Þpðβjb0;VbÞpðgjIG0ÞpðG0jΣg;nÞpðR0jΣe;nÞ ½6
Clustering and genetic diversity
A cluster analysis was carried out aiming to understand the genotypic relationship between traits, and to identify genotypes that expressed genetically similar performance. Hence, we intended to cluster homogeneous genotypes. The first step of cluster analysis is to calculate dis-similarity (D) matrix. In this study, we adopted the Mahalanobis distance, which can be defined as follows:
d2
ðg1;g2Þ ¼ ðg1 g2Þ
T
Cðg1 g2Þ ½7
Whereg1andg2are genotypic values forSOC,W100SorPECtraits;C=S−1is the
Mahala-nobis generalized distance; andS−1is the three-dimensional inverse of variance matrix. This
metric was used to consider the covariance between genotypes evaluated in different blocks. Thus, the Ward cluster hierarchy method was applied, and it was chosen aiming to maxi-mize the homogeneity within clusters so that the sum of square of error (SSE) is minimum. SSE of each cluster can be achieved as follows:
SSEcs¼
Pnm
s¼1ðg ðmÞ
s g
ðmÞ
: Þ
T ðgðmÞ
s g
ðmÞ
: Þ ½8
wherenmis the number of individuals onmthcluster; andn¼ Pt
m¼1nm
Mojena criteria was used to set the optimal number of clusters, and the method is based on computing the highest amplitude between clusters that maximizes the quality of the clustering [26].
aj>aþoS
a ½9
wherej= (1,2,. . .,n) is the number of clusters;αjis the correspondence joint point ton−j+ 1 clusters;aandSαare the mean and the standard deviation ofα0s; andωis a constant equal to 1.25, as suggest by [27].
Selection index calculations
Selection indices procedures were constructed according to Hazel [28]. Overall genetic gain can be achieved by selecting individuals by the sum of its several genotypes for each trait weighted by its relative economic value. This aggregate genotype (H) can by defined as:
H¼g1w1þg2w2þ þgnwn ½10
Wheregi,i= {1,2,. . .,n} is the vector of genotypic values for thenthtrait; and wi,i= {1,2,. . ., n} is the relative economic value.
In this study, three different scenarios were used, and they included different traits in the selection indices. Additionally, three different weights (w) of the traits in the breeding goal were taken into account. In the first situation, all traits had weight of 1 monetary unit per genetic standard deviation. In the second situation,SOCreceived weight of 2 and 1 monetary units for the other traits. Finally, we set weight of 4 monetary units forSOC, 2 forW100S,and 1 forPEC,in the third scenario. Traits contemplated in these scenarios were defined to depict a situation in which an established breeding program already working on selection forSOC
onlySOCwas used as target in the first scenario. The next two scenarios gradually included
W100SandPECin selection indices.
The set up matricesP,GandCcontains phenotypic (co)variance between all components in a given scenario; covariance between traits of selection index and additive genetic values for traits of the breeding goal; and genetic (co)variance between traits in the breeding goal, respec-tively. Selection indices coefficients were calculated byb=P−1Gw, wherewis the vector of
rela-tive economic weights expressed in monetary units per measurement units of the traits. Variances of the index (I) and of the H were calculated bys2I ¼b0Pbands2H¼w0Cw. Correla-tion between the index and the genotypic aggregate (accuracy of the index) was calculated by
RIH¼ sI
sH.
Monetary overall genetic gain per generation was calculated byΔG= (i)RIHσH, and the
response to selection per generation (S) for each trait was calculated by:
S¼ i sIb
0G ½11
whereiis the selection intensity assumed to be 1.75, considering the selection of the 10% supe-rior genotypes.
Results
In this study, we evaluated 179 genotypes for the three important traits in jatropha breeding program: seed oil content (SOC), weight of 100 seeds (W100S) and phorbol ester concentra-tion (PEC) aiming to identify superior half-sib families under a Bayesian multi-trait model, using selection indices procedures.
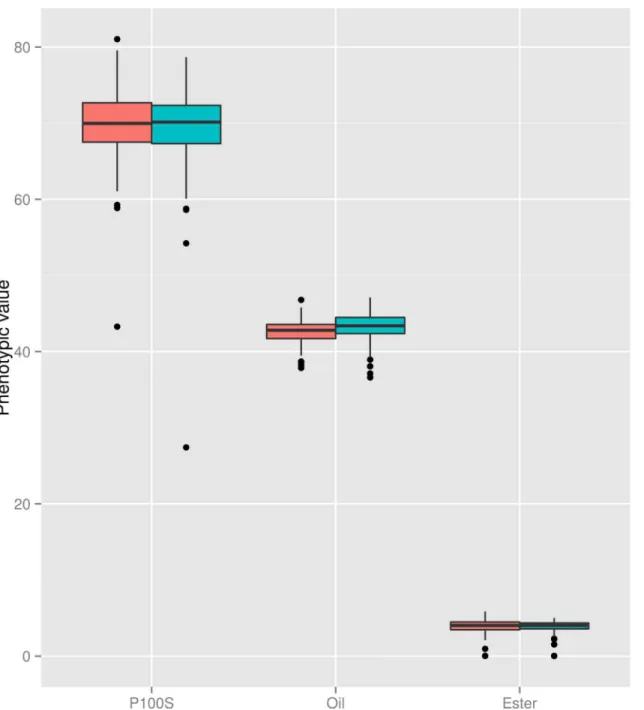
Phenotypic evaluation
We observed that there are no differences between blocks within traits (Fig 1). The highest standard deviation value was observed forW100S, followed bySOCandPEC. We observed a few outlier records for each trait.
Convergence criterion
Geweke convergence criterion indicates convergence for all dispersion parameters when gener-ating 100,000 MCMC chains, 40,000 samples for burn-in and a sampling interval of 10, totaling 6,000 effective samples used for variance component estimate. Similar posterior mean, median and mode estimates were obtained for variance components, suggesting density with normal shape appearance. Effective sample size (ESS) estimated the number of independent samples with information equivalent to that contained within the dependent sampling. Thus, it was observed that the length of the generated chain was adequate since the smallest ESS was 1991.
Variance components and genetic parameters
Genotypic variance estimated under the Bayesian multi-trait model forW100S(s2g1) was about 43 times greater than forSOC(s2g
2), or forPEC(s
2
g3) (Table 1). The genotypic variances for
SOCandPECwere approximately of the same magnitude. We observed negative covariance betweenW100SandPEC, which is a desirable relationship. Covariance betweenW100Sand
SOCwas positive, and HPD interval evidences statistical significance of this parameter.
W100Spresented the highest residual variance (lower certainty), possibly due to a scale
all traits can be considered as not statistically significant when analyzing HPD interval; thus, residual correlations can be considered as absent.
W100SandPECpresented higher estimated heritabilities thanSOC. Despite the higher
cer-tainty in these estimates being associated toW100S,amplitude of HPD intervals was relatively close for all traits (Table 1).
We verified desirable association betweenSOCandW100S(positive correlation) for phe-notypic and gephe-notypic correlation, being the latter stronger than the former (Table 2). Besides the moderate genotypic association betweenSOCandW100S, all the other correlations were of low magnitude for both genotypic and phenotypic correlations. Additionally, desirable
Fig 1. Phenotypic trait evaluation using the Boxplot analysis.Vertical bars are second and third quantiles, and the dots outside the bars are outliers. Each block was evaluated separately, allowing their individual evaluation.W100S–weight of 100 seeds;SOC–seed oil content;PEC–phorbol ester concentration.
negative genotypic correlation was observed betweenPECandSOC,and betweenPECand
W100S.
Genetic diversity
Genetic diversity analysis aimed to evaluate how the genotypes were distributed between the clusters. In this analysis we used the Ward clustering method based on the Mahalanobis dis-tance, which was calculated using the genotypic values estimated under a Bayesian multi-trait mixed models.
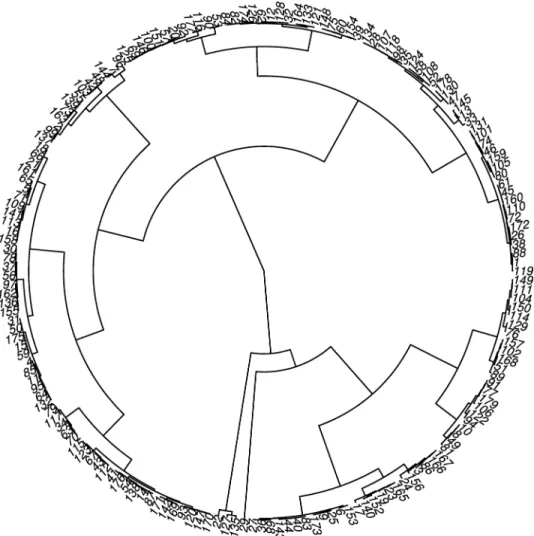
Nine clusters were suggested according to the Ward method: six big clusters with 35, 31, 28, 23, 24 and 22 half-sib families; one cluster with 13 half-sib families; and two small clusters with 3 and 1 half-sib families (Fig 2).
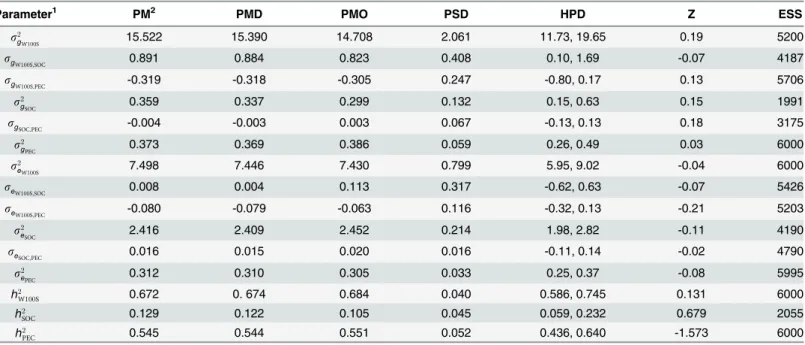
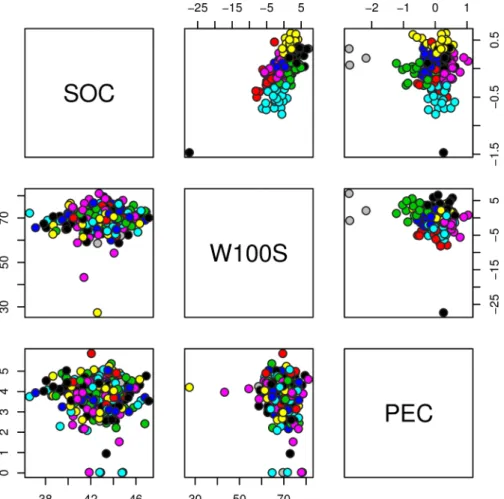
Phenotypic and genotypic distribution of the nine clusters suggested by the Ward clustering method can be verified inFig 3. We observed that the use of genotypic values enables a well-defined clustering of genotypes, which is not observed when evaluating the phenotypic values using the clusters suggested by the clustering method. In other words, despite the high Table 1. Variance components and genetic parameters estimated under the Bayesian multi-trait analysis via Gibbs sampling of weight of 100 seeds (W100S), seed oil content (SOC) and phorbol ester concentration (PEC) traits.
Parameter1 PM2 PMD PMO PSD HPD Z ESS
s2gW100S 15.522 15.390 14.708 2.061 11.73, 19.65 0.19 5200
sgW100S;SOC 0.891 0.884 0.823 0.408 0.10, 1.69 -0.07 4187
sgW100S;PEC -0.319 -0.318 -0.305 0.247 -0.80, 0.17 0.13 5706
s2g
SOC 0.359 0.337 0.299 0.132 0.15, 0.63 0.15 1991
sg
SOC;PEC -0.004 -0.003 0.003 0.067 -0.13, 0.13 0.18 3175
s2g
PEC 0.373 0.369 0.386 0.059 0.26, 0.49 0.03 6000
s2e
W100S 7.498 7.446 7.430 0.799 5.95, 9.02 -0.04 6000
seW100S;SOC 0.008 0.004 0.113 0.317 -0.62, 0.63 -0.07 5426
seW100S;PEC -0.080 -0.079 -0.063 0.116 -0.32, 0.13 -0.21 5203
s2eSOC 2.416 2.409 2.452 0.214 1.98, 2.82 -0.11 4190
seSOC;PEC 0.016 0.015 0.020 0.016 -0.11, 0.14 -0.02 4790
s2e
PEC 0.312 0.310 0.305 0.033 0.25, 0.37 -0.08 5995
h2
W100S 0.672 0. 674 0.684 0.040 0.586, 0.745 0.131 6000
h2
SOC 0.129 0.122 0.105 0.045 0.059, 0.232 0.679 2055
h2
PEC 0.545 0.544 0.551 0.052 0.436, 0.640 -1.573 6000
1Genetic variance ofith
trait (s2gi); genetic covariance between traitsiandj(sgij); residual variance ofi th
trait (s2ei); residual covariance between traitsiandj (seij); and heritability ofi
th trait (h2
i).
2Posterior mean (PM), posterior median (PMD), posterior mode (PMO), posterior standard deviation (PSD), posterior high density interval (HPD), Z-Geweke (Z) and effective sample size (ESS).
doi:10.1371/journal.pone.0157038.t001
Table 2. Heritability (diagonal), genotypic (above) and phenotypic (below) correlation between traits.
Trait SOC W100S PEC
Seed oil content (SOC) 0.129 0.544 -0.010
Weight of 100 seeds (W100S) 0.113 0.674 -0.130
Phorbol ester concentration (PEC) 0.009 -0.101 0.545
Phenotypic varianceðs2pÞ 2.774 23.019 0.685
heritability, selection of plants based only on phenotypic information could not provide genetic gain for all traits simultaneously.
Genetic gain and genotype selection based on selection index
After the study of trait’s behavior and after verifying that simultaneous genetic gain will hardly be achieved for all traits, we evaluated several different selection index scenarios (Table 3) aim-ing to select superior genotypes.
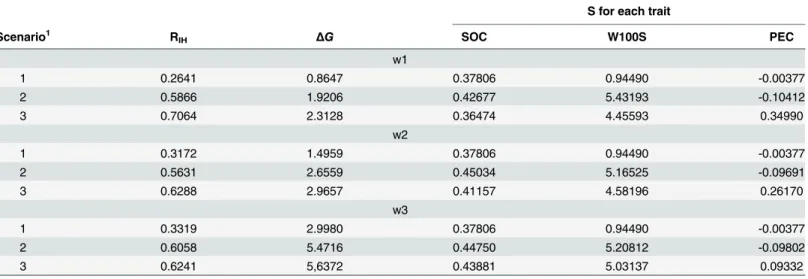
Table 4shows the results of response to selection per generation (S), accuracy of the index, and overall genetic gain among different scenarios and weights. The highest accuracy values were achieved under scenario 3 (all traits were used in selection criteria) regardless of the assessed weights. A different trend was observed for the monetary overall genetic gain per gen-eration (ΔG), which was higher when adoptingw3(quadruple forSOC, double forW100S,
and one forPEC) strategies. Additionally, it was possible to obtain simultaneous economically interesting response to selection in scenarios 1 and 2, considering different weighting
strategies.
Fig 2. Ward cluster method based on the Mahalanobis distance, calculated using genotypic values estimated by the Bayesian multi-trait analysis.
Discussion
Phenotypic evaluation
Boxplot analysis was carried out to verify how phenotypic data were distributed among blocks. Previous phenotypic analyses are always important for the understanding of each trait, and it helps the researcher in choosing the best way of data evaluation.
Phenotypic variance estimates for seed oil content (SOC) and phorbol ester concentration (PEC) presented low magnitudes. Different authors have shown the absence of genetic diver-sity between accessions [13,29,30], suggesting that traits’improvement could be restricted. Fig 3. Genotypic values (above diagonal) and phenotypic values (below diagonal) distributions between seed oil content (SOC, g), weight of 100 seed (W100S, %) and phorbol ester concentration (PEC, mg/g).
doi:10.1371/journal.pone.0157038.g003
Table 3. Scenarios with the respective traits considered by the selection criteria.
Scenario Traits considered in the selection index1
1 SOC
2 SOC + W100S
3 SOC + W100S + PEC
1
Weight of 100 seeds (W100S, g), Seed oil content (SOC, %), and phorbol ester concentration (PEC) in seeds (mg/g)
The success of the evaluation of a breeding program is related to the accurate prediction of genotypic values, which is closely related to the adoption of proper models. Thus, in this research, we applied a novel statistic approach for variance components estimate under plant breeding schemes. Implementation of the Bayesian multi-trait models is straightforward, and nowadays it has been widely used due to the possibility of consideringa priorknowledge when modeling. Despite its wide application in animal breeding [31,32], Bayesian multi-trait analy-sis has never been reported in plant breeding.
Variance components and genetic parameters
Genetic and environment parameters estimated under the Bayesian multi-trait approach were similar toSOCestimates reported by Peixoto et al. [33], while carrying out analysis of variance
(ANOVA). Rosado et al. [30] used information of molecular markers and reported low genetic
variance estimates among jatropha families. These authors argue that a possible cause would be a common ancestor origin and the selection pressure that this species has suffered in recent years. Indeed, these causes would explain the low genotypic variance observed forSOC,and consequently its low heritability. Thereby, selecting superior genotypes based on phenotypic values would not provide an expected overall genetic gain since approximately 83% of the phe-notypic variance is not genetic. Thus, it is necessary the adoption of appropriate methodologies to accurately predict genetic effects. Therefore, based on these results and on previous
researches, we suggest that the Bayesian multi-trait analysis is more appropriate than ANOVA to perform analysis and select superior genotypes for jatropha breeding, since the Bayesian model can capture minor genetic differences between families, while ANOVA cannot.
The success of a breeding program, which usually aims to improve multiple traits simulta-neously, is influenced by the correlation between traits, and mainly by the breeding goal. We observed a non-significant difference for all covariance estimates, except forSOCand W100S (Table 1), which suggests that selection based on information of a specific trait will not provide correlated gain to another trait (Table 2). However, it is expected and necessary that multiple traits are improved simultaneously due to the large generation interval of jatropha. Thus, it is Table 4. Response to selection per generation (S), accuracy of the index (RIH), and monetary overall genetic gain per generation (ΔG) for weight of 100 seeds (W100S, g), seed oil content (SOC, %) and phorbol ester concentration in seeds (PEC, mg/g) using selection index.
S for each trait
Scenario1 R
IH ΔG SOC W100S PEC
w1
1 0.2641 0.8647 0.37806 0.94490 -0.00377
2 0.5866 1.9206 0.42677 5.43193 -0.10412
3 0.7064 2.3128 0.36474 4.45593 0.34990
w2
1 0.3172 1.4959 0.37806 0.94490 -0.00377
2 0.5631 2.6559 0.45034 5.16525 -0.09691
3 0.6288 2.9657 0.41157 4.58196 0.26170
w3
1 0.3319 2.9980 0.37806 0.94490 -0.00377
2 0.6058 5.4716 0.44750 5.20812 -0.09802
3 0.6241 5,6372 0.43881 5.03137 0.09332
1
In scenario 1 onlySOCwas used as selection criteria.W100Swas incorporated into the selection index in scenario 2, andPECwas added to scenario 3. Economic relative weights (w) were defined as w1 = same, w2 = double for SOC, and w3 = 4(SOC), 2(W100S) and 1(PEC).
necessary the use of statistics techniques that would help breeders to select superior families, and consequently result in reasonable overall gain. Thereby, the use of selection index strategies seems to be a good alternative.
Genetic diversity
To evaluate the diversity between Jatropha half-sib families, the Ward method was used for clustering, resulting in nine clusters. Singh et al. [34] reported that one of the main problems of jatropha breeding programs is the little genetic variability between genotypes. Moreover, it was reported that the genetic variance is high within families and low between families [29,35].
We observed low correlation estimates betweenW100SandSOCwithPEC, which is simi-lar to the reports of Peixoto et al. [33]. They estimated correlation based on ANOVA and BLUP results, and observed that there was only significant correlation betweenW100Sand
SOC. Thus, these results mean that when we select forW100Swe are also selecting forSOC, and vice versa. Otherwise, when we select forW100SandSOC,we are not selecting forPEC. Thereby, an option to improve all traits simultaneously is the use of selection index
procedures.
Genetic gain and genotype selection based on selection index
Genotypic values estimated under the Bayesian multi-trait analysis was used to apply selection index procedures, and superior genotypes were selected based on different scenarios.
Despite the low correlation estimates observed betweenSOC,W100SandPEC, it was possi-ble to achieve overall genetic gain for all traits simultaneously by using selection index. Peixoto et al. [33] used different selection index methods and concluded that a multiplicative index provided genetic gain for all the evaluated traits. Therefore, our work confirms that it is possi-ble to increaseSOCand reducePEC. This is an important result for jatropha’s breeding, mainly becausePECis a limiting factor to the cultivation of this crop.
Simultaneous genetic gain can be achieved by correlated response, which can be maximized with several crossing cycles in order to increase the frequency of favorable alleles for all traits [33]. In this study, we presented a different strategy to achieve simultaneous genetic gain when using the Bayesian multi-traits analysis to estimate genotypic values, and we used them to build a selection index aiming to select superior genotypes.
Implications and future perspectives
Jatropha is a perennial plant which has been used to produce biofuel, and it has been reported that it is possible to increase its performance by selecting plants based on genetic information. Indeed, the use data of traditional jatropha breeding techniques, novel statistics methods, and molecular markers (i.e. single nucleotide polymorphism,SNP) would be the key to improve the accuracy of selection, to reduce the time per cycle, and to decrease the costs per cycle.
selection would then allow selected individuals being immediately propagated, if micropropa-gation protocols are available for the immediate establishment of optimized clonal trials with several years of anticipation, compared to the classical breeding scheme [37].
Integration between genomic selection and multi-trait Bayesian approach can increase pre-diction accuracy. Therefore, selection indices will be more powerful and reliable. Moreover, the identification of chromosome regions that are related to genetic control of multiple traits (pleiotropic genes) would be a useful tool aiming to increase the overall genetic gain during selection. Additionally, the use of molecular data will provide the realized genetic diversity among families since the evaluation will be based on the identical by state (IBS) information [38].
Conclusion
The Bayesian multi-traits analysis integrated with selection indices allowed obtaining selection gain for all traits simultaneously, i.e., it is possible to reduce Jatropha seeds toxicity caused by phorbol ester concentration (PEC) and to increase seed oil content (SOC).
Based on the estimated genotypic values under the Bayesian multi-trait approach, and on the evaluation of genetic gain when applying the selection index methods, 169 and 170 half-sib families presented high genotypic values forW100Sand forSOC,and low estimates forPEC. Thus, these families should be used in future diallel crossings.
Supporting Information
S1 Table. Origin for each accession used in this study.
(DOCX)
S2 Table. Identification for all jatropha accessions used in this study and the measurements for weight of 100 seeds (W100S, g), seed oil content (SOC, %), and phorbol ester concentra-tion (PEC, mg/g).
(DOCX)
Acknowledgments
We also thank the Biometric Lab of the Federal University of Viçosa, Brazil, where all analyses were carries out.
Author Contributions
Conceived and designed the experiments: BGL. Performed the experiments: BGL. Analyzed the data: VSJ LAP LLB. Contributed reagents/materials/analysis tools: SM TSAC RA. Wrote the paper: VSJ LAP.
References
1. Openshaw K. A review of Jatropha curcas: an oil plant of unfulfilled promise. Biomass and Bioenergy. 2000; 19(1):1–15.
2. Basha SD, Sujatha M. Inter and intra-population variability ofJatropha curcas(L.) characterized by RAPD and ISSR markers and development of population-specific SCAR markers. Euphytica. 2007; 156(3):375–86.
4. Franco J, Crossa J, Ribaut JM, Bertran J, Warburton ML, Khairallah M. A method for combining molec-ular markers and phenotypic attributes for classifying plant genotypes. Theoretical and Applied Genet-ics. 2001; 103(6–7):944–52.
5. Laviola BG, Alves AA, Gurgel FdL, Rosado TB, Rocha RB, Albrecht JC. Estimates of genetic parame-ters for physic nut traits based in the germplasm two years evaluation. Ciência Rural. 2012; 42(3):429– 35.
6. Akintayo ET. Characteristics and composition of Parkia biglobbossa andJatropha curcasoils and cakes. Bioresource technology. 2004; 92(3):307–10. PMID:14766165
7. Bailis R, Mccarthy H. Carbon impacts of direct land use change in semiarid woodlands converted to bio-fuel plantations in India and Brazil. GCB Bioenergy. 2011; 3(6):449–60.
8. Liberalino AAA, Bambirra EA, Moraes-Santos T, Vieira EC.Jatropha curcasL. seeds: chemical analy-sis and toxicity. Arquivos de biologia e tecnologia. 1988; 31(4):539–50.
9. Nithiyanantham S, Siddhuraju P, Francis G. Potential ofJatropha curcasas a biofuel, animal feed and health products. Journal of the American Oil Chemists' Society. 2012; 89(6):961–72.
10. Adolf W, Opferkuch H, Hecker E. Irritant phorbol derivatives from four Jatropha species. Phytochemis-try. 1984; 23(1):129–32.
11. Hayashi T, Iwata H. A Bayesian method and its variational approximation for prediction of genomic breeding values in multiple traits. BMC bioinformatics. 2013; 14(1):34.
12. Gomes RA Jr, de Lima Gurgel F, de Azevedo Peixoto L, Bhering LL, da Cunha RNV, Lopes R, et al. Evaluation of interspecific hybrids of palm oil reveals great genetic variability and potential selection gain. Industrial Crops and Products. 2014; 52:512–8.
13. Bhering LL, Barrera CF, Ortega D, Laviola BG, Alves AA, Rosado TB, et al. Differential response of Jatropha genotypes to different selection methods indicates that combined selection is more suited than other methods for rapid improvement of the species. Industrial Crops and Products. 2013; 41:260–5.
14. Bhering LL, Laviola BG, Salgado CC, Sanchez CFB, Rosado TB, Alves AA. Genetic gains in physic nut using selection indexes. Pesquisa Agropecuária Brasileira. 2012; 47(3):402–8.
15. Spinelli VM, Dias LAS, Rocha RB, Resende MDV. Estimates of genetic parameters with selection within and between half-sib families ofJatropha curcasL. Industrial Crops and Products. 2015; 69:355–61.
16. Dias LAS, Leme LP, Laviola BG, Pallini Filho A, Pereira OL, Carvalho M, et al. Cultivo de pinhã o-manso (Jatropha curcasL.) para produção de óleo combustível. Viçosa, MG: UFV; 2007. 40 p.
17. Carels N, Sujatha M, Bahadur B. Jatropha, Challenges for a New Energy Crop: Farming, Economics and Biofuel: Springer Verlag; 2013. 599 p.
18. Resende JCF, Londe LN, Neves WS. Pinhão-manso. Nova Poerteirinha-MG: Epamig; 2013. 524 p.
19. Bahadur B, Sujatha M, Carels N. Jatropha, Challenges for a New Energy Crop: Genetic Improvement and Biotechnology: Springer Science & Business Media; 2012. 601 p.
20. Makkar HPS, Aderibigbe AO, Becker K. Comparative evaluation of non-toxic and toxic varieties of Jatropha curcas for chemical composition, digestibility, protein degradability and toxic factors. Food chemistry. 1998; 62(2):207–15.
21. Misztal I, Tsuruta S, Strabel T, Auvray B, Druet T, Lee D, editors. BLUPF90 and related programs (BGF90). World Congress on Genetics Applied to Livestock Production; 2002.
22. Geweke J. Evaluating the accuracy of sampling-based approaches to the calculation of posterior moments: Federal Reserve Bank of Minneapolis, Research Department; 1991.
23. Smith BJ. boa: an R package for MCMC output convergence assessment and posterior inference. Jour-nal of Statistical Software. 2007; 21(11):1–37.
24. Plummer M, Best N, Cowles K, Vines K. CODA: Convergence diagnosis and output analysis for MCMC. R news. 2006; 6(1):7–11.
25. Team RC. R: A language and environment for statistical computing. 2012.
26. Mojena R. Hierarchical grouping methods and stopping rules: an evaluation. The Computer Journal. 1977; 20(4):359–63.
27. Milligan GW, Cooper MC. An examination of procedures for determining the number of clusters in a data set. Psychometrika. 1985; 50(2):159–79.
28. Hazel LN. The Genetic Basis for Constructing Selection Indexes. Genetics. 1943; 28(6):476–90. PMID: 17247099
30. Rosado TB, Laviola BG, Faria DA, Pappas MR, Bhering LL, Quirino B, et al. Molecular Markers Reveal Limited Genetic Diversity in a Large Germplasm Collection of the Biofuel Crop L. in Brazil. Crop Sci-ence. 2010; 50(6):2372–82.
31. Ventura HT, Silva FF, Varona L, de Figueiredo EAP, Costa EV, da Silva LP, et al. Comparing multi-trait Poisson and Gaussian Bayesian models for genetic evaluation of litter traits in pigs. Livestock Science. 2015; 176:47–53.
32. Rolf MM, Garrick DJ, Fountain T, Ramey HR, Weaber RL, Decker JE, et al. Comparison of Bayesian models to estimate direct genomic values in multi-breed commercial beef cattle. Genetics Selection Evolution. 2015; 47(1):23.
33. Peixoto LdA, Laviola BG, Bhering LL, Mendonça S, Costa TdSA, Antoniassi R. Oil content increase and toxicity reduction in jatropha seeds through family selection. Industrial Crops and Products. 2016; 80:70–6.
34. Singh P, Singh S, Mishra SP, Bhatia SK. Molecular characterization of genetic diversity inJatropha cur-casL. Genes Genome Genomics. 2010; 4:1–8.
35. Gupta P, Idris A, Mantri S, Asif MH, Yadav HK, Roy JK, et al. Discovery and use of single nucleotide polymorphic (SNP) markers inJatropha curcasL. Molecular Breeding. 2012; 30(3):1325–35.
36. Grattapaglia D, Resende MD. Genomic selection in forest tree breeding. Tree Genetics & Genomes. 2011; 7(2):241–55.
37. Alves AA, Laviola BG, Formighieri EF, Carels N. Perennial plants for biofuel production: Bridging geno-mics and field research. Biotechnology journal. 2015; 10(4):505–7. doi:10.1002/biot.201400201PMID: 25382800