2018 | Lavras | Editora UFLA | www.editora.ufla.br | www.scielo.br/cagro
http://dx.doi.org/10.1590/1413-70542018422026717
Financial and risk analysis of African mahogany plantations in Brazil
Análise financeira e de risco em plantios de mogno africano no Brasil
Andressa Ribeiro1, Carolina Souza Jarochinski e Silva2, Antonio Carlos Ferraz Filho1*, José Roberto Soares Scolforo2
1Universidade Federal do Piauí/UFPI, Departamento de Engenharias, Bom Jesus, PI, Brasil
2Universidade Federal de Lavras/UFLA, Departamento de Ciências Florestais/DCF, Lavras, MG, Brasil *Corresponding author: acferrazfilho@ufpi.edu.br
Received in October 6, 2017 and approved in February 23, 2018
ABSTRACT
Wood demand is increasing in quality and quantity, and economic studies are fundamental to analyze the feasibility of forest projects. These researches are in line with management and silvicultural studies, highlighting growth and yield modeling. This paper proposes an economic evaluation of implementation of African mahogany stands in Brazil under different perspectives of forest management. Data are from plantations ranging from 1.1 to 15 years old in different Brazilian regions. Financial analysis was undertaken using Net Present Value (NPV), Internal Rate of Return (IRR) and Equal Annual Equivalent (EAE) for a 20-year period considering three thinning management regimes (A - unthinned, B - one thinning at age 10 years remaining 150 trees ha-1 and C - two thinnings, first at age 8 remaining 150 trees ha-1 and
second at age 15 years remaining 75 trees ha-1) considering an initial density of 278 trees ha-1. A Monte Carlo simulation was performed
considering six risk variables. Results showed that the discount rate is the variable that most influences the viability of the project. All site indexes in all management regimes lead to a feasible financial return, with NPV values ranging from 25,053 to 125,780 Brazilian reais per hectare, being regimes B and C the best ones. The probability for an unfeasible investment is almost zero, highlighting African mahogany as a great forest investment opportunity, providing high interest rates values (14% to 25%), superior to most available market rates of return.
Index terms: Forest investment; Monte Carlo simulation; financial risk.
RESUMO
O crescimento da demanda por madeira se dá em qualidade e quantidade, sendo os estudos econômicos fundamentais na análise
da viabilidade de projetos florestais. Tais estudos estão alinhados aos estudos de manejo e silvicultura, destacando a modelagem do crescimento e produção. Este trabalho propõe a avaliação econômica da implantação do mogno africano no Brasil sob diferentes perspectivas de manejo florestal. Os dados são provenientes de plantios com idades variando de 1,1 a 15 anos localizados em diferentes regiões do Brasil. Uma análise financeira foi realizada utilizando o Valor Presente Líquido (VPL), Taxa Interna de Retorno (TIR) e Valor Anual Equivalente (VAE) para uma rotação de 20 anos de idade considerando diferentes regimes de desbaste (A - não desbastado, B - um desbaste aos 10 anos de idade com 150 árvores por hectare remanescentes e C - dois desbastes, primeiro na idade de 8 anos remanescendo 150 árvores por hectare e segundo aos 15 anos com 75 árvores por hectare remanescentes) considerando uma densidade inicial de 278 árvores por hectare. Uma simulação de Monte Carlo foi realizada levando em consideração diferentes variáveis de risco. Os resultados mostraram que a taxa de desconto foi a variável que mais influenciou a viabilidade do investimento. Todas as classes de sítio nos diferentes regimes de manejo apresentaram valores de VPL positivos, variando de 25.053 a 125.780 reais por hectare, sendo os regimes B e C os melhores. A simulação de Monte Carlo mostrou que a probabilidade de insucesso do investimento é praticamente zero, destacando o mogno africano como uma boa opção para investimento florestal, uma vez que possui altos valores de taxa interna de retorno (14% a 25%), superiores à maioria das taxas de investimento disponíveis no mercado.
Termos para indexação: Investimento florestal; simulação de Monte Carlo; risco financeiro.
INTRODUCTION
In recent years the Brazilian forest sector has become one of the most important players in a global scale. With an area of 7.8 million hectares of planted forests, the sector is responsible for 91% of all wood produced for industrial purposes in the country and has great potential to contribute to building a green economy (Ibá, 2017). According to Duerr (1960) in all parts of the world the
Financial evaluation of forest management regimes through simulation processes can be done by aggregating economic criteria to volumetric results supplied by growth and yield models (Hiesl et al., 2016). Modeling the diameter distribution and applying a taper function allows description of biological and economical information of forest stands, providing answers to plan management practices, permitting to valuate in detail the yield of the forest (Matheus; Tomé, 2011; Tang et al., 2016) and providing knowledge of forest assortment, and its evolution over time, essential for planning of the use of the different material produced (Figueiredo Filho et al., 2014). Financial analysis examines the costs, returns and project selection for a unique community, owners or companies, with the intention of maximizing the return on invested capital measured as the purchase and selling at market prices (Cubbage et al., 2013) and is essential to decision making.
Simulations of total volume and wood price for African mahogany stands in Brazil exists (Mudas Nobres,
2013), but are not yet confirmed, since the majorities of the
K. ivorensis stands are far from the final rotation. According to Wagner, Kiernan and Bavilacqua, (2013), estimating the
influence of silvicultural treatments on forest growth and
yield has a long and rich history in literature and practice, also being true for the economic valuation of even-aged silvicultural treatments (e.g. thinning and fertilization) and determining optimal rotation age or cutting cycle length. The available market for Khaya spp. products from native forests has, in the recent years, motivated farmers to grow the species as a cash crop (Nikles et al., 2008). However,
there is limited data on costs and benefits of the species
production in Brazil, as well as little information on management and silvicultural treatments. Hence, the present study assessed economic viability of K. ivorensis cultivation withthe objective of providing information on yields, costs,
and benefits of growing African mahoganyfor multiple purposes production based in previous volume prognosis
information from Brazilian plantations. The hypothesis of this study is that the crop will provide investment returns larger than most available market rates of return.
MATERIAL AND METHODS
Data
Data were collected from continuous forest inventories of African mahogany stands located in different Brazilian regions (Southeast, Midwest and North) with ages varying
between 1.3 to 15 years old. The site index classification was
done in previous research (Ribeiro et al., 2016), as was the growth and yield modelling. A taper function was applied to estimate volume by products (Table 1). Different management
regimes were simulated: (A) without thinning and final cut at
age 20; (B) one thinning operation at age 10 and the remaining
forest data projected to 20 years as final rotation age and (C) two thinning operations, first at age 8, second at age 15 and final cut at age 20 years.
Revenues were derived by multiplying estimated timber volume by mean values of tropical timber (Table 1), since no data are available for sale of African mahogany timber from plantations in Brazil. When estimating value of forest property, the most common way to incorporate timber prices is to apply mean prices based on the realized prices of the past, assuming that future price development is in accordance with past development (Holopainen et al., 2010).
Costs were based in personal information from forest consultants during the year of 2016, open data available on websites, values reported by Pinheiro et al. (2011) for African mahogany crop in Brazil and values reported by Cubbage et al. (2014) for pines and eucalyptus in Brazil. Since forest investments are affected by diverse factors, some
of which are difficult to measure due to dynamic business
environment (Langat; Cheboiwo; Muchiri, 2015), it was necessary to make assumptions to reflect the likely scenarios
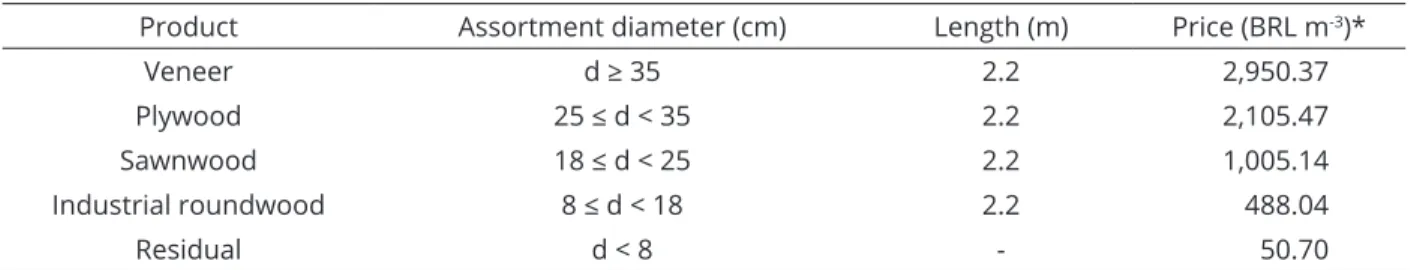
*Mean values for tropical timber sales are from Annual Review Statistics Database of International Tropical Timber Organization (Itto, 2017b) based on year of 2014, provided in US dollars and converted to Brazilian Real (BRL) by a 3.21 exchange rate average in May/2017 (BCB, 2017).
Table 1: Wood assortments specifications and sale prices for African mahogany products.
Product Assortment diameter (cm) Length (m) Price (BRL m-3)*
Veneer d ≥ 35 2.2 2,950.37
Plywood 25 ≤ d < 35 2.2 2,105.47
Sawnwood 18 ≤ d < 25 2.2 1,005.14
Industrial roundwood 8 ≤ d < 18 2.2 488.04
to ease the complexity of the analysis, such as wood sale
prices, costs of harvesting (fixed harvest yield for all site
indexes, since the difference in diameter was estimated to be around 5 cm from the less to higher productivity), among others. All implementation costs (e.g. tillage, herbicides application, ant control, planting, replanting) may vary due to local peculiarities and particularities of each grower, with less obvious effects in economic analysis (Rezende et al., 2006). We adopted the same total average prices for all site indexes and assumed adequate edaphic and climate conditions for crop implementation, without the need of irrigation system. Total costs varied from BRL 81,317 to 105,485 per hectare, depending on site and thinning regime. Initial density of 278 trees per hectare was considered and the costs, presented in Table 2, were developed as follows:
l costs of activities and inputs required for implementation, including machines and labor for land preparation (plowing, harrowing, pitting and planting);
l seedling purchase and transportation;
l fertilization and mid-rotation fertilization;
l general cleaning (slashing, herbicide and ant control);
l general maintenance (administration and management);
l cost of harvest (felling, bucking and hauling timber to the nearest accessible road) set at BRL 55.00 per cubic meter for thinning and clear-cut wood;
l land value estimated using mean value presented by Cubbage et al. (2014) for Brazilian forest investment, set as BRL 15,210.00 per hectare for all sites.
Capital budgeting calculation
Financial analysis was undertaken using Net Present Value (NPV), Internal Rate of Return (IRR) and Equal Annual Equivalence (EAE) for a 20-year period considering unthinned or two thinning regimes (A - unthinned, B - one thinning at age 10 years with 150 trees
remaining per hectare and C - two thinnings, first at age 8
with 150 remaining trees per hectare and second at age 15
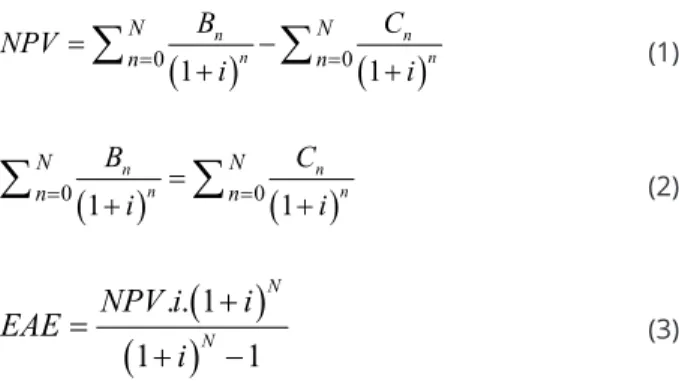
with 75 trees remaining per hectare) for African mahogany stands planted with initial density of 278 trees per hectare. The NPV (Equation 1) is the present value of expected future revenues minus the present value of expected future costs, with the costs and benefits discounted at the appropriate interest rate. The IRR (Equation 2) is the rate of interest at which the initial
investment NPV is zero, being the level of profit expected
from an investment project expressed as an equivalent annual percentage rate of interest on all the money invested in that project. The EAE (Equation 3) is simply the NPV converted to an annual value paid at the end of each year or period for the life of the investment, in our case 20 years.
Activity Year Cost (BRL ha-1)
Implementation 0 2,348.00
Seddling 0 1,699.00
Fertilization 0,2,4,6,10,14,18 2,634.00
General cleaning 0,2,4,6,8,10,12,14,16,18 880.00
General maintenance 1 to 10 678.00
General maintenance 11 to 20 512.50
Table 2: General costs for planting and maintenance of 1 hectare of K. ivorensis considering a 20 years rotation
using 6x6 meters spacing.
where n = year number; Bn = benefit in year n; Cn = cost
in year n; i = annual discount rate and N = rotation length.
A discount rate is the interest rate applied to convert future revenue streams and costs to present values and rates. For Gregersen and Contreras (1992), the rate for smallholder tree growers will tend to be higher than the rate for well-established, low risk companies borrowing from regulated banks, being in many cases, a rough approximation of the average of the various rates relevant to different individuals, suggesting the use of an estimated average bank lending rate. We adopted in our analysis a (1)
0 0 1 1 n n n n N N n n B C NPV i i
0 0 1 1 n n n n N N n n B C i i
(2)
. . 1
1 1
N
N
NPV i i
EAE
i
discount rate of 10% per year. This value is constantly used in forest investments analyses in Brazil (Mileski et al., 2016). Discount rates used in forestry investments range from as low as 6% in the northern hemisphere to 15% in the southern hemisphere (Cubbage et al., 2014).
Positive NPVs indicate that a timber investment would be an acceptable option in order to receive an annual rate of return higher than 10%. In practice, forest landowners often accept rates of return less than 10% (Cubbage et al., 2014). Greater NPVs, IRRs and EAEs
indicate preferred investments based on these financial
criteria. The NPV concept is an important tool in forest economics, but the NPV of forested land is subject to various uncertainties, since in forestry revenues and expenses are estimated using yield value simulations, sources of uncertainty include growth and yield models used in the simulators, development of timber prices, the rate of interest used and uncertainties in the input data (Holopainen et al., 2010).
The uncertainty caused by inadequate data, price
and costs information and the influence of discount rate was verified using a probability risk analysis through a Monte
Carlo simulation (Arnold; Yildiz, 2015). Monte Carlo simulations, in their simplest form, proceed by taking a
random value from a specified probability density function
of each variable in the model. The process is repeated for a very large number of iterations, for each iteration, the result is stored and, at the end of all repetitions, the sequence of generated results is transformed into a frequency distribution that makes it possible to calculate descriptive statistics, such as average (expected value), minimum value, maximum value and standard deviation (Saraiva; Tabosa; Costa, 2011). The simulations were done using the @RISK 7.5 software (Palisade, 2017) and the input variables followed a symmetrical triangular distribution, with central peak (mode) and endpoints (minimum and maximum). The triangular distribution is easy to understand and commonly used in uncertainty analysis when there is no credible information about the probability distribution of the weighted variables in the stochastic model (Simões et al., 2016).
Sensitivity analysis was used to assess the relative importance or contribution of variables to the overall uncertainty of the analysis and used to prioritize effort to reduce uncertainty. In practice, the analysis is carried out by changing the parameter or component (input) and observing the corresponding effect on predicted output (Soares et al., 1995). In our study, the NPV value was
chosen as output. Spearman rank correlation coefficients
were used to quantify individual variable’s contribution by ranking the values simulated in the Monte Carlo
process. Therefore, a sensitivity analysis was conducted by changing the input of six major variables while holding all other input variables constant: (1) implementation cost (±
10%), (2) different discount rates (8%, 10% and 12%), (3) forest production (± 30%), (4) wood product sale price (± 50%), (5) land cost (± 25%) and (6) harvest cost (± 40%).
RESULTS AND DISCUSSION
Financial returns
Estimated mean values of stand variables and volume harvested from K. ivorensis standsin Brazil by product and site indexes are presented in Table 3 for situation A (no thinning), B (1 thinning) and C (2 thinnings).
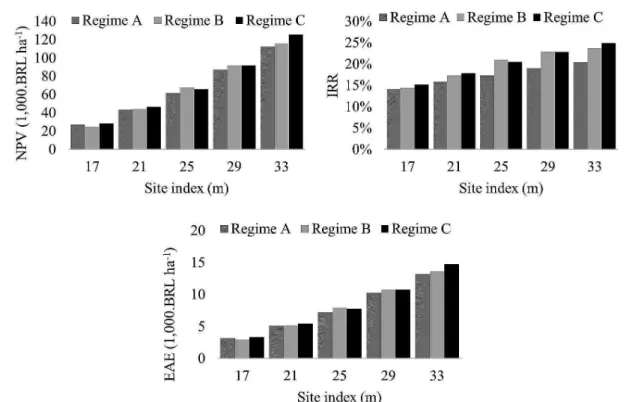
These values were used to calculate the cash flow revenue,
multiplying the volume (Table 3) per product price (Table 1). Adopting a 10% discount rate, all situations lead to economic viability for K. ivorensis investments in Brazil (Figure 1) when analyzing NPV, IRR and EAE values. For the most productive site, a 2-thinning management (regime C) yielded higher income when analyzing all the economic criteria values (Figure 1), although for site 29 a slight superiority of regime B (1 thinning) occurred. For less productive sites (17 and 21), a 2-thinning management (regime C) was also the most profitable, although the superiority of the values is not eminent for site 17 when compared to regime A, considering that the cost of harvest increased the total cost and the thinning revenue was not very
significant (low volume - Table 3). For the average site (25) just 1 thinning (regime B) was the most profitable scenario.
This can be explained by the high wood volume remaining
for the final cut (Table 3). Final cut volume has a great impact
on the economic viability of the project, since it presents logs with larger dimensions and, consequently, higher market
values. The economic viability has direct influence of site
productivity, since it is a proxy for wood production, which
can be verified when comparing projects with the same time
horizon in distinct sites, the site with higher quality has higher volumes per assortment and, consequently, higher investment return (Folmann et al., 2014).
The reason why treatment A had a lower economical return compared to the other thinning strategies was due
to the smaller dimensions of the logs produced in the final
cut age, increasing the proportion of products of lower
profitability and reducing the volume of higher priced wood
thinning of lower intensity produced smaller logs in the final cut and consequently lower economic returns. A previous study evaluating thinning regimes in Spruce-Fir stands indicated that the less intense thinning returned the highest merchantable volume, however, the additional volume
was not enough to yield a significantly higher maximum
NPV (Hiesl et al., 2016). According to these authors, these
findings can be attributed to the fact that the most intensive
thinning resulted in a greater sawlog production at the time
of final cut, which is valued at a higher price.
Regime Stand variables* Wood volume harvested by product (m³ ha-1)* S t N d H G Ven. Ply. Sawn. Round. Residual Total
(A) Final cut
17 20 197 36.4 20.6 21.3 51.86 126.95 39.86 13.91 2.49 235.07 21 20 206 37.1 23.5 22.9 66.22 161.60 45.33 12.07 2.47 287.69 25 20 210 38.4 26.3 24.7 67.90 224.39 40.10 11.38 3.03 346.80 29 20 209 39.3 29.0 26.1 146.93 201.29 38.19 15.10 2.88 404.39 33 20 199 40.9 31.7 27.3 222.40 178.45 45.55 15.34 2.79 464.53
(B) 1st thinning
17 10 245 24.4 15.4 11.8 0.00 0.14 13.14 9.64 0.71 23.63 21 10 256 25.4 17.7 13.3 0.00 4.78 20.20 11.88 1.05 37.91 25 10 262 26.8 20.0 15.0 0.00 13.16 31.44 10.37 1.23 56.20 29 10 258 27.9 22.2 16.1 0.00 14.60 32.28 11.70 0.95 59.53 33 10 245 29.4 24.4 17.2 0.00 13.01 30.61 10.23 0.93 54.78
(B) Final cut
17 20 150 38.4 20.8 17.6 37.54 122.30 24.93 8.82 1.90 195.49 21 20 150 38.9 23.8 18.0 52.42 140.50 26.15 7.81 1.62 228.50 25 20 150 39.8 26.6 18.8 55.21 178.63 22.09 7.93 2.08 265.94 29 20 150 41.2 29.3 20.2 120.80 163.83 19.52 9.57 2.12 315.84 33 20 150 43.1 32.0 22.3 194.29 148.54 27.43 8.87 1.97 381.10
(C) 1st thinning
17 8 253 21.1 13.6 9.2 0.00 0.00 5.00 13.12 0.64 18.76 21 8 265 22.2 15.7 10.5 0.00 0.00 13.61 15.75 1.26 30.62 25 8 271 23.7 17.9 12.1 0.00 1.23 25.07 17.07 1.66 45.03 29 8 267 24.7 19.8 13.1 0.00 4.70 29.00 15.50 1.18 50.38 33 8 253 26.2 21.9 14.2 0.00 5.76 27.27 14.37 1.06 48.46
(C) 2nd thinning
17 15 150 34.1 19.0 13.9 0.59 36.93 23.01 5.41 1.03 66.97 21 15 150 34.8 21.7 14.4 4.84 46.39 25.60 4.35 1.04 82.22 25 15 150 35.8 24.3 15.2 6.92 64.96 22.29 3.78 1.22 99.17 29 15 150 37.1 26.8 16.4 13.84 73.03 18.22 5.87 1.16 112.12 33 15 150 39.3 29.4 18.5 28.41 77.84 21.52 5.93 1.13 134.83
(C) Final cut
17 20 75 42.9 21.3 10.8 52.22 56.58 8.65 4.43 0.75 122.63 21 20 75 43.1 24.3 11.1 62.14 69.18 7.16 4.52 1.09 144.09 25 20 75 43.7 27.1 11.3 67.46 82.84 5.82 5.10 1.55 162.77 29 20 75 45.5 29.9 12.3 119.17 63.91 7.46 3.70 0.75 194.99 33 20 75 48.3 32.7 14.1 170.49 59.97 9.85 4.01 0.86 245.18 Table 3: Stand variables andwood volume harvested by product for different thinning regimes.
*S=site index (m); t=age (years); N= Number of trees per hectare d=diameter at breast height (cm); h= height (m); G=basal area
Sensitivity analysis
Sensitivity analysis of the model was carried out in order to infer which variables are most important to the realistic prediction of NPV for African mahogany investment (Figure 2). Spearman rank order correlation
sensitivity analysis suggests that discount rate (coefficient
values up to -0.58), wood sale price for the two most expensive products (veneer and plywood) and volume production of these products were the most relevant variables for NPV variation in all management regimes and site indexes. Figure 2 shows that the relative longer bars at
the top are the most significant variables while the shorter bars at the bottom are the least significant, for illustrative
purpose we only show results for site index 25 (Figure 2). Since discount rate is a relevant variable for the investment, we carried out a sensitivity analysis varying the values of discount rate (Figure 3). In addition to the discount
rate, other factors influence the economic viability of forest
investments, such as wood price, stand productivity and costs. The sensitivity analysis illustrates the negative relationship between NPV and discount rate. For example, in the average site index (25) and management regime B, the amplitude of the rate by 10% (from 5% to 15%)
results in a profit reduction of BRL 179,189 per hectare.
Similar behavior also arises in other thinning regimes (A
and C), confirming the high sensitivity of NPV values
when changes on discount rate occurs.
The variables of land cost, harvest cost and implementation cost also have an inverse relationship with NPV, although with small correlation values (Figure 2), but they increase the risk level of a negative NPV. Price and volume of wood products had a proportional relationship with
NPV, decreasing the risk level of unprofitable investment.
For site index 17, discount rates of up to 14% (regime A and B) and 15% for regime C lead to a negative return, turning the project not sustainable economically. For site index 21, discount rates up to 15% result in an uneconomic project. For site 25, discount rates superior to 17% (regime A) and 19% (regimes B and C) lead to negative NPV values. For site index 29, discount rates up to 18% results in negative NPV values. Finally, for site index 33, discount rates superior to 19% (regime A), 21% (regime B) and 22% (regime C) lead to negative NPV
values. As expected in lower productivity sites, the influence of
discount rate is higher on NPV values, decreasing the income, as reported by Lopez, De La Torre and Cubbage (2010). The authors analyzed pine plantation investments in Colombia and found that the increase of discount rates from 8 to 12%
significantly decreased the NPV value.
Figure 1: Net Present Value (A), Internal Rate of Return (B) and Equal Annual Equivalent (C) for all management
Risk analyses
The probability distribution of NVP can be used with success to evaluate the investment risk in African mahogany plantations. Results showed that the probability of occurrence of negative values of NPV were almost zero for all situations, and consequently, there is little perceived investment risk (considering the Figure 2: Spearman’s rank-order correlation coefficient
of the most critical input variables of the stochastic simulation model in relation to the simulated NPV for site index 25 for all regime management situations. Regime A (A); Regime B (B); Regime C (C).
Figure 3: Variation of NPV values as a function of
simulated data ranges, Figure 4). The most likely value of NPV for site index 25 and best scenario (regime B) was BRL 68,658 per hectare, with values ranging from BRL 40,000 to 102,400 per hectare considering a 90%
confidence interval. Table 4 summarizes the results
provided by Monte Carlo simulation for the other regimes and site indexes.
A relevant method to evaluate an investment project is the Net Present Value (NPV). However, if the
project is profitable (NPV>0) in a more likely scenario, it
is important to obtain information about the robustness of the result to support decision-making in the risk assessment of a project (Van Groenendaal, 1998). By analyzing the frequency of the NPV trough a Monte Carlo simulation (Figure 4) and statistics values (Table 4) for all situations,
the probability of a non-profitability investment is
inexistent in a 90% confidence interval. The results of
the simulation agree with the best regimes presented in Figure 1. For the most productive site (33) a 2-thinning management regime (C) yielded higher income (ranging from 85,300 to 177,200 BRL ha-1, considering a 90%
confidence interval), for the lowest productive sites
(17 and 21) regime C also yielded higher NPV values (12,800 to 48,000 BRL ha-1 and 26,500 to 71,600 BRL
ha-1, respectively). The average sites (25 and 29) had
regime B (1 thinning) as most profitable, with returns
ranging from 40,000 to 102,400 BRL ha-1 and 58,400 to
135,600 BRL ha-1considering a 90% confidence interval,
respectively. As is expected in any site classification,
the majority of the sites will be situated in the mean classes (21 and 25m), so the high values presented for site 33 are an exception.
The high values of the economic criteria (NPV, IRR and
EAE) confirm the attractive returns of this forest investment.
Cubbage et al. (2014), studying global timber investments and trends during the period of 2005-2011, indicated that Brazil had the greatest increase in timber investment returns during the period examined and report values of IRRs for Pinus species equal to 19% to 23%. Cubbage et al. (2010),
studying financial returns for multiproducts of Eucalyptus grandis in Brazil, found IRR and NPV returns equal to 25.5% and 18,264 BRL ha-1, respectively, although the authors did
not consider land cost and used a lower discount rate (8%). Vitale and Miranda (2010), analyzing Eucalpytus dunnni plantations for multiproducts in Brazil, reported NPV and IRR values of 38,074 BRL ha-1 and 35.8%, respectively, using
6.8% as the discount rate.
To the best of our knowledge, our research is the
first to incorporate financial risk in mahogany plantations economic analysis. Since we did not find previous risk
analyzes for African mahogany plantations, our estimates were compared with risk results for other forest species. For example, studies carried out with Eucalyptus spp. plantations in Brazil for charcoal production had a probability of 25% to obtain a negative NPV (Fernandes, 2013), 30% according Castro et al. (2007) and 0% as reported by Cordeiro et al. (2010). While for Pinus radiata
in Chile the negative NPV value had 50% probability of occurrence due to the low productivity of the sites (Carmona; Aranda, 2003). For Candeia (Eremanthus erythropapus) plantations in Brazil the risk of negative values was 9.1% (Silva et al., 2014). Our study showed lower returns for the combination between regime A and site 17 (Table 4) and, even in this less favorable situation, the probability of occurrence of negative values
was around 0.4%. This value confirms the low risk of investment in mahogany plantations, as confirmed by
Lopez, De La Torre and Cubbage, (2010) highlighting that
plantations of exotic species offer great financial returns.
CONCLUSIONS
The discount rate and wood price were the variables that
most influenced the viability of the project. All thinning regimes simulated in all site indexes lead to feasible financial return,
highlighting regime B (average productivity sites) and C (high and low productivity sites), one or two thinnings, respectively. The Monte Carlo simulation showed that the probability of an unfeasible investment is almost zero, highlighting African mahogany as an adequate forest investment. It provides high values of internal interest rates (14% to 25%), superior to most market rates of return, and positive values of NPV and EAE. Table 4:Monte Carlos simulation summary of NPV values for K. ivorensis in all thinning regimes and site indexes.
Statistics Regime A (BRL ha-1)
17 21 25 29 33
Minimum -7,674.53 -403.05 5,349.21 11,301.65 25,568.93 Maximum 98,337.22 128,359.23 162,966.17 225,520.63 290,585.66 Mean 27,748.63 44,447.82 62,756.62 88,583.39 114,112.93 Std Dev 13,475.04 17,300.77 22,206.57 27,114.60 33,457.21
Statistics Regime B (BRL ha-1)
17 21 25 29 33
Minimum -6,059.29 3,978.32 15,854.46 30,082.97 38,434.77 Maximum 82,916.02 112,095.20 159,556.74 217,019.27 254,486.29 Mean 25,621.05 44,822.65 68,658.48 93,100.07 117,513.81 Std Dev 12,156.44 15,112.51 19,123.71 23,652.40 29,707.38
Statistics Regime C (BRL ha-1)
17 21 25 29 33
REFERENCES
ARNOLD, U.; YILDIZ, O. Economic risk analysis of decentralized renewable energy infrastructures - A Monte Carlo Simulation approach. Renewable Energy, 77:227-239, 2015.
Banco Central do Brasil - BCB. Cotações, 2017. Available in: <http://www4.bcb.gov.br/pec/ taxas/ingl/ptaxnpesq. asp?id=quotations>. Access in: June, 01, 2017.
CARMONA, E. A.; ARANDA, F. D. Análisis del riesgo en la gestión forestal e inversiones silviculturales: Una revisión bibliográfica. Bosque, 24(1):113-124, 2003.
CASTRO, R. R. et al. Rentabilidade econômica e risco na produção de carvão vegetal. RevistaCerne,13(4):353-359, 2007.
CASTRO, R. V. O. et al. Avaliação econômica de um povoamento de eucalipto desbastado e destinado a multiprodutos de madeira. Scientia Florestalis,39(91):351-357, 2011. CORDEIRO, S. A. et al. Contribuição do fomento do órgão florestal
de Minas Gerais na lucratividade e na redução de riscos para produtores rurais. RevistaÁrvore, 34(2):367-376, 2010.
CUBBAGE, F. et al. Financial and Economic Evaluation Guidelines for Community Forestry Projects in Latin America. Washington, DC: Program on Forests (PROFOR) and the World Bank, Latin America and the Caribbean region. 2013, 57p.
CUBBAGE, F. et al. Global timber investments, wood costs, regulation, and risk. Biomass and Bioenergy, 34(12):1667-1678, 2010.
CUBBAGE, F. et al. Global timber investments and trends, 2005-2011. New Zealand Journal of Forestry Science, 44:112, 2014.
DUERR, W. A. Fundamentals of Forestry Economics. New York: Ed. McGraw Hill, 1960. 579p.
FERNANDES, M. L. Estudo da rentabilidade e risco da produção de eucalipto para energia em Minas Gerais. Informações Econômicas, 43(6):28-35, 2013.
FIGUEIREDO FILHO, A. et al. Dinâmica do afilamento do tronco e da produção de madeira em plantios de Araucaria angustifolia. Revista Cerne, 20(4):595-603, 2014.
FOLMANN, W. T. et al. Viabilidade de projetos florestais em três regimes de manejo na mesorregião centro-oriental do Paraná. RevistaFloresta, 44(1):153-160, 2014.
GREGERSEN, H.; CONTREAS, A. Economic assessment of forestry project impacts. Rome: FAO Forestry Paper 17, 1992, 193p.
HIESL, P. et al. Evaluating the long-term influence of alternative commercial thinning regimes and harvesting systems on projected net present value of precommercially thinned spruce–fir stands in northern Maine. Canadian Journal of Forest Research, 47(2):203-214, 2016.
HOLOPAINEN, M. et al. Uncertainty in Forest Net Present Value Estimations. Forests, 1(3):177-193, 2010.
IBÁ – Brazilian Tree Industry 2016: A report of the Brazilian Tree Industry. Relatório Anual 2016. Available in: <http://iba. org/images/shared/Biblioteca/IBA_RelatorioAnual2016_. pdf>. Access in: June, 01, 2017.
ITTO – International Tropical Timber Organization. Tropical Timber Market Report. 2017. Available in: <http://www.itto.int/files/user/ mis /MIS_16-31_May_2017.pdf>. Access in: June, 01, 2017a. 25p. ITTO – International Tropical Timber Organization. Annual
Review Statistics Database. 2017. Available in: <http://www. itto.int/annual_review_output>. Access in: May, 06, 2017b.
LANGAT, D. K.; CHEBOIWO, J. K.; MUCHIRI, M. N. Financial analysis of growing Eucalyptus grandis for production of medium size power transmission poles and firewood in Kenya. African Journal of Agriculture and Utilisation of Natural Resources for Sustainable Development, 1(1):38-45, 2015.
LOPEZ, J.; De La TORRE, R.; CUBBAGE, F. Effect of land prices, transportation costs, and site productivity on timber investment returns for pine plantations in Colombia. New Forests, 39(3):313-328, 2010.
MATHEUS, A.; TOMÉ, M. Modelling the diameter distribution of eucalyptus plantations with Johnson’s Sb probability density function: Parameters recovery from a compatible system of equations to predict stand variables. Annals of Forest Science, 68(2):325-335, 2011.
MILESKI, J. C. et al. Viabilidad económica de transporte de residuos de biomasa de actividad forestalPinus taeda. Espacios, 37(26):1-4, 2016.
MUDAS NOBRES. Você sabia que um campo de futebol de Mogno Africano rende até 500 mil reais? 2013. Available in: <http://mudasnobres.com.br/investimento-mogno-africano>. Access in: June, 06, 2017.
NIKLES, D. G. et al. Developing African mahogany (Khaya senegalensis) germplasm and its management for a
sustainable forest plantation industry in northern Australia: Progress and needs. Australian Forestry, 71(1):33-47, 2008. PALISADE CORPORATION, @RISK 7.5: Professional, Palisade
PINHEIRO, A. L. et al. Ecologia, silvicultura e tecnologia de utilizações dos mognos-africanos (Khaya spp.). Viçosa: Sociedade Brasileira de Agrossilvicultura, 2011. 102p. REZENDE, J. L. P. et al. Análise econômica de fomento florestal
com eucalipto no estado de Minas Gerais. RevistaCerne, 12(3):221-231, 2006.
RIBEIRO, A. et al. Site quality curves for African mahogany plantations in Brazil. Revista Cerne, 22(4):439-448, 2016.
SARAIVA, A. F.; TABOSA, C. M.; COSTA, R. P. Simulação de Monte Carlo aplicada à análise econômica de pedido. Produção,21(1):149-164, 2011.
SILVA, C. S. J. et al. Viabilidade econômica e rotação florestal de plantios de candeia (Eremanthus erythropappus) em
condições de risco. RevistaCerne, 20(1):113-122, 2014. SIMÕES, D. et al. Quantitative Analysis of Uncertainty in
Financial Risk Assessment of Road Transportation of Wood in Uruguay. Forests, 7(130):1-11, 2016.
SOARES, P. et al. Evaluating a growth model for forest management using continuous forest inventory data. Forest Ecology and Management, 71(3):251-265, 1995.
TANG, X. et al. Development of a Compatible Taper Function and Stand-Level Merchantable Volume Model for Chinese Fir Plantations. PLoS ONE, 11(1):e0147610, 2016.
VAN GROENENDAAL, W. J. H. Estimating NPV variability for deterministic models. European Journal of Operational Research, 107(1):202-213, 1998.
VITALE, V.; MIRANDA, G. M. Análise comparativa da viabilidade econômica de plantios de Pinus taeda e Eucalyptus dunnii
na região centro-sul do Paraná. RevistaFloresta, 40(3): 469-476, 2010.