Economic viability of the use of crude glycerin supplements in diets for
grazing crossbred calves
Vitor Visintin Silva de Almeida1, Robério Rodrigues Silva2, Augusto César de Queiroz3, Aline Cardoso Oliveira1,Fabiano Ferreira da Silva2, George Abreu Filho2, Mateus de Melo Lisboa2,
Sinvaldo Oliveira de Souza2
1 Universidade Federal de Alagoas, Arapiraca, AL, Brasil.
2 Universidade Estadual do Sudoeste da Bahia, Itapetinga, BA, Brasil. 3 Universidade Federal de Viçosa, Viçosa, MG, Brasil.
ABSTRACT - The objective of this study was to evaluate the economic returns of crossbred calves grazing on pastures formed by Urochloa brizantha fed crude glycerin as a supplement. Thirty-six crossbred calves with initial average weight of 301.5 kg were distributed in a completely randomized design with four treatments and nine replicates per treatment. The animals were maintained on rotational grazing production of Urochloa brizantha cv. Marandu. The tested treatments were 0.0, 3.33, 6.66 and 9.99% inclusion of crude glycerin in the total dry matter as a substitute for corn. The production of meat was not altered by the inclusion of glycerin in the diet. The inclusion of glycerin caused a reduction of up to 14.93% in the price of the concentrate. There was a significant increase in the total balance, which rose from 3.76 to 91.89 R$/ha with the inclusion of glycerin. The inclusion of crude glycerin in the supplement was capable of raising the net present value and the internal rate of return, proving to be an alternative to reduce the cost of production of supplemented pastured animals.
Key Words: beef cattle, biodiesel, byproducts, weight gain
Introduction
Under certain situations, rearing cattle exclusively on pastures may generate unfavorable outcomes, since none of the essential nutrients are present on pasture in adequate levels to meet the animal requirements. Thus, supplements should be considered as a complement to the animal diet so as to provide nutrients lacking in the available fodder (Reis et al., 1997).
To improve efficiency and optimize profits is a continuous objective in the study of cattle production. In the case of cattle production on pasture, in some cases the use of supplements may not be economically viable, since the cost with feeding is significantly elevated in some seasons of the year due to oscillations of the prices of ingredients such as corn, which motivates the relentless search for alternative foods. Thus, it is the responsibility of nutritionists to come up with feeding strategies that reduce the costs of production.
Therefore, the search for alternative foods to corn and feeding alternatives that reduce the cost of production has been constant. The use of oilseeds to produce ethanol and biodiesel in Brazil has generated an excess byproduct, especially in the production of biodiesel, named crude glycerin. It is reported that for every 90 m³ of biodiesel produced through the transesterification reaction, 10 m³ of crude glycerin are generated (Gonçalves, 2006).
The economic evaluation of the experimental results is then extremely important, given that producers and specialists will have more available information to determine the best ways to use crude glycerin in supplements for cattle, allowing its prudent and economic use.
Amongst the procedures utilized for the economic evaluation of livestock production, the production cost is one of the main criteria, and can be defined as the sum of the values of all resources that are used in the productive process of an activity (Frank, 1978). Economic analysis is the comparison of the revenue obtained with the costs of the productive activity, and in some cases it includes the risks, which allows for determining the remuneration of the resources employed in the productive process (Reis, 2002).
The objective of the present study was to evaluate the economic returns of the inclusion of crude glycerin supplements in the diet of crossbred calves reared on pastures of Urochloa brizantha cv. Marandu.
ISSN 1806-9290
www.sbz.org.br R. Bras. Zootec., 43(7):382-389, 2014
Received March 1, 2013 and accepted April 8, 2014. Corresponding author: vsazootec@yahoo.com.br http://dx.doi.org/10.1590/S1516-35982014000700007
Material and Methods
Thirty-six crossbred calves with an initial average weight of 301.5 kg were distributed in a completely randomized design with four treatments and nine replicates per treatment.
The experimental period began in December and ended in April, totaling 154 days, 14 of which were used for the animals to adapt to the management and experimental diets. The animals were maintained in a pasture production system of Urochloa brizantha cv. Marandú, under rotational grazing. The area comprised 14 hectares, divided into eight fenced areas of equal size.
The tested treatments were: 0.0, 3.33, 6.66, and 9.99% of inclusion of crude glycerin in the total dry matter (TMD) as a substitute for corn. The crude glycerin adopted in this study derived from a biodiesel-producing industry that used soybean meal as raw material.
The diets were formulated according to the NRC (2000) to be isoproteic and isoenergetic. Diets were supplied daily at 10.00 h (Table 1), at a roughage-to-concentrate ratio of 60:40.
The pasture was evaluated every 28 days to estimate the availability of DM, and twelve samples were harvested – cut at soil level within a 0.25 m2 square frame – according to the methodology described by McMeniman (1997). Eight fenced areas were used, defined in the beginning of May. To reduce the influence of the variation of biomass among fenced areas, the calves remained in each fenced area for seven days; after this period, they were transferred to another, in a pre-established, randomized manner.
The estimates of residual dry biomass (RDB) were undertaken in four fenced areas, according to the double-sampling method (Wilm et al., 1994). The triple-pairing technique (Moraes et al., 1990) was used to study the accumulation of biomass over time, with the four fenced areas, which remained closed for 28 days to function as controls. The accumulation of DM in the different
experimental periods was calculated by multiplying the value of the daily accumulation rate (DAR) by the number of days in the period.
The dry matter DAR was estimated by the equation proposed by Campbell (1966). The capacity rate (CR) was calculated considering the animal unit (AU) as 450 kg of live weight (LW).
Forage availability (FA) was calculated according to the following formula:
FA = ([RDB + DAR]/LW) × 100,
in which: FA = forage availability, in kg DM/100 kg LW/day; RDB = total residual dry biomass, in kg of DM/ha/day; DAR = daily accumulation rate, in kg DM/ha/day; LW = live weight of the animals, in kg/ha.
The potentially digestible dry matter (pdDM) from the pasture was estimated as described by Paulino et al. (2006).
Fecal production, intake and digestibility were estimated twice during the experimental trial; the first between the 37th and 41st days, and the 2nd between the 107th and 111th days of the experimental period.
To estimate fecal production, chromic oxide was used as an external marker, supplied daily for twelve days at 09.00 h in a single dose of ten grams packaged in paper, for twelve days, with seven days for adaptation and regulation of the flow of excretion of the marker and five days to collect the feces.
The feces were collected once daily for five days, at the time of administration of the marker, directly from the rectal ampulla, and stored in a freezer at −10 ºC. The samples of feces were analyzed by atomic absorption spectrophotometry for chromium dosage. The fecal excretion was estimated using chromium oxide, calculated based on the ratio between the quantity of the indicator supplied and its concentration in the feces.
The concentrate DM intake was estimated using titanium dioxide as marker, which was supplied at 10 g per animal, mixed into the concentrate for twelve days, according to the procedure described by Valadares Filho et al. (2006).
Internal marker indigestible neutral detergent fiber (iNDF) was used to estimate the voluntary roughage intake, obtained by ruminal incubation of 0.5 g of samples of feeds, orts and feces for 240 hours (Casali, 2006) using little non-woven fabric (TNT) bags (5 × 5 cm; grammage 100 g.m2). The remaining material from the incubation was subjected to extraction with neutral detergent to determine the iNDF.
The concentrations of dry matter (DM), ash, crude protein (CP) and ether extract (EE) in the feed samples were determined according to Silva and Queiroz (2002) (Table 2).
Table 1 - Proportions of the ingredients of the supplements (as fed)
Ingredient (g/kg) Inclusion of glycerin (g/kg DM)
0.0 33.3 66.6 99.9
Corn grain 907.0 788.0 665.0 550.0
Soybean meal 29.0 50.0 72.0 93.0
Glycerin 0.0 97.0 196.0 289.0
Urea 29.0 29.0 29.0 30.0
Mineral mix1 15.0 15.0 16.0 16.0
Limestone 14.0 14.0 13.0 13.0
Phosphate 6.0 7.0 9.0 10.0
1 Percent composition: sodium chloride (NaCl) - 47.15; dicalcium phosphate - 50;
The total carbohydrates (TC) were estimated according to Sniffen et al. (1992), as: TC = 100 – (%CP + %EE + %ash).
The non-fibrous carbohydrates corrected for ash and protein (NFCap) were calculated as proposed by Hall (2003): NFCap = (100 – %NDFap – %CP – %EE – %ash).
The total digestible nutrients (TDN) were calculated according to Weiss (1999), but using the NDF and NFC corrected for ash and protein. The total estimated digestible nutrient levels of the total feeds and diets were calculated according to equations described by the NRC (2000).
The animals were weighed at the beginning and end of the experiment as well as every 28 days to determine the average daily body weight gain and to adjust the supply of the supplement. The animal performance was determined as the difference between the initial body weight (IBW) and the final body weight (FBW) divided by the number of days of the experimental period.
The following indicators of economic viability were calculated according to Silva et al. (2010):
– initial body weight (kg); – final body weight (kg); – initial age of the animals; – pasture area per treatment; – average daily weight gain (g); – concentrate intake;
– price of concentrates; – number of animals;
– average weight in the period (average between final body weight and initial body weight, in kg);
– average weight, in AU/animal (average weight in the period divided by 450 kg, which equals 1 AU);
– capacity rate, in AU/ha (average weight in AU/animal multiplied by the number of animals and divided by the pasture area, in ha);
– average daily gain (average considered from the supplementation phase, 140 days);
– production in kg CP/ha 140 days (final body weight, in kg, minus initial body weight, multiplied by the number of animals and divided by the pasture area, in ha);
– carcass yield (obtained from JBS slaughterhouse in Itapetinga City for animals of the same genetic standard);
– meat production (kg CP/ha/year multiplied by carcass yield);
– meat production (@/ha 140 days);
– concentrate intake (intake of concentrate per animal/ day multiplied by the nine animals from each group and by the 140 days of the supplementation period, and divided by the 3.5 hectares of pasture);
– cost of concentrate (intake, in kg/ha 140 days, multiplied by price, kg);
– cost with concentrate (cost of concentrate, in R$/ha 140 days, divided by the production of meat, in @/ha year);
– labor;
– medicines, maintenance of fences, maintenance of
Table 2 - Chemical composition of Urochloa brizantha and of the total diets, available forage, and feed intake
Item Urochloa brizantha Inclusion of glycerin (g/kg DM)
0.0 33.3 66.6 99.9
Chemical composition (g/kg DM)
Dry matter 279.4 923.0 932.0 930.0 921.5
Crude protein 77.8 176.8 179.4 183 185.5
Ether extract 21.5 25.3 33 36.7 41.3
Total carbohydrates 805.4 748.5 673.1 595.4 568.1
Non-fibrous carbohydrates 220.9 657.7 592.1 527.5 498.4
NDFap 629.2 110.2 89,0 67.9 62,0
Acid detergent fiber 334.5 47.2 46.3 45.7 36.5
Ash 93.7 49.5 52.9 57.9 64.3
Total digestible nutrients1 648.9 846.1 857.5 863.2 863.6
Forage availability
Total availability of DM (kg/ha) 3,579.67
Availability of dry matter per day (kg/ha) 2,118.50
Biomass residue (kg DM/ha day) 100.25
Daily accumulation rate (kg DM/ha day) 44.86 Available forage (kg DM/100 kg CP day) 13.24
Capacity rate (AU/ha) 1.93
Feed intake
Supplement (kg/day) 2.75 2.75 2.75 2.75
Pasture (kg/day) 5.07 5.28 5.51 4.95
Total matter (kg/day) 7.62 8.03 8.26 7.70
Total matter (%CP) 2.09 2.20 2.26 2.25
NDFap - neutral detergent fiber corrected for ash and protein.
pastures and taxes (in R$ per @, obtained from ANUALPEC (2010));
– total cost per @ produced (cost of concentrate + cost of mineral supplement + labor + medicines + maintenance of fences + maintenance of pastures + taxes, in R$/@);
– average price of the meat (historical average of prices of the @ of fattened steer (ANUALPEC, 2010);
– gross income (average price of meat sold, in R$/@, multiplied by production, @/ha 140 days);
– gross income per animal/140 days (gross income, in R$, per hectare/140 days multiplied by the result of the division of the area used by the animals that occupied it);
– gross income per treatment/140 days (gross income, in R$/ha 140 days, multiplied by the total area);
– total cost of production of meat (in R$/@ produced multiplied by the production per hectare/140 days);
– balance per hectare/140 days (gross income/ha 140 days minus the total cost per hectare/140 days, in R$);
– acquisition price of the @ of the unfattened steer (average value in the period, according to ANUALPEC (2010));
– purchase of the unfattened steer, in R$, per hectare/ 140 days (price of the @ of the unfattened steer multiplied by the quantity of initial @ of each animal, multiplied by the number of animals, and divided by the pasture area in each group); and
– capital invested per hectare/140 days (sum of the total cost, in R$/ha 140 days + purchase of the unfattened steer, in R$/ha 140 days).
The economic variables of operating profit (OP) and rate of profitability (RP) were adapted from Martin et al. (1998), in which the operating profit denotes the monetary value obtained with the sale of the animals, which becomes available after the producer discounts the cost of feed. The rate of profitability indicates the available rate of revenue after the payment of the cost of feed. To calculate the relationship between the profit margin and gross income (GI), the following equation was considered:
RP = (OP/GI) × 100,
in which RP = rate of profitability (%); OP = operating profit (R$); and GI = gross income (R$).
For the study of economic analysis, two economic indicators were used: the net present value (NPV) and the internal rate of return (IRR).
The equation for the calculation of the NPV is:
VPL VF R t
t n i
= +
= =
∑
/ (1 )0
,
in which VPL = net present value; VF = net cash flow (difference between inflows and outflows); n = number of flows; R = discount rate; and t = period under analysis
(I = 1, 2, 3…). In the calculation of the NPV, three discount rates about the monthly liquid flow were applied from each production system. The rates adopted were 4, 8 and 12% per year.
For the internal rate of return, according to the criteria of acceptance, as the result obtained in the project was increased, the attractiveness for its implementation also increased. Thus, the internal rate of return is the value of r, which equals zero in the equation:
VPL VF VF
R
VF R
VF R
VF R
n n
= +
+ + + + + + + +
0 (1 1)1 (1 2)2 (1 3)3 ... (1 ) ,
in which VF = net cash flow (0, 1, 2, 3…n); and r = discount rate.
The data on intake and average daily weight gain were evaluated by variance and regression analyses, using the SAEG software (Sistema para Análises Estatísticas e Genéticas, 2001). The statistical models were chosen according to the significance of the regression coefficients, using the “t” test at 5%, determination coefficient (R2) and with the biological phenomenon studied.
Results
Because no difference (P>0.05) was found in the intake of DM from pasture (5.2 kg) and concentrate (2.7 kg) between the treatments (Table 2), it can be stated that the inclusion of glycerin in the concentrate did not provoke any associative effect on forage intake. The intake of total DM as kg/day and %CP was not affected (P>0.05) by the inclusion of crude glycerin, averaging 7.9 kg and 2.20 %CP.
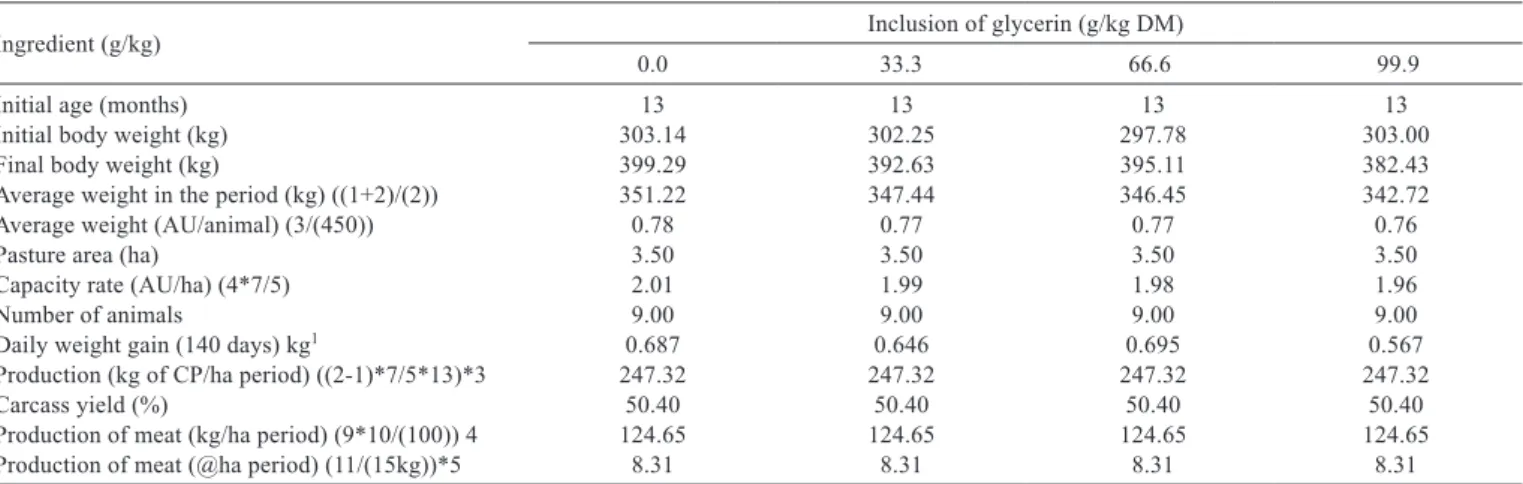
Crude glycerin did not affect the performance of the animals (P>0.05), which showed an average value of 649 g/day (Table 3).
The capacity rate was not changed by the inclusion of glycerin, which showed a higher average value of 1.98 AU/ha, and the same forage availability of 13.24 kg DM/100 kg CP day (Table 2) was maintained among the treatments, which was capable of maintaining satisfactory gains.
The production of meat (124.65 kg/ha or 8.31@ha) was not changed by the inclusion of glycerin in the diet, thereby reflecting the standard response observed for the ADG.
should be the reduction in the cost of the kilogram of the concentrate, which showed a reduction of 14.93% with the maximum inclusion of glycerin.
Taking into consideration that there was no difference in the production of meat, the gross income was not changed, showing an average value of R$ 664.80/ha (Table 5). And with the reduction of 13% in the total cost per hectare, there was a significant increase in the total balance.
The rates of return, with the inclusion of values spent on acquisition of animals (Table 6), demonstrate a marked increase in all variables, due to the inclusion of glycerin.
The operating profit (OP) rose by R$88.13/ha period with the inclusion of glycerin, an increase of 119%; this response being to the OP, since this value results from the sales of the animals, which becomes available after discounting the cost of feed. The same response was observed for the profitability index (PI), which indicates the available rate of return after the payment of the cost of feed, increasing from 11.18% in the control treatment to 24.43% at the level of 9.99% of inclusion of glycerin.
The net present value was positive for all treatments, but higher with the addition of glycerin (Table 7).
Table 3 - Performance and size indicators used in the structuring of the models that characterize the tested treatments
Ingredient (g/kg) Inclusion of glycerin (g/kg DM)
0.0 33.3 66.6 99.9
Initial age (months) 13 13 13 13
Initial body weight (kg) 303.14 302.25 297.78 303.00
Final body weight (kg) 399.29 392.63 395.11 382.43
Average weight in the period (kg) ((1+2)/(2)) 351.22 347.44 346.45 342.72
Average weight (AU/animal) (3/(450)) 0.78 0.77 0.77 0.76
Pasture area (ha) 3.50 3.50 3.50 3.50
Capacity rate (AU/ha) (4*7/5) 2.01 1.99 1.98 1.96
Number of animals 9.00 9.00 9.00 9.00
Daily weight gain (140 days) kg1 0.687 0.646 0.695 0.567
Production (kg of CP/ha period) ((2-1)*7/5*13)*3 247.32 247.32 247.32 247.32
Carcass yield (%) 50.40 50.40 50.40 50.40
Production of meat (kg/ha period) (9*10/(100)) 4 124.65 124.65 124.65 124.65
Production of meat (@ha period) (11/(15kg))*5 8.31 8.31 8.31 8.31
1 Ŷ = 0.649.
Table 4 - Operating costs used in the composition of total production costs
Ingredient (g/kg) Inclusion of glycerin (g/kg DM)
0.0 33.3 66.6 99.9
Meat production (@/ha period) 8.31 8.31 8.31 8.31
Concentrate intake (kg/animal day)1 2.75 2.75 2.75 2.75
Concentrate intake (kg/ha period) 990.00 990.00 990.00 990.00
Estimated price of concentrate (R$/kg) 0.60 0.57 0.54 0.51
Cost of concentrate (R$/period/ha year) (2*3) 590.49 560.28 530.07 502.36
Cost of concentrate (R$/@) (4/0) 71.06 67.42 63.79 60.45
Labor (R$/@) 3.22 3.22 3.22 3.22
Medicines (R$/@) 0.87 0.87 0.87 0.87
Maintenance of fences (R$/@) 0.96 0.96 0.96 0.96
Maintenance of pastures (R$/@) 3.10 3.10 3.10 3.10
Taxes (R$/@) 0.39 0.39 0.39 0.39
Total cost (R$/@) (6+7+…+10) 79.60 75.96 72.33 68.99
1 Ŷ = 2.75
Table 5 - Prevision of gross income, total operating cost and balance of the activity by levels of glycerin inclusion
Ingredient (g/kg) Inclusion of glycerin (g/kg DM)
0.0 33.3 66.6 99.9
Production of meat (@/ha period) 8.31 8.31 8.31 8.31
Average price of fattened steer (R$/@) 80.00 80.00 80.00 80.00
Gross income (R$/ha period) (0*1) 664.80 664.80 664.80 664.80
Gross income (R$/animal period) (2*(3.5/9)) 258.53 258.53 258.53 258.53
Gross income (R$ total) (2*(3.5)) 2326.79 2326.79 2326.79 2326.79
Total cost (R$/@) 79.60 75.96 72.33 68.99
Total cost (R$/ha period) (0*5) 661.45 631.25 601.03 573.32
The internal rate of return became more profitable as glycerin was added to the diet, increasing from 1.77% in the control treatment to 3.03% at the level of 9.99% of inclusion.
Discussion
The use of supplements in the production of cattle on pasture requires an effective analysis of the variables that can make the system inefficient, one of which is the price paid per arroba and the value of the elements of the supplements. Corn, considered the main energy component of the feed used for cattle, substantially increases the price of the feed for being amongst the most expensive elements. As the results of dry matter intake and daily weight gain were not altered with the inclusion of glycerin, it is an interesting alternative to reduce the cost of production, as its cost is 60 to 70% lower compared with corn.
The economic viability of supplementation of cattle on pasture was proven by several studies (Euclides et al., 2001; Tomich et al., 2002; Peres et al., 2005) that demonstrated better economic results in the treatments with supplementation of pasture compared with treatments without supplementation.
The values referring to the capacity rate, obtained in the present study, were only possible due to the use of supplements, producing more competitive results. This is in accordance with Figueiredo et al. (2007), who cite that low capacity rates reflect in systems with low body weight production, forcing producers to survive on the margin of the productive chain, with few conditions to offer products with competitive prices, almost always losing lands and
market to more efficient farmers and cattle ranchers with more profitable production systems or crops.
In addition to the high capacity rate observed, another positive factor obtained with the use of supplements is the reduction in the length of stay of the animals on the property, which will generate greater invested working capital, thus increasing the profitability of the system.
The practice of supplementation also aims at greater production per surface unit (kg/ha), since it increases production per animal, increasing the efficiency of use of fodder in its production peaks.
The standard response observed for the ADG was higher than those obtained by Ítavo et al. (2007), of 86.34 kg/ha and 5.76 @/ha, who finished calves on deferred pastures under the same capacity rate observed in the current study. The increase in total balance was expected, since crude glycerin was acquired at the price of R$ 0.20, which is much lower than the the increase of R$ 0.58spent per kg of corn. This proves the importance of studies that evaluate the use of alternative energy sources so as to cheapen production costs and consequently increase profitability.
When the net revenue is analyzed, taking into consideration all of the operating costs as well as the cost of application of capital invested to purchase the unfattened steer, an increase of net earnings of R$ 3.76 to R$ 91.89 per hectare is obtained with the inclusion of glycerin in the diet.
The standards observed for the OP and PI prove that glycerin was efficient in increasing the profitability of the system, because the two items adopt the value spent on feed for their calculations, which shows that glycerin is an economically viable alternative by reducing the cost with feeding.
Table 6 - Rates of return obtained with the activity considering all costs (capital invested and profits obtained with inclusion of glycerin in the diet)
Ingredient (g/kg) Inclusion of glycerin (g/kg DM)
0.0 33.3 66.6 99.9
Acquisition price of unfattened steer (R$/@) 75.00 75.00 75.00 75.00
Purchase of unfattened steer (R$/ha.year) 1938.49 1938.49 1938.49 1938.49
Operational cost of production (R$/ha period) 661.45 631.25 601.03 573.32
Invested capital (R$/ha period) (1+2) 2599.94 2569.74 2539.52 2511.81
Net revenue with the activity (R$/ha period) 3.34 33.55 63.76 91.47
Operating profit (R$/ha period) 74.31 104.52 134.73 162.44
Profitability index (%) 11.18 15.72 20.27 24.43
Table 7 - Monthly internal rate of return and net present value for the rates of return of 4, 8 and 12%, respectively, for one year
Ingredient (g/kg) Inclusion of glycerin (g/kg DM)
0.0 33.3 66.6 99.9
Internal rate of return (%) 1.77 2.19 2.62 3.03
Net present value of 4% (R$/ha) 107.16 137.37 167.58 195.29
Net present value of 8% (R$/ha) 81.71 111.92 142.13 169.84
The net present value (NPV) is considered an evaluation criterion of more rigorous projects and is free of technical errors (Noronha and Latapia, 1988), and corresponds to the algebraic sum of the cash flow values of a project, updated to the rate or rates of discount of the period in question. The results of the NPV obtained for each production system, calculated from the discount rates of 4, 8 and 12% per year (Table 7), which were used to uncapitalize the values to the zero date (total value invested), can also be considered the expectations of gain of the investor, serving as a reference to determine whether the project is viable.
The positive and higher values of NPV with the inclusion of glycerin should be the reduction of costs of feed, reducing the total cost of the system.
In the case of the current study, the inflows were uncapitalized to zero date, at the rates of 4, 8 and 12% per year. The positive values show that the treatments were capable of covering the initial investment, with the acquisition cost of the animals, and generated an additional for all of the rates used, thereby making the use of supplementation in the diet of pastured calves a viable strategy. However, observing the NPV values at the highest level of glycerin, for all rates, the figures were greater than those of the other treatments, thus showing that the use of glycerin was capable of increasing profitability in the finishing of the animals.
The internal rate of return (IRR) is the method used to analyze the economic viability of a project, functioning as a complementary analysis to the analysis of the NPV. It should point, as the NPV already showed, to the viability of the use of supplementation. According to the criteria of acceptance, the implementation of a project becomes more attractive as the result of the IRR in the project is increased.
The obtained rates were favorable to the adoption of any system, because they were greater than the payments received in investments available in the market, e.g. the savings account, whose remuneration was around 0.50% per month (6%/yr) in the same period.
The higher IRR obtained at the level of 9.99% of inclusion of glycerin demonstrates that despite showing similar total dry matter to the other treatments, it provided a lower cost with feeding, resulting in fewer expenses per area, which makes it more attractive when compared with the rates obtained in the other treatments.
Conclusions
The inclusion of crude glycerin in the supplementation of grazing calves is an economic strategy to increase the internal rate of return and net present value.
References
ANUALPEC 2010. Anuário da pecuária brasileira. FNP Consultoria e Comércio, São Paulo.
Campbell, A. G. 1996. Grazed pastures parameters: I. Pasture dry matter production and availability in a stocking rate and grazing management experiment with dairy cows. Journal of Agriculture Science 67:211-216.
Casali, A. O. 2006. Procedimentos metodológicos in situ na avaliação do teor de compostos indigestíveis em alimentos e fezes de bovinos. Dissertação (M.Sc.). Universidade Federal de Viçosa, Viçosa, MG, Brasil.
Euclides, V. P. B. 2001. Produção intensiva de carne bovina em pasto. p.55-82. In: Anais do 2o Simpósio de Produção de Gado de Corte.
UFV, Viçosa, MG, Brasil.
Figueiredo, D. M.; Oliveira, A. S.; Sales, M. F. L.; Paulino, M. F. and Vale, S. M. L. R. 2007. Análise econômica de quatro estratégias de suplementação para recria e engorda de bovinos em sistema pasto-suplemento. Revista Brasileira de Zootecnia 36:1443-1453. Frank, R. G. 1978. Introducción al calculo de costos agropecuarios.
El Ateneo, Buenos Aires.
Gonçalves, V. L. C. 2006. Biogasolina: produção de éteres e ésteres de glicina. p.14-19. In: Anais do 1o Congresso da Rede Brasileira
de Tecnologia do Biodiesel. Associação Brasileira das Instituições de Pesquisa Tecnológica, Brasília.
Hall, M. B. 2003. Challenges with non-fiber carbohydrate methods. Journal of Animal Science 81:3226-3232.
Ítavo, L. C. V.; Ítavo, C. C. B. F.; Dias, A. M.; Novais, M. F. S. M.; Silva, F. F.; Mateus, R. G. and Schio, A. R. 2007. Desempenho produtivo e avaliação econômica de novilhos suplementados no período seco em pastagens diferidas, sob duas taxas de lotação. Revista Brasileira de Saúde e Produção Animal 8:229-238. Martin, N. B.; Serra, R.; Oliveira, M. D. M.; Ângelo, J. A. and Okawa,
H. 1998. Sistema integrado de custos agropecuários – CUSTAGRI. Informações Econômicas 28:7-28.
McMeniman, N. P. 1997. Methods of estimating intake of grazing animals. p.131-168. In: Anais da 34a Reunião Anual da Sociedade
Brasileira de Zootecnia; Simpósio sobre Tópicos Especiais em Zootecnia. Sociedade Brasileira de Zootecnia, Juiz de Fora. Moraes, A.; Moojen, E. L. and Maraschin, G. E. 1990. Comparação
de métodos de taxas de crescimento em uma pastagem submetida a diferentes pressões de pastejo. p.332. In: Anais da 27a Reunião
Anual da Sociedade Brasileira de Zootecnia. Sociedade Brasileira de Zootecnia, Campinas.
Noronha, J. F. and Latapia, M. X. L. C. 1988. Custos de produção agrícola sob condições de risco no Estado de São Paulo. Revista de Economia e Sociologia Rural 26(3), art. 2.
NRC - National Research Council. 2000. Nutrient requirements of beef cattle. 7th ed. National Academy Press, Washington, DC. Paulino, M. F.; Detmann, E. and Valadares Filho, S. C. 2006.
Suplementação animal em pasto: energética ou protéica? p.359-392. In: Anais do 3o Simpósio sobre Manejo Estratégico da Pastagem.
SIMFOR, Viçosa, MG, Brasil.
Peres, A. A. C.; Vasquez, H. M.; Silva, J. F. C.; Souza, P. M.; Soares, C. S.; Barros, S. C. W.; Morenz, M. J. F. and Detmann, E. 2005. Avaliação produtiva e econômica de sistemas de produção bovina em pastagens de capim-elefante. Arquivo Brasileiro de Medicina Veterinária e Zootecnia 57:367-373.
Reis, R. A.; Rodrigues, L. R. A. and Pereira, J. R. A. 1997. Suplementação como estratégia de manejo de pastagem. p.123-150. In: Anais do 13o Simpósio sobre Manejo de Pastagem. FEALQ,
Piracicaba.
Silva, D. J. and Queiroz, A. C. 2002. Análise de alimentos: métodos químicos e biológicos.3.ed. UFV, Viçosa, MG, Brasil.
Silva, R. R.; Prado, I. N.; Carvalho, G. G. P.; Silva, F. F.; Almeida, V. V. S.; Santana Júnior, H. A.; Paixão, M. L. and Abreu Filho, G. 2010. Níveis de suplementação na terminação de novilhos Nelore em pastagens: aspectos econômicos. Revista Brasileira de Zootecnia 39:2091-2097.
Sniffen, C. J.; O’Connor, J. D.; Van Soest, P. J.; Fox, D. G. and Russell, J. B. 1992. A net carbohydrate and protein system for evaluating cattle diets. 2. Carbohydrate and protein availability. Journal of Animal Science70:3562-3577.
Tomich, T. R.; Lopes, H. O. S.; Pires, D. A. A.; Araújo, V. L. and Gonçalves, L. C. 2002. Suplementação com mistura múltipla contendo uréia como fonte de nitrogênio para bovinos em pastagens de braquiária no período das águas. In: Anais da 39a
Reunião Anual da Sociedade Brasileira de Zootecnia. Sociedade Brasileira de Zootecnia, Recife.
Valadares Filho, S. C.; Moraes, E. H. B. K.; Detmann, E.; Paulino, M. F.; Valadares, R. F. D.; Andreatta, K. and Marcondes, M. I. 2006. Perspectivas do uso de indicadores para estimar o consumo individual de bovinos alimentados em grupo. p.291-322. In: Anais dos Simpósios da 43a Reunião Anual da Sociedade Brasileira de
Zootecnia. Gonzaga Neto, S.; Costa, R. G.; Pimenta Filho, E. C. and Castro, J. M. C., eds. SBZ; UFPB, João Pessoa.
Weiss, W. P. 1999. Energy prediction equations for ruminant feeds. p.176-185. In: Proceedings of the 61st Cornell Nutrition Conference for Feed Manufacturers. Cornell University, Ithaca.