Population structure of Chinese southwest wheat germplasms resistant
to stripe rust and powdery mildew using the DArT-seq technique
População de germoplasmas resistentes de trigo empregando a técnica de sequenciamento Dart-seq
Tianqing Chen1, 2 Piyada Alisha Tantasawat1
Wei Wang2 Xu Gao2 Liyi Zhang2*
ISSNe 1678-4596
INTRODUCTION
Common wheat (Triticumaestivum L.) is a worldwide grown crop and has an important role in the world food security (IJAZ & KHAN, 2009). China is the largest country for wheat production. Wheat yield in China is being promoted by breeding and culture techniques but also confronts kinds of risks, such as diseases. Wheat stripe rust and powdery mildew are the major diseases in China, especially in the southwestern region, which cause huge yield loss (WAN et al., 2007; ZHANG et al., 2016). Wheat
breeding lines 92-R series and Guinong (GN) series, which are both derived from the cross of three species (common wheat, durum wheat and Haynaldia villosa), carry resistance to both stripe rust and powdery mildew and are wheat-Haynaldia villosa 6VS/6AL translocation (T6VS/6AL) lines (CHEN et al., 1995; LI et al., 2016). The disease resistance is mainly conferred by the stripe rust resistance gene Yr26 and powdery mildew resistance gene Pm21, which are located on 1BS and 6VS, respectively (MA et al., 2001; CHENG et al., 2006). After the 92-R series and GN series releasing, a lot of resistant wheat cultivars
1School of Crop Production Technology, Suranaree University of Technology, 111 University Avenue, Muang District, Nakhon Ratchasima 30000,
Thailand.
2Guizhou Institute of Upland Crops, Guizhou Academy of Agricultural Sciences, Guiyang 550006, China. E-mail: [email protected]. *Corresponding author.
ABSTRACT: Understanding genetic variability in existing wheat accessions is critical for collection, conservation and use of wheat
germplasms. In this study, 138 Chinese southwest wheat accessions were investigated by genotyping using two resistance gene makers (Pm21
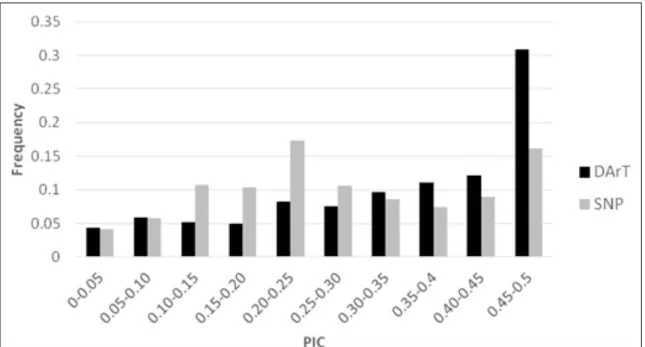
and Yr26) and DArT-seq technique. Finally, about 50% cultivars (lines) amplified the specific allele for the Yr26 gene (Gwm11) and 40.6% for the Pm21 gene (SCAR1265). By DArT-seq analysis, 30,485 markers (6486 SNPs and 23999 DArTs) were obtained with mean polymorphic information content (PIC) value 0.33 and 0.28 for DArT and SNP marker, respectively. The mean Dice genetic similarity coefficient (GS) was 0.72. Two consistent groups of wheat varieties were identified using principal coordinate analysis (PCoA) at the level of both the chromosome 6AS and the whole-genome, respectively. Group I was composed of non-6VS/6AL translocation lines of different origins, while Group II was composed of 6VS/6AL translocation (T6VS/6AL) lines, most of which carried the Yr26 and Pm21 genes and originated from Guizhou. Besides,
a model-based population structure analysis revealed extensive admixture and further divided these wheat accessions into six subgroups
(SG1, SG2, SG3, SG4, SG5 and SG6), based on their origin, pedigree or disease resistance. This information is useful for wheat breeding in
southwestern China and association mapping for disease resistance using these wheat germplasms in future.
Key words: Triticum aestivum L., Population structure, DArT-seq, 6VS/6AL translocation.
RESUMO: O conhecimento da estrutura da população é essencial para o mapeamento de associação de resistência a doenças para a
população de trigo. Neste estudo, a técnica de DART-seq™ foi usada para genotipar o genoma inteiro de cultivares de trigo. Finalmente, 30,485 marcadores (6486 SNPs e 23999 dardos) foram obtidos, e dois grupos de variedades de trigo foram identificados por meio de análise principal-coordenadas (PCoA) do nível de todo o genoma e o nível 6AS cromossomo. O grupo I foi composto por linhas não T6VS/6Al de diferentes origens, enquanto o Grupo II foi composto de linhas T6VS/6Al, sendo que da maioria destes realizados os genes Yr26 e PM21 originários de Guizhou.
Palavras-chave: germoplasma de trigo, estrutura populacional, genes de resistência, T6VS/6Al.
(lines) have been bred in southwestern China (LONG et al., 1998; HUANG et al., 2000). However, genetic relationship and resistance genes distribution are not clear for these germplasms.
Since the development of biotechnologies, molecular marker techniques, such as AFLP, SSR and SNP, have been widely used in the analysis of genetic diversity in common wheat (CHAO et al., 2010; PETROVIC et al., 2017). But all of them have various degrees of limitations (AKBARI et al., 2006). Diversity arrays technology (DArT) is a microarray hybridisation-based technique, which can detect thousands of loci in a single test without need of the sequence information (WENZL et al., 2004). Recently, a genotyping-by-sequencing (GBS) method combining DArT with next-generation sequencing (NGS), called DArT-seq, has been developed. The technique can detect both SNPs
and DArTs using cost-effective and efficient strategies
(RAMAN et al., 2014). Due to its rapid, high throughput and cost-effective characters, DArT-seq has been widely used for genetic diversity studies, linkage mapping,
QTL identification in biparental mapping population
and genome wide association studies (GWAS) in wheat (LI et al., 2015; BALOCH et al., 2017; KAUR et al., 2017) and many other crops over the previous four years (COURTOIS et al., 2013; SANTOS et al., 2016).
In the present study, a collection consisting mainly of wheat resources from southwestern China was genotyped from whole genomes using the DArT-seq technique, meanwhile, Yr26 and Pm21 gene loci
were also scanned using specific markers. The main
objective of this study was to: (i) assess the extent of the Southwestern China wheat genetic diversity; (ii) characterize the distribution of the Yr26 and Pm21 gene loci; (iii) identify impact of 6VS on population structure of southwestern China wheat.
MATERIALS AND METHODS
The 138 wheat (Triticum aestivum L.) cultivars (lines) in this study were mainly collected in winter wheat regions of southwestern China. Of these, 75 cultivars were collected from Guizhou province, 40 from Sichuan province. Besides, 23 cultivars were collected from other regions of China (Jiangsu, Hubei, Henan, Shanxi, Shaanxi, Beijing and
Gansu) (Additional file 1).
Genomic DNA was extracted from young leaf tissue of each genotype using the protocol recommended by Diversity Arrays Technology Pty Ltd. (DArT P/L) (JAMES, 2005). Two markers were used to scan for resistance gene loci in this study, including the SCAR marker (SCAR1265) for Pm21
and the SSR marker (Gwm11) closely linked to the
Yr26. The PCR reactions were performed according to the optimised conditions for Pm21 (LIU et al., 1999) and Yr26 (MA et al., 2001). Genotyping of the whole genome was conducted at DArT P/L (Canberra, Australia). The DArT-seq technology used the PstI/
TaqI restriction enzymes for genome reduction and then DNA fragments were ligated with PstI specific
adaptor. The adaptor was tagged with specific barcode
sequences for each sample. Products of each sample
were amplified for checking the quality and then
pooled together. The instrument of Illumina Hiseq2000 was used for sequencing amplicons. After sequencing,
the resulting sequences were filtered and target datasets
were formed. At last, an analytical pipeline devised by DArT P/L was applied to yield scores of makers (DArTs and SNPs) (ZOU et al., 2014).
For each marker, the polymorphic information content (PIC) value was computed following the methods described by Zhang et al
(2011). The Dice genetic similarity coefficient (GS)
between pair of cultivars is computed according to the formula of Dice (1945). Principal coordinate analysis (PCoA) was performed in the programme of NTSYS-pc (version 2.21) using a Dice GS matrix. A model-based clustering approach (Bayesian clustering) was also performed to estimate the population structure of the 138 accessions using Structure V2.3.3 software (PRITCHARD et al., 2000). Admixture and independent allele frequencies model was used in estimating the proper subgroups. The number of subgroups (K) was set from 1 to10 with 5 runs performed separately. For each run, 5,000 iterations were carried out after a burn-in period of 5,000
iterations. ΔK was calculated according to Pritchard
et al. (2000) to estimate the best subgroup number (K). Accessions were assigned to a subgroup if the probability of membership was greater than 70% (TYAGI et al., 2014). If membership was <70%, then the accessions were assigned to the mixed subgroup.
RESULTS AND DISCUSSION
of 0.20 to 0.25. For DArT markers, the distribution of PIC values was asymmetrical and skewed towards the higher values and most (32%) had a PIC value in the range of 0.45 to 0.50 (Figure 1). PIC value provides an estimate of the discriminating power of a marker. A PIC value higher than 0.5 is considered to be a sign of a very informative marker, while 0.5> PIC> 0.25 corresponded to an informative marker (BOTSTEIN et al., 1980). In the present study, the mean PIC value for both types marker was higher than 0.25, comparable to those observed in the study with same type marker (LOPES et al., 2015; SOHAIL et al., 2015), but lower than SSR marker (RAFEIPOUR et al., 2016; HONORE et al., 2017). PIC value is calculated as a maximum of 0.5 when a marker is scored as 50% of 0 and 50% of 1. Therefore, DArT and SNP are less informative than SSR, which has more alleles for a given locus. In the study, DArTs revealed a greater number of polymorphisms than SNPs. However, BALOCH et al. (2017) reported a mean PIC values 0.265 and 0.302 for DArT and SNP markers and the distribution of PIC values was asymmetrical in both markers systems with durum wheat. It may be due to that variation (SNPs and INDELs) at restriction enzyme cleavage sites and restriction fragments are more diverse in our common wheat accessions.
The Dice GS was calculated using the genotyping data of 30,485 informative markers for all possible pairs of accessions. It ranged from 0.60 to 0.99, with a mean value of 0.72. The Dice
GS value was higher than the two studies reported earlier (PRASAD et al., 2000; NI et al., 2012). It may suggest that the 138 genotypes used in this study were moderately diverse. The genetic diversity loss in our collection is probably because the study mainly focused on wheat resistant germplasms from two adjacent provinces in southwestern China, which share a similar ecology and some core wheat parents.
Gene loci scanning showed that about 50%
cultivars (lines) amplified the specific allele (193bp) for
the Yr26 gene (Gwm11) and 40.6% for the specific allele
(1265bp) for the Pm21 gene (SCAR1265) (Additional
file 2). Similar results were reported in other studies
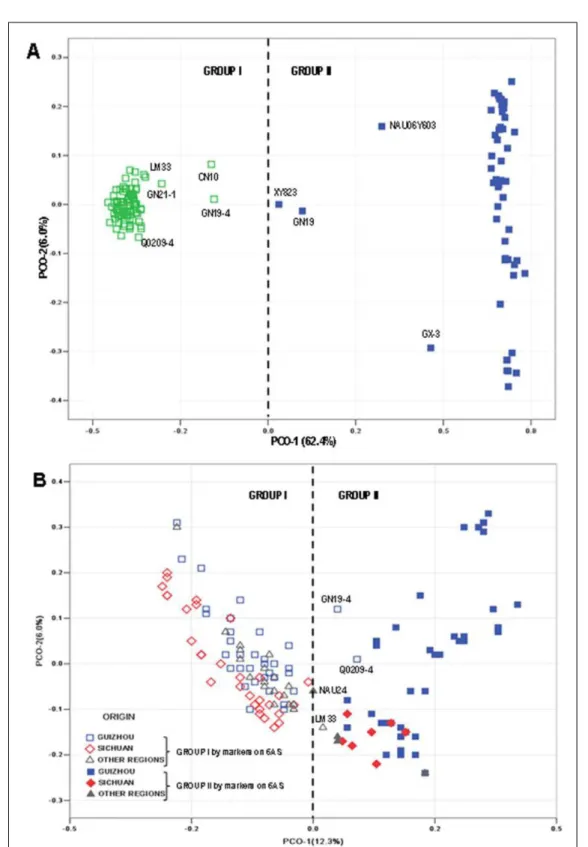
(WAN et al., 2011; JIANG et al., 2014). Considering that Pm21 is derived from the T6VS/6AL lines (CAO et al., 2010; ZHAN et al., 2010), PCoA was performed based on genotype data of the 769 markers (SNP and DArT) on chromosome 6AS. A very clear separation was observed with the origin of the PCO-1 axis as a dividing line (Figure 2A). The PCO-1 and PCO-2 accounted for 62.4% and 6.0% of the total variation,
respectively. A significant correlation (r=0.8, P<0.01)
was observed between cultivars in Group II (Figure 2A) and those carrying the Pm21 gene. Combining results of both the PCoA and correlation analysis, we deduced that Group I was the 6AS/6AL group and Group II was the T6VS/6AL group (Figure 2A).
The PCoA was also performed based on whole genome genotype data. A two-dimensional scatter plot (Figure 2B) shows that PCO-1 and
PCO-2 accounted for 12.3% and 6.0% of the total variation, respectively. Two clear groups were also
distinguished based on the origin of the PCO-1 axis. The PCoA pattern was highly consistent with
the results obtained using genotype data of the 769 markers on chromosome 6AS. Three exceptions (GN19-4, Q0209-4 and LM33) were found by
comparing the two figures (Figure 2A and Figure 2B).
The Group I was highly clustered by 92 cultivars with no obvious separation of cultivars (lines) according to geographic regions. However, the Group II was spread widely along both the PCO-1 and PCO-2 axis. Forty-eight cultivars were in this group, mainly from Guizhou province. The genetic diversity of wheat was not completely related to geographic distribution. Similar results were obtained by SALEM et al. (2014). Formation of the two groups (6AS/6AL and T6VS/6AL) might be induced by differential selection (CROSSA et al., 2007). Cultivars in Group II were mainly from Guizhou, where the selection pressure for powdery mildew resistance was more considerable than Sichuan, so 6VS segment was saved by selection in breeding process. Similarly, it was also reported that two groups were formed based on Rht8 locus and it neighbour markers on chromosome 2D for European wheat (NIELSEN et al., 2014) or 1RS/1BL translocation for northern Chinese wheat (ZHANG et al., 2011). In the study, several lines were scattered between the two groups and it is possible that these lines carry 6VS segments of different sizes, because there was a low frequency of pairing and recombination between chromosome 6VS from Haynaldia villosa and 6AS from cultivated wheat species (CAO et al., 2011).
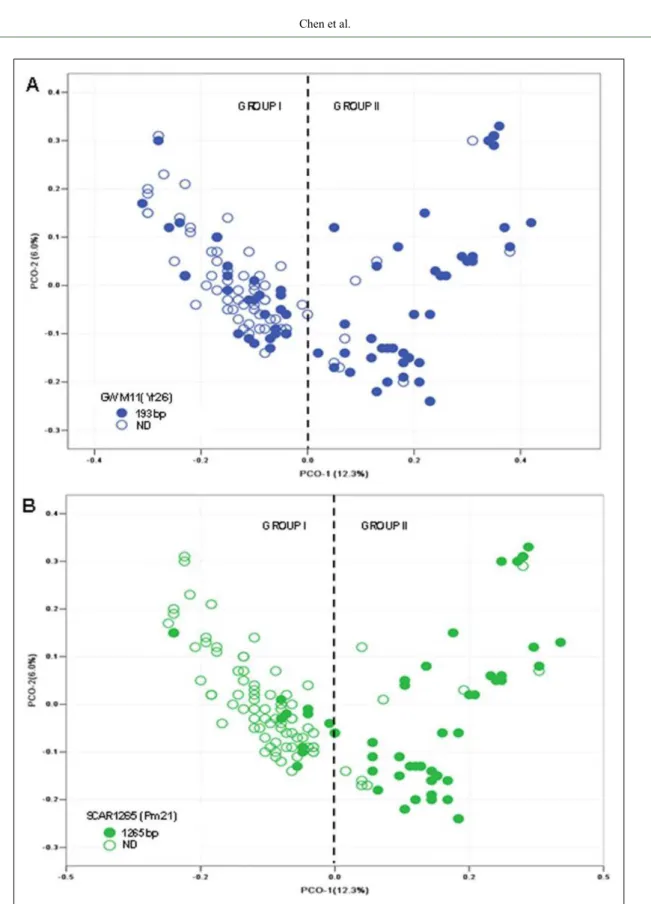
The PCoA results shown in figure 3A and 3B
were based on the presence of the Yr26 and Pm21 gene
loci, respectively. As shown in figure 3A, the distribution
of the cultivars carrying Yr26 loci was uneven, with more in Group II than in Group I. Almost all Pm21-carrying cultivars were in Group II, while very few Pm21-carrying cultivars did in Group I (Figure 3B). Cultivars in the Group II were mainly from Guizhou province and with
better resistance, which was proved in the field evaluation
(LI et al., 2014; CHEN et al., 2016).
Furthermore, population structure was investigated using the Structure software. Delta K
(ΔK) values peaked at K = 6, thus these accessions
could be divided into 6 subgroups (Figure 4a and 4b). Accessions with the membership value of <70% to any cluster were considered as mixed. The remaining was assigned to the 6 subgroups, with 15(SG1), 19 (SG2), 9 (SG3), 12 (SG4), 3 (SG5) and 11 (SG6) accessions respectively. Besides, 69 accessions were assigned as mixed. Group I of PCoA was further roughly divided into SG1, SG2, SG3 and SG5, while
Group II divided into SG4 and SG6 (Additional file
3). Similarly, KHAN et al. (2015) reported that Indian
and Turkish wheat were divided into 2 major group
by first or second principal coordinate according
to ploidy level or geographical origin. But using a Bayesian model-based structure analysis, 3 subgroups were divided. In our study, the results between structure analysis and PCoA were inconsistent. The possible reason was that the PCoA had weak ability to discover the tiny population structure, because it only
considered the first principal coordinate as a group
differentiation criterion, which could explain 12.3% genetic variation for the whole genome level.
In the SG1, MY26 is a well-known cultivar, which was released in 1995 in Sichuan and then rapidly spread to Guizhou, Yunnan, Shaanxi and Hubei province, and led to the sixth wheat variety rotation of Sichuan (YU, 2003). MY26 and other 8 cultivars were directly or indirectly bred by line Fan 6, which were
classified as Fan 6 series or MY series (WAN et al.,
2004). In this study, 13 among the 15 accessions in SG1 were from Sichuan, and most of them had pedigree relationship with MY series. Among the 19 accessions in SG2, 15 were from Guizhou, including QM series, FY series and JYP series. Most of them were grown more than 10 years and lost their resistance to stripe rust and powdery mildew in Guizhou (HUANG et al., 2014; LI et al., 2014). This was also proved by the scanning of Yr26 and Pm21 gene markers in our study. In the SG3, all of 9 accessions had the relationship with GN series, though derived from different regions (6 from Sichuan, 2 from Guizhou and 1 from Gansu). Interestingly, 6VS or Pm21 were not detected in these accessions. The 6VS segment may be lost in breeding and separation process during a long period. In the SG4, all of 12 accessions were from Guizhou and bred through distant crosses, including GX series, P series and YG series, most of them carried both of the Pm21
and Yr26 gene loci and showed disease resistance
in field (HUANG et al., 2014; LI et al., 2014). The
pedigree carrying wild species made these cultivars heterogeneous compared to those in other subgroups and shown a far distance to other subgroups in scatter
plot (Additional file 3). In the SG5, only 3 cultivars with
GN series pedigree were involved, and derived from Sichuan, Henan and Hubei, respectively. Neither Yr26
nor pm21 gene loci were carried by the 3 cultivars. In the SG6, all of 11 accessions were from Guizhou and most of them were QM series with the kinship of GN series. Besides, all of cultivars in SG6 were 6VS/6AL translocation lines and carried both Yr26 and pm21
of the wheat accessions (69) were assigned to mixed
group indicating significant admixture. The similar result was also reported by TYAGI et al. (2014) and MACCAFERRI et al. (2015). This admixture was
possibly a result of germplasm sharing among different breeding programs or frequent appearance of a few lines with favourable agronomic traits in multiple breeding programs (TYAGI et al., 2014). This is also proved by our study that many wheat resources from Sichuan and Guizhou shared common parents (GN series) in their pedigree. Structure analysis could provide the detailed population structure of the wheat accessions and help us to utilize them reasonably.
CONCLUSION
DArT-seq, based on GBS methods, is an effective means of developing qualitative DArT and SNP markers. By this technique, intermediate genetic diversity was observed in the tested 138 wheat accessions with the mean Dice GS evaluation. Using PCoA, two groups (6AS/6AL and T6VS/6AL) were recognised at the level of the whole genome and the 6AS chromosome. Cultivars in T6VS/6AL group had better resistance to stripe rust and powdery mildew, mainly due to the presence of Yr26 and Pm21 loci. Model based structure analysis further divided germplasms into 6 subgroups, and revealed more details in the population structure. Results of this study provided information for future breeding programs and may be useful for conservation of wheat genetic resources and association mapping.
ACKNOWLEDGEMENTS
The authors are grateful to Dr. Hugo Alfried Volkaert, Center for Agricultural Biotechnology, Kasetsart University, Thailand, for critical review of this manuscript. This study was
financially supported by the National Natural Science Foundation
of China (31660393), the Science and Technology Project of Guizhou Province (QKHJC20161147).
CONFLICT OF INTEREST
The authors have declared that no competing interests exist.
REFERENCES
AKBARI, M., et al. Diversity arrays technology (DArT) for
high-throughput profiling of the hexaploid wheat genome. Theoretical and
Applied Genetics, v.113, n.8, p.1409-1420, 2006. Available from:
<https://link.springer.com/article/10.1007%2Fs00122-006-0365-4>. Accessed: Feb. 26, 2018. doi: 10.1007/s00122-006-0365-4.
BALOCH, F. S., et al. A whole genome DArTseq and SNP analysis for genetic diversity assessment in durum wheat from Central Fertile Cres-cent. Plos One, v.12, n.1, p.e0167821, 2017. Available from: <http://
journals.plos.org/plosone/article?id=10.1371/journal.pone.0167821>.
Accessed: Feb. 26, 2018. doi: 10.1371/journal.pone.0167821.
BOTSTEIN, D., et al. Construction of a genetic linkage map in man using restriction fragment length polymorphisms. American Journal of
Hu-man Genetics, v.32, n.3, p.314, 1980. Available from: <https://www.ncbi.
nlm.nih.gov/pmc/articles/PMC1686077/>. Accessed: Feb. 27, 2018.
CAO, A., et al. Serine/threonine kinase gene Stpk-V, a key member of powdery mildew resistance gene Pm21, confers powdery mildew Figure 4 - Model based subdivision of population structure. Plot (a) showed the estimation of the number
resistance in wheat. Proceedings of the National Academy of
Sci-ences, v.108, n.19, p.7727-7732, 2011. Available from: <http://www.
pnas.org/cgi/pmidlookup?view=long&pmid=21508323>. Accessed:
Feb. 27, 2018. doi: 10.1073/pnas.1016981108.
CAO, S., et al. Postulation of powder mildew resistance genes in 64 wheat varieties (lines) in Gansu province, China. Acta
Agronomi-ca SiniAgronomi-ca, v.36, n.12, p.2107-2115, 2010. Available from: <http://
pub.chinasciencejournal.com/ActaAgronomicaSinica/14373.jht-ml>. Accessed: Feb. 27, 2018. doi: 10.3724/SP.J.1006.2010.02107.
CHAO, S., et al. Population and genome-specific patterns of linkage dis -equilibrium and SNP variation in spring and winter wheat (Triticum aesti-vum L.). BMC Genomics, v.11, n.1, p.727, 2010. Available from: <https:// bmcgenomics.biomedcentral.com/articles/10.1186/1471-2164-11-727>. Accessed: Feb. 27, 2018. doi: 10.1186/1471-2164-11-727.
CHEN, P. D., et al. Development and molecular cytogenetic analysis of
wheat-Haynaldia villosa 6VS/6AL translocation lines specifying resistance to pow-dery mildew. Theoretical and Applied Genetics, v.91, n.6-7, p.1125, 1995. Available from: <https://link.springer.com/article/10.1007%2FBF00223930>. Accessed: Feb. 27, 2018. doi: 10.1007/BF00223930.
CHEN, T., et al. Diversity of stripe rust resistance genes in wheat cul-tivars from southwestern China. Journal of Plant Protection, v.43, n.2, p.184-192, 2016. Available from: <http://www.cnki.net/kcms/ doi/10.13802/j.cnki.zwbhxb.2016.02.002.html>. Accessed: Feb. 27, 2018. doi: 10.13802/j.cnki.zwbhxb.2016.02.002.
CHENG, Y., et al. Microsatellite markers for a yellow rust resistant gene in wheat cultivar Guinong 21. Acta Agronomica Sinica, v.32, n.12, p.1867-1872, 2006. Available from: <http://www.wanfangdata.
com.cn/details/detail.do?_type=perio&id=zuowxb200612015>. Ac -cessed: Feb. 27, 2018. doi: 10.3321/j.issn:0496-3490.2006.12.015.
COURTOIS, B., et al. Genome-wide association mapping of root traits in a japonica rice panel. Plos One, v.8, n.11, p.e78037, 2013.
Available from: <http://journals.plos.org/plosone/article?id=10.1371/
journal.pone.0078037>. Accessed: Feb. 27, 2018. doi: 10.1371/jour-nal.pone.0078037.
CROSSA, J., et al. Association analysis of historical bread wheat germplasm using additive genetic covariance of relatives and popu-lation structure. Genetics, v.177, n.3, p.1889-1913, 2007. Available
from: <http://www.genetics.org/user/logout?current=node/334211>.
Accessed: Feb. 27, 2018. doi: 10.1534/genetics.107.078659.
DICE, L. R. Measures of the amount of ecologic association between species. Ecology, v.26, n.3, p.297-302, 1945. Available from: <http:// onlinelibrary.wiley.com/doi/10.2307/1932409/full>. Accessed: Feb. 27, 2018. doi: 10.2307/1932409.
HONORE, T., et al. Genetic diversity of Cameroonian bread wheat ( Triti-cum aestivum L.) cultivars revealed by microsatellite markers. African
Journal of Biotechnology, v.16, n.36, p.1832-1839, 2017. Available
from: <http://www.academicjournals.org/journal/AJB/article-full-text/ D0304ED65883>. Accessed: Feb. 27, 2018. doi: 10.5897/AJB2017.16090.
HUANG, F., et al. Identification of the resistance to wheat stripe rust
of Guizhou major wheat cultivars (lines). Guizhou Agricultural
Sci-ences, v.42, n.2, p.82-84, 2014. Available from:
<http://www.wanfang-data.com.cn/details/detail.do?_type=perio&id=gznykx201402021>.
Accessed: Feb. 27, 2018. doi: 10.3969/j.issn.1001-3601.2014.02.021.
HUANG, G. Y., et al. Evaluation and utilization of a new stripe rust-resistant wheat germplasm 92R149. Acta Tritical Crops, v.20, n.1,
p.91-93, 2000. Available from:
<http://www.wanfangdata.com.cn/de-tails/detail.do?_type=perio&id=mlzwxb200001021>. Accessed: Feb.
27, 2018. doi: 10.3969/j.issn.1009-1041.2000.01.021.
IJAZ, S., & Khan, I. A. Molecular characterization of wheat germ-plasm using microsatellite markers. Genetics and Molecular
Re-search, v.8, n.3, p.809-815, 2009. Available from:
<http://www.fun-pecrp.com.br/gmr/year2009/vol8-3/pdf/gmr608.pdf>. Accessed: Feb. 27, 2018. doi: 10.4238/vol8-3gmr608.
JAMES, K. (2005). Extracting DNA from plants for DArT. Avail-able from: <http://www.triticarte.com.au>. Accessed: Nov. 12, 2014.
JIANG, Z., et al. Distribution of powdery mildew resistance gene
Pm21 in Chinese winter wheat cultivars and breeding lines based
on gene-specific marker. Scientia Agricultura Sincia, v.47, n.11, p.2078-2087, 2014. Available from: <http://www.chinaagrisci.com/ CN/abstract/abstract18173.shtml>. Accessed: Feb. 27, 2018. doi: 10.3864/j.issn.0578-1752.2014.11.002.
KAUR, S., et al. Genome-wide association study reveals novel genes associated with culm cellulose content in bread wheat ( Triti-cum aestivum, L.). Frontiers in Plant Science, v.8, 2017. Available from: <https://www.ncbi.nlm.nih.gov/pmc/articles/PMC5681534/>. Accessed: Feb. 27, 2018. doi: 10.3389/fpls.2017.01913.
KHAN, M. K., et al. Genetic diversity and population structure of wheat in India and Turkey. AoB PLANTS, v.7, 2015. Available from: <https://www.ncbi.nlm.nih.gov/pmc/articles/PMC4565425/>. Accessed: Feb. 27, 2018. doi: 10.1093/aobpla/plv083.
LI, H., et al. A high density GBS map of bread wheat and its applica-tion for dissecting complex disease resistance traits. BMC Genom-ics, v.16, n.1, p.216, 2015. Available from: <https://bmcgenomics. biomedcentral.com/articles/10.1186/s12864-015-1424-5>. Accessed: Feb. 27, 2018. doi: 10.1186/s12864-015-1424-5.
LI, Q., et al. Genetic analysis and molecular mpping of a stripe rust resis-tance gene in Chinese wheat differential Guinong 22. Journal of
Phy-topathology, v.164, n.7-8, p.476-484, 2016. Available from: <http://
onlinelibrary.wiley.com/doi/10.1111/jph.12473/full>. Accessed: Feb. 27, 2018. doi: 10.1111/jph.12473.
LI, W., et al. Evaluation of powdery mildew resistance of wheat cul-tivars. Guizhou Agricultural Sciences, v.42, n.2, p.106-109, 2014. Available from: <http://www.wanfangdata.com.cn/details/detail.do?_
type=perio&id=gznykx201402028>. Accessed: Feb. 27, 2018. doi:
10.3969/j.issn.1001-3601.2014.02.028.
LIU, Z., et al. Development of SCAR markers linked to the Pm21 gene conferring resistance to powdery mildew in common wheat. Plant
Breeding, v.118, p.215-219, 1999. Available from:
<http://onlineli-brary.wiley.com/doi/10.1046/j.1439-0523.1999.118003215.x/full>. Accessed: Feb. 27, 2018. doi: 10.1046/j.1439-0523.1999.118003215.x.
LONG, Z., et al. Application of Guinong 21,a wheat powdery mildew resistant resource for wheat breeding. Guizhou Agricultural
Sci-ences, v.26, n.1, p.17-20, 1998. Available from: <http://www.cqvip.
com/QK/94134X/199801/2897204.html>. Accessed: Feb. 28, 2018.
MA, J., et al. Molecular mapping and detection of the yellow rust resistance gene Yr26 in wheat transferred from Triticum turgidum
L. using microsatellite markers. Euphytica, v.120, n.2, p.219-226, 2001. Available from: <https://link.springer.com/article/10.1023 /A:1017510331721>. Accessed: Feb. 28, 2018.
MACCAFERRI, M., et al. A genome-wide association study of resistance to stripe rust (Puccinia striiformis f. sp. tritici) in a worldwide collection of hexaploid spring wheat (Triticum aestivum
L.). G3, v.5, n.3, p.449-465, 2015. Available from: <http://www.
g3journal.org/cgi/pmidlookup?view=long&pmid=25609748>.
Accessed: Feb. 28, 2018. doi: 10.1534/g3.114.014563.
NI, S., et al. Analysis of genetic diversity of some introduced and domes-tic winter wheat cultivars. Acta Agriculturae Boreali-occidentalis Si-nica, v.21, n.2, p.20-25, 2012. Available from:
<http://www.wanfang-data.com.cn/details/detail.do?_type=perio&id=xbnyxb201202005>.
Accessed: Feb. 28, 2018. doi: 10.3969/j.issn.1004-1389.2012.02.005.
NIELSEN, N. H., et al. Genetic diversity and population structure analysis of european hexaploid bread wheat (Triticum aestivum L.) varieties. Plos One, v.9, n.4, p.e94000, 2014. Available from: <http://
journals.plos.org/plosone/article?id=10.1371/journal.pone.0094000>.
Accessed: Feb. 28, 2018. doi: 10.1371/journal.pone.0094000.
PETROVIC, S., et al. Assessment of molecular and phenotypic di-versity among winter wheat cultivars. Genetika-Belgrade, v.49, n.2, p.583-598, 2017. Available from: <http://www.dgsgenetika.org.rs/ abstrakti/vol49no2rad17.pdf>. Accessed: Feb. 28, 2018. doi: 10.2298/ GENSR1702583P.
PRASAD, M., et al. The use of microsatellites for detecting DNA
poly-morphism, genotype identification and genetic diversity in wheat.
Theo-retical and Applied Genetics, v.100, n.3-4, p.584-592, 2000. Available
from: <https://link.springer.com/article/10.1007%2Fs001220050077>. Accessed: Feb. 28, 2018. doi: 10.1007/s001220050077.
PRITCHARD, J. K., et al. Inference of population structure using multilocus genotype data. Genetics, v.155, n.2, p.945-959, 2000. Available from: <http://www.genetics.org/content/155/2/945.long>. Accessed: Feb. 28, 2018.
RAFEIPOUR, M., et al. SSR assessment of the genetic diversity of emmer wheat with emphasis on Iranian landraces ( Triticum dicoccon Schrank).
Genetic Resources and Crop Evolution, v.63, n.4, p.595-600, 2016.
Available from: <https://link.springer.com/article/10.1007%2Fs10722-016-0379-y>. Accessed: Feb. 28, 2018. doi: 10.1007/s10722-016-0379-y.
RAMAN, H., et al. Genome-wide delineation of natural varia-tion for pod shatter resistance in Brassica napus. Plos One, v.9, n.7, p.e101673, 2014. Available from: <http://journals.plos.org/plosone/
article?id=10.1371/journal.pone.0101673>. Accessed: Feb. 28, 2018.
doi: 10.1371/journal.pone.0101673.
SALEM, K. F. M., et al. Assessing genetic diversity of Egyptian hexa-ploid wheat ( Triticum aestivum L.) using microsatellite markers. Genetic
Resources and Crop Evolution, v.62, n.3, p.1-9, 2014. Available from:
<https://link.springer.com/article/10.1007%2Fs10722-014-0159-5>. Accessed: Feb. 28, 2018. doi: 10.1007/s10722-014-0159-5.
SANTOS, J. P. R. D., et al. Genomic selection to resistance to Steno-carpella maydis in maize lines using DArTseq markers. BMC Genet-ics, v.17, n.1, p.86, 2016. Available from: <https://bmcgenet.biomed-central.com/articles/10.1186/s12863-016-0392-3>. Accessed: Feb. 28, 2018. doi: 10.1186/s12863-016-0392-3.
SOHAIL, Q., et al. Genetic diversity analysis of Afghan wheat land-races ( Triticum aestivum ) using DArT markers. Genetic Resources
and Crop Evolution, v.62, n.8, p.1147-1157, 2015. Available from:
<https://link.springer.com/article/10.1007/s10722-015-0219-5>. Accessed: Feb. 28, 2018. doi: 10.1007/s10722-015-0219-5.
TYAGI, P., et al. Genetic diversity and population structure in the US Upland cotton (Gossypium hirsutum L.). Theoretical and Applied
Genetics, v.127, n.2, p.283-295, 2014. Available from: <https://link.
springer.com/article/10.1007%2Fs00122-013-2217-3>. Accessed: Mar. 1, 2018. doi: 10.1007/s00122-013-2217-3.
WAN, A., et al. Wheat stripe rust epidemic and virulence of Puccinia striiformis f. sp. tritici in China in 2002. Plant Disease, v.88, n.8, p.896-904, 2004. Available from:
<https://pubag.nal.usda.gov/pubag/down-loadPDF.xhtml?id=8474&content=PDF&_ad0.1635468965396285>.
Accessed: Mar. 1, 2018. doi: 10.1094/PDIS.2004.88.8.896.
WAN, A. M., et al. Wheat stripe rust in China. Australian Journal of
Ag-ricultural Research, v.58, n.6, p.605-619, 2007. Available from: <http://
citeseerx.ist.psu.edu/viewdoc/download?doi=10.1.1.1030.2433&rep=rep 1&type=pdf>. Accessed: Mar. 1, 2018. doi: 10.1071/AR06142.
WAN, J., et al. Molecular detection of stripe rust resistant genes in 108 wheat germplasms. Guizhou Agricultural Sciences, v.39, n.5, p.22-26, 2011. Available from: <http://www.wanfangdata.com.cn/
details/detail.do?_type=perio&id=gznykx201105007>. Accessed:
Mar. 1, 2018. doi: 10.3969/j.issn.1001-3601.2011.05.007.
WENZL, P., et al. Diversity Arrays Technology (DArT) for
whole-genome profiling of barley. Proceedings of the National Academy
of Sciences of the United States of America, v.101, n.26,
p.9915-9920, 2004. Available from: <http://www.pnas.org/cgi/pmidlookup?v
iew=long&pmid=15192146>. Accessed: Mar. 1, 2018. doi: 10.1073/
pnas.0401076101.
YU, A. Studies on stability of wheat variety of Mianyang 26. Journal of
Sichuan Agricultural University, v.21, n.3, p.205-207, 2003. Available
from: <http://www.cqvip.com/QK/91109X/200303/8324598.html>. Ac-cessed: Mar. 1, 2018. doi: 10.3969/j.issn.1000-2650.2003.03.005.
ZHAN, H., et al. Sources and evaluation of powdery mildew resis-tance genes in wheat. Chinese Agricultural Science Bulletin, v.26, n.10, p.42-46, 2010. Available from: <http://www.wanfangdata.com.
cn/details/detail.do?_type=perio&id=zgnxtb201010010>. Accessed:
Mar. 1, 2018.
ZHANG, L., et al. Climatic risk assessment of wheat powdery mildew in China. Chinese Journal of Ecology, v.35, n.5, p.1330-1337, 2016. Avail-able from: <http://www.cqvip.com/QK/90811X/201605/668836628. html>. Accessed: Mar. 1, 2018. doi: 10.13292/j.1000-4890.201605.003.
ZHANG, L., et al. Investigation of genetic diversity and popu-lation structure of common wheat cultivars in northern China using DArT markers. BMC Genetics, v.12, n.1, p.42, 2011. Available from: <https://bmcgenet.biomedcentral.com/arti-cles/10.1186/1471-2156-12-42>. Accessed: Mar. 1, 2018. doi: 10.1186/1471-2156-12-42.
ZOU, J., et al. Constructing a dense genetic linkage map and
mapping QTL for the traits of flower development in Brassica