RESPONSE FUNCTION FOR THE S
RELATIVEINDEX
IN CAMBISOL TREATED
WITH AND WITHOUT BOVINE LIQUID BIOFERTILIZER
1THIAGO LEITE DE ALENCAR2*, LUIS FELIPE RODRIGUES DE AQUINO SOUSA2, ARILENE FRANKLIN
CHAVES2, JAEDSON CLÁUDIO ANUNCIATO MOTA2
ABSTRACT – The present study aimed at assessing the influence of physical properties associated with soil structure on the Srelative index. Two soil conditions under Ficus carica L. cultivation were studied (with or
without liquid bovine biofertilizer in the irrigation water), in the 0-0.1 m and 0-0.3 m layers. Disturbed and
undisturbed soil samples were collected from the above-mentioned layers and physical analyzes, pertinent to
the study objective, were performed. The response function model was applied to verify how the soil independent physical variables influence on the Srelative index in the 0-0.1 m and 0-0.3 m layers, with 0 and 60%
biofertilizer, being combined two to two. Once the response functions were known, the slopes of both functions were compared, being represented by the coefficients β11-β12 and β21-β22. This comparison enabled verifying whether there was an effect of the treatments on the response variable. In addition, the standard error of the difference between coefficients was calculated, and the Student's t-test applied. The method of multiple
regression was also used to confirm the effect of the variables on the Srelative index for the 0-0.3 m layer in both
treatments. Then, the variables with greater weight were selected by a backward elimination method to estimate the Srelative. The results showed that the Srelative index is strongly influenced by properties of the porous fraction,
with total porosity and continuity of pores being of significant influence. Management with liquid bovine biofertilizer results in improvement in the soil structure, with effects measured by the Srelative index.
Keywords: S index. Soil structure. Organic matter.
FUNÇÃO DE RESPOSTA PARA O ÍNDICE SRELATIVO EM CAMBISSOLO TRATADO COM E SEM BIOFERTILIZANTE LÍQUIDO BOVINO
RESUMO- Objetivou-se com esta pesquisa estudar a influência de atributos físicos associados à estrutura do
solo no índice Srelativo. Foram contempladas duas situações de solo (sob cultivo de Ficus carica L., sem aplicação e com aplicação de biofertilizante bovino líquido na lâmina de irrigação), nas camadas de 0-0,1 m e 0 -0,3 m. Foram coletadas amostras de solo com estrutura preservada e não preservada nas camadas supracitadas
e realizadas análises físicas pertinentes ao objetivo do estudo. Foi aplicado o modelo de função de resposta para verificar como as variáveis físicas do solo independentes influenciam no Srelativo, nas camadas de 0-0,1 m e 0 -0,3 m tratadas com 0 e 60 % do biofertilizante combinadas duas a duas. Conhecidas as funções de resposta
compararam-se as inclinações de ambas as funções, representadas pelos coeficientes β11-β12 e β21-β22, para
verificar se houve efeito dos tratamentos na variável resposta. Além disso, calculou-se o erro padrão da
diferença entre os coeficientes e aplicou-se o teste t de Student. Também foi aplicado o método de regressão
múltipla para verificar o efeito das variáveis sobre o Srelativo para a camada de 0-0,3 m em ambos os tratamentos.
Em seguida, por meio do método backward elimination foram selecionadas as variáveis com maior peso para a estimativa do Srelativo. Concluiu-se que o índice Srelativo é fortemente influenciado por atributos da fração porosa,
sendo a porosidade total e a continuidade de poros os de influência significativa. O manejo com biofertilizante bovino líquido resulta em melhora na estrutura do solo, com efeitos mensuráveis pelo índice Srelativo.
Palavras-chave: Índice S. Estrutura do solo. Matéria orgânica.
____________________ *Corresponding author
1Received for publication in 09/29/2016; accepted in 05/17/2017. Extracted from the dissertation of the first author.
INTRODUCTION
Soil physical quality is designated as its ability to meet the demands of plants and ecosystems for water flows, gas and heat, as well as its capacity to resist and recover from a process by which such ability could be reduced (MCKENZIE; TISDALL; VANCE, 2014).
In degraded soils, the addition of organic material such as liquid bovine biofertilizer (organic waste from biodigestion) has been an anthropic action to improve the functional performance of agricultural systems. Such use has improved the soil quality in addition to providing nutrients, acting as a cementing agent between soil particles and improving some soil properties related to the its structure, especially density and resistance to penetration (ALENCAR et al., 2015; KITAMURA et al., 2008; RAUBER et al., 2012).
Knowing the changes in the soil quality through the interaction of properties is important for proper management practices to be implemented when the soil is used in cultivated areas (ALENCAR et al., 2015). In this context, we have attempted to identify, select, and assign quantitative values for the best quality indicators of the performance of certain soil functions. Among several indicators, Assis Júnior et al. (2016) presented an assessment index for soil structure (Srelative), which derived from the S
index proposed by Dexter (2004).
The relativized S index (Srelative) allows
inferring quantitatively about the effects of different uses and management on the soil structure. Among the advantages of the aforementioned indicator, it is worth noting the lack of ranges of indicative values of soil quality as in the S index (ASSIS JÚNIOR et al., 2016). According to Silva et al. (2010) and Jong van Lier (2014), the limits used in the S index are provisional and are not valid for several conditions described in the literature. The assessment index of the soil structure - the Srelative - has proved to be a
sensitive indicator of physical changes occurring in the soil (ALENCAR, 2014; ASSIS JÚNIOR et al., 2016).
Understanding the interactions between soil properties and the Srelative index is crucial to enable
the use of this indicator as a tool to infer about the soil quality. Accordingly, the response function is a tool able help to understand the interactions mentioned above.
Regarding the researches related to soil science, the response function has been used to verify the influence of water depths and fertilization levels with nitrogen and phosphorus on productive and economic yields (CARVALHO et al., 2013; PAIVA et al., 2012; SILVA et al., 2008; SILVA et al., 2012b). The response function is used to characterize how a response is influenced by a number of factors, to identify, know and analyze the
maximum or minimum responses of the relationship between the response variables and the quantitative factors affecting them (CUSTÓDIO; MORAIS; MUNIZ, 2000).
In this scenario, the study started from the following hypotheses: 1) Since the Srelative index is
dependent on soil structure, it is strongly influenced by the porous fraction properties, particularly by the area available for the flow and the pore continuity; 2) and the application of biofertilizer influences on soil structure, thereby causing effects on the Srelative
index. Therefore, this research aimed at knowing the influence of physical properties associated with the soil structure, with and without biofertilizer application, on the Srelative index.
MATERIAL AND METHODS
The study site is located in Chapada do Apodi, in the Teaching, Research, and Extension Unit, one of the units of the Federal Institute of Education, Science and Technology (IFCE - Campus
Limoeiro do Norte), located in the municipality of Limoeiro do Norte, Ceará state. The experimental area, cultivated with fig (Ficus carica L.), has the
geographical coordinates 5 ° 10 '57.64 "S and 38 ° 0' 45.97" W in its center and altitude of 145 m.
The secondary forest taken as a reference is located 400 m away from the cultivated area. The soil of the experimental area is classified as typical eutrophic Cambisol - CXve (Typic Haplocambids) (SANTOS
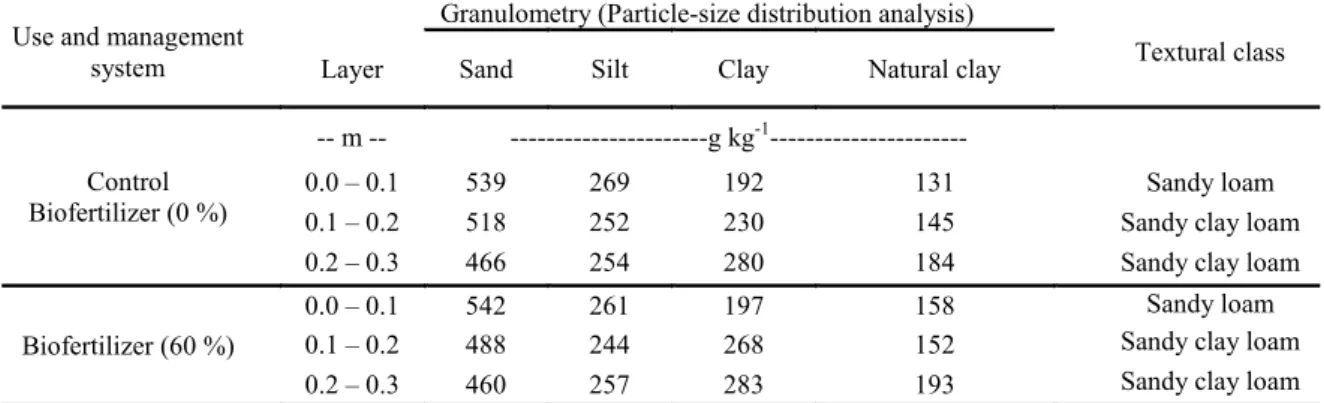
et al., 2013). Some physical soil properties are shown in Table 1.
The experiment was carried out in open field, cultivated with fig and under biofertilizer application. The biofertilizer applied to the soil was produced by means of an anaerobic process in plastic containers (200-liter volume). A hose was adapted to
the lid and its other end was immersed in a container with water at a height of 0.20 m for gas output. The proportion used to produce the biofertilizer was 50% (volume/volume = v / v) of the fermentation of fresh bovine manure and water for a period of 30 days.
The biofertilizer dosages were formulated with the following proportions: B0% - 0%
biofertilizer and 100% water, B60% - 60%
biofertilizer and 40% water. The biofertilizer was applied to the soil from October 2010 to August 2012, totaling 23 months, 4 crop cycles, 46 applications, and a total of 138 L of the solution applied to the soil per plant.
To assess soil quality under fig cultivation, two situations (with and without the application at 60% liquid bovine biofertilizer in the irrigation water depth) were evaluated in the 0-0.1 m layer (surface
layer) and in the 0-0.3 m layer (effective root depth).
For that, disturbed and undisturbed soil samples were collected in the above-mentioned layers. The
undisturbed samples were collected using Uhland soil sampler, in 0.05-m-high steel rings with a
diameter of 0.05 m. These samples were analyzed in the laboratory for grain size analysis, soil bulk and particle densities, intrinsic soil air permeability (Kair), pore continuity index (K1), aeration porosity
(εair), soil penetration resistance, soil water retention
curve, total porosity, macroporosity, microporosity, S index and Srelative index.
In the particle size analysis, 1 mol L-1 sodium hydroxide was used for the chemical dispersion of the particles. Clay content was determined by the pipette method and sand content through sieving. Silt content was determined through difference considering the initial sample of soil minus the sum of sand and clay (DONAGEMA, 2011).
Particle density (ρp) was determined through the volumetric flask method and soil bulk density (ρs) was determined using undisturbed soil samples, collected in cylinders of known volume, and dried at 105 °C until constant mass. Intrinsic soil air permeability was determined through the decreasing pressure method. An amount of air, corresponding to the pressure of 1 kPa in the reservoir, passed through the volumetric ring containing an undisturbed soil
sample, balanced at tensions of 2, 6, 10, 33, and 100 kPa. During the procedure, the pressure decay over time was measured electronically until reaching a balance with the atmospheric pressure using the software PermeAr, v.1.0 (SILVEIRA et al., 2011). The coefficient of soil air permeability (Kair) was
determined using equation 1,
, (1) Where: Kair is the soil air permeability coefficient
(m2),Vis the air volume passing through the cylinder
(m3), η is the dynamic air viscosity (Pa.s), L is the
height of the volumetric ring (m), A is the cross-section of the soil sample (m2), Patm is the
atmospheric air pressure (Pa) and b is the angular coefficient of the linear regression of the pressure (ln of pressure) over time.
Aeration porosity (εair) was calculated as the difference between total porosity and the volumetric water content at each matric potential established. Pore continuity index (K1) was
suggested to determine whether differences inKaircan only be attributed to differences in εair or
if they can partially be attributed to other geometric aspects of the air-filled porous space, such as
pore-size distribution, tortuosity, and continuity, and
was obtained through equation (2),
. (2)
b
P
A
V
L
K
atm
air
.
.
.
.
3
.
2
air air
ε
K
=
K
1 Table 1. Soil physical characteristics.Use and management system
Granulometry (Particle-size distribution analysis)
Textural class
Layer Sand Silt Clay Natural clay
Control Biofertilizer (0 %)
-- m -- ---g kg-1---
0.0 – 0.1 539 269 192 131 Sandy loam
0.1 – 0.2 518 252 230 145 Sandy clay loam
0.2 – 0.3 466 254 280 184 Sandy clay loam
Biofertilizer (60 %)
0.0 – 0.1 542 261 197 158 Sandy loam
0.1 – 0.2 488 244 268 152 Sandy clay loam
0.2 – 0.3 460 257 283 193 Sandy clay loam
Table 2. Chemical properties of the pure bovine biofertilizer and the estimated doses, after diluted in water, in the different concentrations.
Biofertilizer
Macronutrients Micronutrients
--- cmolc dm-3 --- --- mmolc dm-3 ---
N P K Ca Mg S Fe Zn Cu Mn B Na
Pure (100 %) 27.9 11.8 3.0 2.9 2.3 3.3 3.0 0.2 0.06 0.3 0.4 7.6
60 % 16.8 7.1 1.7 1.7 1.4 2.7 2.0 0.1 0.04 0.2 0.3 4.6
C.E. (dS m-1) C (%) C/N pH
Pure (100 %) 7.05 1.08 13.8 7.78
60 % 4.23 0.648 13.8 8.14
Soil penetration resistance was determined in undisturbed structure samples, with water content corresponding to the tension of 10 kPa. For that, we used a static electronic penetrometer, equipped with a load cell of 20 kgf, a cone with a 4 mm diameter rod, a base area of 12.566 mm², and a 60° angle with a velocity of penetration of 1 cm min-1, record of one reading per second, coupled to a microcomputer to acquire the data via its own software. The procedure included three replicates per sample, with 180 readings per repetition, totaling 540 readings in each sample, disregarding the first and last centimeter of the soil sample.
In the determination of the soil water retention curve, the saturation water content was considered equal to soil total porosity (TP); Haines’ funnel was used for low matric potentials (2, 4, 6, 8 and 10 kPa) and Richards’ porous plate apparatus was used for the others (33, 100, 300, 700, 1000 and 1500 kPa). The curve fitting was performed according to the mathematical model proposed by van Genuchten (1980), equation 3:
, (3)
θr and θs are, respectively, residual and saturation
water contents (m3 m-3), f is the soil water matric potential (kPa), a is a scaling factor for f, and m and n are parameters related to the curve shape. The software SWRC, version 2.0, was used, fixingθrandθsat the soil water contents measured in
the laboratory at saturation and at the tension of 1,500 kPa, respectively. The parametersa, m, and n were fitted using the Newton-Raphson
iterative method, with no dependence
betweenmandn.
Soil porosity was obtained through
TP= [1- (rs/rp)], where TP is the total porosity
(m3 m-3), and ρp and ρs are soil particle and bulk densities (Mg m-3) respectively. Microporosity was determined using Haines’ funnel, through the application of a 6-kPa tension on the samples, until
the water occupying the pores with diameter ≤50 µm was drained. Macroporosity was calculated as the difference between total porosity and microporosity.
The slope at the inflection point (S index) was determined based on the parameters of the equation by Van Genuchten, according to the equation (DEXTER, 2004).
. (4) The Srelative index was calculated as the ratio
between the value of S obtained through the soil-water characteristic curve for the management
considered and the value of the reference curve S. The S used as reference was obtained through the soil-water characteristic curve for the secondary
native forest, constructed with a disturbed sample,
m) ( 1 n r s r
sat res
mm
u
u
n
S
11
1
taking a sample of air-dried fine earth (ADFE),
which went through a process of dispersion in water, following the method described for particle-size
distribution analysis. As stated, the purpose of the dispersion was to make the arrangement of the soil particles solely dependent on the textural porosity. After carrying out the dispersion process, the samples containing sand, silt, and clay in solution were sent to the oven at 45 ° C until they achieved constant mass.
Subsequent to the dispersion, the material was used to construct the soil-water characteristic curve
and the value of S index was obtained from it. As described by Alencar (2014), the Srelative index was
obtained using equation (5)
, (5) It must be highlighted that the values of S in both forms of soil structure derive mathematically from equation 3, but substituting a volume-based moisture
for gravimetric moisture.
Following the procedures described by Nunes (1998), the response function model was applied to verify how the independent soil physical variables influence on the Srelative in the 0-0.1 m layers treated
with 0 and 60% biofertilizer. The first order linear model (Equation 6) was used to adjust the response variable according to the soil physical variables, combined two to two,
, (6) Where: z is the response variable, β0, β1, and β2 are
coefficients of the equation and x and y are independent variables. Once the response functions were known, the Student t test at 15% was applied to the parameters of each equation.
Subsequently, the slopes of both functions, represented by the coefficients β11 and β12, were compared for the application of 0 and 60% biofertilizer, respectively, assuming a common variance of the samples estimated by Sz2x, to verify if
there were effects of the treatments on the response variable z. The standard error for the estimation of the coefficients was calculated by equation 7,
, (7) Where: z is equal to z1 and z2, which are, respectively, the response variables for application of 0 and 60% biofertilizer, and z is equal to and which are, respectively, the estimates of the response functions for application of 0 and 60% biofertilizer. Then, the estimation of was calculated using equation 8,
, (8) Where: n is the number of samples.
disturbed d undisturbe relative
S
S
S
y
x
z
0
1
22
)
ˆ
(
.
n
z
z
s
zx1
ˆ
z
z
ˆ
2
2 ZX
S
2 2 ) 2 ( ) 2 ( 2 1 . 2 2 . 1 1²
n n s n s n
s z x z x
In addition, the standard error of the difference between β11-β12 and β21-β22, equation 9,
was calculated and Student's t-test was applied at
10%, rejecting H0 when | t | was greater than the
tabulated critical value for tα/2 n1+n2-4,
. (9) The error of β21 is calculated by replacing β11-β12 by β21-β22 in equation 9.
The method of multiple regression was also applied to verify the effect of the variables on the Srelative for the 0-0.3 m layer in both treatments. Then,
by means of the backward elimination method, the variables with greater weight for the estimation of the Srelative were selected at 10% significance level.
22 2
1 ²
1 1
1 1
2 -1
x x
s t
x z
All data were submitted to the Shapiro-Wilk
normality test at 5% significance level.
RESULTS AND DISCUSSION
We observed in Table 3 a low variability for soil density and total porosity, and an intermediate variability for the other properties (WARRICK; NIELSEN, 1980). Once the Shapiro-Wilk test was
applied, at 5% significance level, we verified that, except for the intrinsic parameter of soil air permeability, the data of the other properties followed normal distribution and, therefore, deviations are considered not random and the arithmetic mean can be adopted as a representative of the central tendency of population values.
Table 3. Descriptive statistics for the attributes soil bulk density (ρs), total porosity (TP), macroporosity, microporosity,
intrinsic soil air permeability (Kair), pore continuity index (K1), soil penetration resistance (PR) e Srelative.
Values in bold show normal distribution by the Shapiro-Wilk test at 5% significance.
The Student's t test was applied, at 15% significance level, to the coefficients of the mathematical model z = β0 + β1x + β2y (Table 4), considering only the situations where there was significance for at least one of the coefficients β1 and
β2 in one of the treatments. In doing so, only the variables soil density, total porosity (TP), and pore continuity index (log K1) were significant under no biofertilizer application. When the 60% biofertilizer was applied, there was a significant effect for the variables soil penetration resistance and macroporosity. In this case, the equations in which the coefficients were not significant were excluded, since they had no influence on the estimation of the Srelative index.
When analyzing the relations of the bivariate linear model of first order, in which these variables were significant, we observed that the soil density is inversely related to the Srelative index while the
variables, pore continuity, total porosity, soil penetration resistance, and macroporosity are directly related.
Thus, an increase in the soil bulk density values leads to an increase in the values of Srelative
and, consequently, a reduction in the soil structural quality. According to the results obtained by Andrade and Stone (2009), Dexter (2004), Li et al. (2011), Silva et al. (2012a), and Yang et al. (2015), soil bulk density increasing values lead to a slope reduction of the tangent line through the inflection point of the soil-water characteristic curve and;
consequently, the S index values and the Srelative
index values are reduced. Thereby, the inverse relationship found in this study between the soil density and the Srelative index is evident, since it is
dependent on the S index.
When analyzing the soil bulk density property, the addition of biofertilizer had no significant effect, at least during the assessed period. Nogueira (2009) found similar results studying the application of biofertilizer on physical properties of a Cambisol area also located in Chapada do Apodi.
Statistical parameters Soil attributes
s TP Macro Micro Kair K1 PR Srelative
Average 1.480 0.428 0.104 0.323 1.394 2.393 0.898 1.563
Standard deviations 0.101 0.038 0.054 0.042 0.469 0.350 0.256 0.298
Coefficient of variation (%) 7 9 51 13 34 15 29 19
Table 4. Response functions for the Srelative (Sr) starting from the variables soil bulk density, pore continuity index, soil penetration resistance, macro and microporosity and total porosity in the Cambisol treated with and without bovine liquid biofertilizer.
Variables Without biofertilizer (0 %) R2 With biofertilizer (60 %) R2
Sr vsρs vs logK1
Sr = -1.73-0.15ρs +1.25logK1
0.20
Sr = 6.15-2.39ρs -0.49logK1
0.98
β0: P > |t| = 0.84
β1: P > |t| = 0.94
β2: P > |t| = 0.71
β0: P > |t| = 0.70
β1: P > |t| = 0.10
β2: P > |t| = 0.20
Sr vsρs vs PR
Sr = -0.23+2.08ρs -1.69PR
0.96
Sr = 5.17-2.49ρs +0.01PR
0.78
β0: P > |t| = 0.78
β1: P > |t| = 0.17
β2: P > |t| = 0.13
β0: P > |t| = 0.35
β1: P > |t| = 0.52
β2: P > |t| = 0.99
Sr vs Macro vs PR Sr = 4.39-8.26Macro-2.33PR
0.83
Sr = 2.15+0.78Macro-0.74PR
0.60
β0: P > |t| = 0.21
β1: P > |t| = 0.35
β2: P > |t| = 0.28
β0: P > |t| = 0.44
β1: P > |t| = 0.93
β2: P > |t| = 0.65
Sr vs Micro vs logK1 Sr = 3.97-12.46Micro+0.47logK1
0.52
Sr = 16.28-31.39Micro-1.97logK1
0.71
β0: P > |t| = 0.72
β1: P > |t| = 0.55
β2: P > |t| = 0.86
β0: P > |t| = 0.37
β1: P > |t| = 0.42
β2: P > |t| = 0.36
Sr vs Micro vs TP Sr = 7.39-25.54Micro+4.23TP
0.97
Sr = -6.18+12.79Micro+8.20TP
0.99
β0: P > |t| = 0.72
β1: P > |t| = 0.55
β2: P > |t| = 0.86
β0: P > |t| = 0.04
β1: P > |t| = 0.05
β2: P > |t| = 0.02
For the variables total porosity and log K1, an increase in their values contributes to the increase of the Srelative index. The total porosity is a physical
property sensitive to changes in soil structure, i.e. a reduction in its values indicates a process of soil degradation (DEXTER, 2004; SILVA et al., 2012a). Therefore, since the Srelative is a sensitive indicator of
structural quality, it is directly related to the total porosity. Results found by Andrade and Stone (2009) and Silva et al. (2012a), analyzing the correlation between total porosity and the S index indicate a positive correlation, corroborating the results found in this study.
As verified for the soil bulk density, the application of biofertilizer had no significant effect on the total porosity of the soil. As both variables have an inverse relationship, in which the increase of one causes a decrease in the other, and vice versa, the lack of soil porosity alterations is justified since soil density remained unchanged either.
Log K1, an indicator of pore continuity obtained from the ratio between Kair and ɛair, is
important as an index that allows inferences about gas exchanges between the soil and the atmosphere. Thus, high values of pore continuity are signs of improvement in soil structure, which explains the direct relationship between the log K1 and the Srelative.
Through this analysis, we could verify the absence of a significant effect of applying 60% biofertilizer on pore connection, being measured by log K1. Using the same function, Nascimento et al. (2015) reported less pore connectivity after 60% biofertilizer application compared with the control, which might be attributed to pore obstruction by organic residues. Regarding the increase in the values of soil
penetration resistance up to a certain value, which resulted in a higher value of the Srelative, indicating
improvement in the soil structural quality, it can be explained by an increasing microporosity and, therefore, an increase in root penetration resistance. According to Nascimento et al. (2015), the ratio between macrospores and microspores was 1: 2.4 in the soil without biofertilizer application, and 1: 3.0 in soil with the application (60%), proving microporosity increase after biofertilizer application. For Kiehl (1979), an ideal soil should present the ratio of 1 macropore to 2 micropores in order to allow a good flow of gases and heat and good condition of water storage.
It is worth noting that although increases in the values of soil penetration resistance in this research have been beneficial, they should not reach values that would restrict root growth and plant development. Penetration resistance values between 2 and 2.5 MPa have been pointed as the critical limits for root growth of most vegetables (SILVEIRA et al., 2010).
The pore distribution by size significantly influences the behavior of the soil-water
characteristic curve, affecting the Srelative index.
Laurani et al. (2004) and Alencar et al. (2015) found results that corroborate the statements about the influence of the pore distribution on the curve of soil water retention. The increase in the macroporosity values results in a higher slope of the tangent line through the inflection point of the soil-water
characteristic curve, which increases the value of the S index, and the value of the Srelative. Andrade and
macroporosity and the S index. Alencar et al. (2014) found similar results when studying the correlation between the macroporosity and the Srelative.
Regarding the comparison between the coefficients β1 and β2 for the Srelative in treatments
with biofertilizers 0 and 60%, when the Student’s t
-test was applied at a 10% significance level (Table 5), there was a difference between the coefficients,
evidencing the influence of the biofertilizer application on the Srelative response. In this case, it can
be deduced that a mathematical function of the two comparisons cannot solely represent the relation between the pairs of independent variables and the dependent variable Srelative for the treatments applied
to the soil.
Table 5. Significance test for the difference between the response functions coefficients for Srelative (Sr) in Cambisol treated with and without bovine biofertilizer.
To evaluate the effect of the application of the biofertilizer 60% on the response functions, we used the mean value of the observations of each variable in each mathematical function that showed a difference between the coefficients. As a result, it follows that the application of biofertilizer 60% positively acted on the Srelative since the respective
values were higher than in the treatment without biofertilizer application. As a result, it can be inferred that the application of the biofertilizer 60% resulted in an improvement in the soil structural quality, emphasizing that this form of management is technically correct and may be used as a way to
mitigate the harmful effects on soil physical properties when it is cultivated.
In the situation where the soil layer was considered from 0-0.3 m, a multiple linear regression
analysis was performed with the purpose of assisting the interpretation of the complex relations between the independent variables and the Srelative index, in
order to explain such relations in simpler terms and with fewer variables. Equation 10 represents the relationship between all independent variables and the Srelative index for treatment without biofertilizer
application.
PR K
TP Micro
Macro Kair
s
Sr 35.2613.74
0.57 1362.30 1363.93 1326.81 0.81 10.53 , (10)R² = 0.86; p>0.85
The prediction of the Srelative values based on
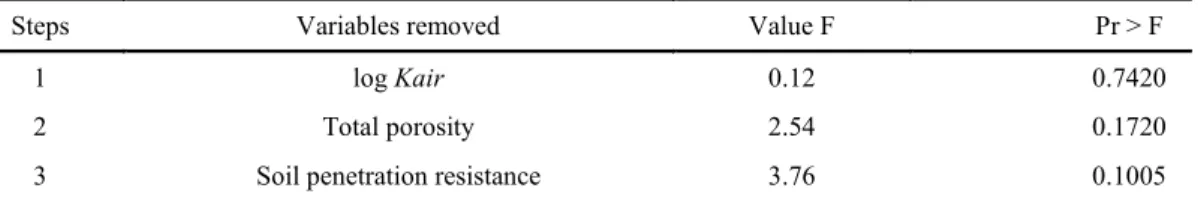
equation 10 requires a greater demand of time and work to obtain the information related to the variables that appear in the mathematical function. Considering the backward elimination method in which the removal of variables with a lower weight occurs after using the F test (Table 6), the equation
10 was reduced to Equation 11, a simpler function since it has fewer variables, facilitating the understanding of the Srelative behavior. It is important
to highlight the reduction of the work and the time to obtain variables, since only the variables soil density, macroporosity, microporosity and pore continuity index are required.
Table 6. Summary of the elimination of the variables by the method of backward elimination for Cambisol without application of biofertilizer.
Steps Variables removed Value F Pr > F
1 log Kair 0.12 0.7420
2 Total porosity 2.54 0.1720
3 Soil penetration resistance 3.76 0.1005
1 34 . 0 52
. 33 18
. 32 13 . 12 55 .
31 s Macro Micro K
Sr
, (11)R² = 0.65; p>0.9
Variables Contrast of treatments β1 β2
t observed t tabulated t observed t tabulated
Sr vsρs vs log K1 B0% x B60% 13.89 2.132 7.989 2.132
Sr vsρs vs PR B0% x B60% 3.732 2.132 9.124 2.132
Sr vs Macro vs PR B0% x B60% 4.106 2.132 6.047 2.132
Sr vs Micro vs log K1 B0% x B60% 24.03 2.132 14.96 2.132
In treatments where the biofertilizer 60% was applied, equation 12 represents the most complex relationship between all variables and the Srelative
index.
It is observed a larger number of independent
variables to be excluded from the initial multiple linear equation when compared to the treatment without biofertilizer application, evidencing the influence of the biofertilizer mentioned previously (Table 7).
PR K
TP Micro
Macro Kair
s
Sr 12.494.79
0.28 695.60 701.76 707.14 0.36 10.49 ,(12) R² = 0.86; p>0.85
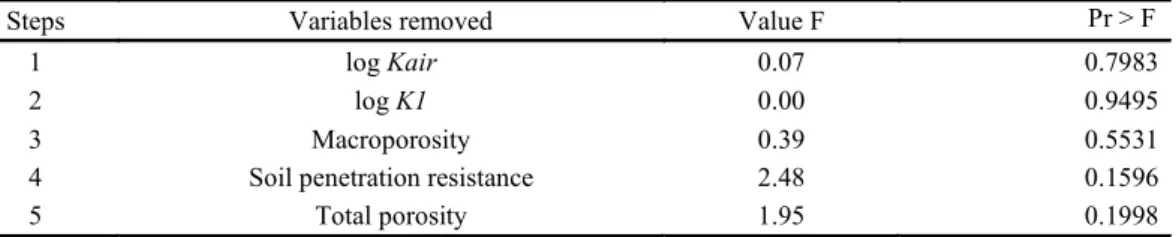
Table 7. Summary of the elimination of the variables by the method of backward elimination for Cambisol with application of biofertilizer.
Steps Variables removed Value F Pr > F
1 log Kair 0.07 0.7983
2 log K1 0.00 0.9495
3 Macroporosity 0.39 0.5531
4 Soil penetration resistance 2.48 0.1596
5 Total porosity 1.95 0.1998
In treatments where the biofertilizer 60% was applied the final process suggests that equation 13 is the resultant and the representative of the relations between the analyzed variables and the Srelative. Thus,
the results make the time saving and the cost reduction to obtain the variables evident since based on this equation only the soil density and the microporosity are indispensable.
Micro s
Sr 2.601.61
4.24 , (13)R²=0.74; p>0.99
In view of the above, the importance of a retroactive elimination in the multiple linear regression analysis is evident for the adequate choice of independent variables that are necessary to understand in a simple way the behavior of the dependent variable, which in this case is the Srelative.
In addition, it became clear that the Srelative index
correlates inversely with soil density and directly with properties of the porous part, which makes it a strong indicator to be used to monitor changes in soil structure.
CONCLUSIONS
The Srelative index is strongly influenced by
properties of the porous fraction, being the total porosity and pore continuity those of significant influence.
The management with liquid bovine biofertilizer results in improvement in soil structure, with effects measured by the Srelative index.
REFERENCES
ALENCAR, T. L. Alterações físicas em um Cambissolo tratado com biofertilizante: indicadores de qualidade e refinamento do método de avaliação pelo Srelativo. 2014. 46 f.
Dissertação (Mestrado em Solos e Nutrição de Plantas) - Universidade Federal do Ceará, Fortaleza,
2014.
ALENCAR, T. L. et al. Sensibilidade do Srelativo às
variações da estrutura e textura de solos. In: Brazilian Symposium on Salinity & II Brazilian Meeting on Irrigation, 2014, Fortaleza. Anais…, Fortaleza, 2014.
ALENCAR, T. L. et al. Atributos físicos de um Cambissolo cultivado e tratado com biofertilizante na Chapada do Apodi, Ceará. Revista Brasileira de Ciência do Solo, Viçosa, v. 39, n. 3, p. 737-749, 2015.
ANDRADE, R. S.; STONE, L. F. Índice S como indicador da qualidade física de solos do cerrado brasileiro. Revista Brasileira de Engenharia Agrícola Ambiental, Campina Grande, v. 13, n. 4,
p. 382-388, 2009.
ASSIS JÚNIOR, R. N. et al. Pore network of an Inceptisol under different uses and relativized S
-index as an indicator of soil physical quality.
Pesquisa Agropecuária Brasileira, Brasília, v. 51, n. 9, p. 1575-1583, 2016.
CARVALHO, C. M. et al. Pinhão-manso:
Crescimento sob condições diferenciadas de irrigação e de adubação no semiárido nordestino.
Revista Brasileira de Engenharia Agrícola e Ambiental, v. 17, n. 5, p. 487-496, 2013.
Superfície de resposta em experimento com parcelas subdivididas. Ciência e Agrotecnologia, Lavras, v. 24, n. 4, p. 1008-1023, 2000.
DEXTER, A. R. Soil physical quality: Part I. Theory, effects of soil texture, density, and organic matter, and effects on root growth. Geoderma, Amsterdam, v. 120, n. 3, p. 201-214, 2004.
DONAGEMA, G. K. Manual de métodos de
análises de solos. Rio de Janeiro, RJ: Embrapa
Solos, 2011. 230 p.
JONG VAN LIER, Q. Revisiting the S-index for soil
physical quality and its use in Brazil. Revista Brasileira de Ciência do Solo, Viçosa, v. 38, n. 1, p. 1-10, 2014.
KIEHL, E. J. Manual de Edafologia: relação solo -planta. Piracicaba, SP: Ceres, 1979. 262 p.
KITAMURA, A. E. et al. Recuperação de um solo degradado com a aplicação de adubos verdes e lodo de esgoto. Revista Brasileira de Ciência do Solo,
Viçosa, v. 32, n. 1, p. 405-416, 2008.
LAURANI, R. A. et al. Distribuição de poros de um Latossolo Vermelho Eutroférrico na fase de implantação de um sistema de plantio direto.
Engenharia Agrícola, Jaboticabal, v. 24, n. 2, p. 347-354, 2004.
LI, L. et al. Soil physical qualities in an Oxic Paleustalf under different tillage and stubble management practices and application of S theory.
Soil and Tillage Research, Amsterdam, v. 113, n. 2, p. 82-88, 2011.
McKENZIE, B. M.; TISDALL, J. M.; VANCE, W. H. Soil physical quality. Murdoch, Austrália: Encyclopedia of Earth Sciences Series, 2014, p. 770
-777.
NASCIMENTO, I. V. et al. Qualidade da rede de poros de um Cambissolo tratado com biofertilizante bovino líquido. In: VASCONCELOS, C. B. L. (Ed.).
Produção Orgânica no Semiárido. Mossoró:
Edufersa, 2015. v. 3, cap. 123, p. 1149-1155.
NOGUEIRA, F. A. Influência da aplicação de um biofertilizante e matéria orgânica em algumas propriedades físicas de um Cambissolo da Chapada do Apodi-CE. 2009. 82 f. Dissertação (Mestrado em Solos e Nutrição de Plantas)
-Universidade Federal do Ceará, Fortaleza, 2009.
NUNES, R. P. Métodos para a pesquisa
agronômica. Fortaleza, CE: UFC/CCA, 1998. 564 p.
PAIVA, M. R. F. C. et al. Doses de nitrogênio e de
fósforo recomendadas para produção econômica de milho-verde na Chapada do Apodi-RN. Revista Caatinga, Mossoró, v. 25, n. 4, p. 1-10, 2012.
RAUBER, L. P. et al. Physical properties and organic carbon content of a Rhodic Kandiudox fertilized with pig slurry and poultry litter. Revista Brasileira de Ciência do Solo, Viçosa, v. 36, n. 4, p. 1323-1332, 2012.
SANTOS, H. G. et al. Sistema Brasileiro de Classificação de Solos. 3. ed. Brasília: Embrapa, 2013. 353 p.
SILVA, A. P. et al. Indicadores da qualidade física do solo. In: JONG van LIER, Q. (Ed.). Física do solo. Sociedade Brasileira de Ciência do Solo, Viçosa, p. 541-281, 2010.
SILVA, B. M. et al. Índice S no diagnóstico da qualidade estrutural de Latossolo muito argiloso sob manejo intensivo. Bioscience Journal, Uberlândia,
v. 28, n. 3, p. 338-345, 2012a.
SILVA, F. L. Ambiência e biofertilização no cultivo orgânico de figo, em condições semiáridas. 2012. 124 f. Tese (Doutorado em Solos e Nutrição
de Plantas). Fortaleza: Universidade Federal do Ceará; 2012.
SILVA, G. F. et al. Doses de nitrogênio e de fósforo recomendadas para produção econômica de milho verde em Mossoró-RN. Revista Caatinga, Mossoró,
v. 25, n. 4, p. 1-10, 2012b.
SILVA, P. A. M. et al. Response function of the crisphead lettuce under irrigation depths and nitrogen rates. Ciência e Agrotecnologia, Lavras, v. 32, n. 4, p. 1266-1271, 2008.
SILVEIRA, D. C. et al. Relação umidade versus resistência à penetração para um Argissolo Amarelo Distrocoeso no Recôncavo da Bahia. Revista Brasileira de Ciência do Solo, Viçosa, v. 34, n. 3, p. 659-667, 2010.
SILVEIRA, L. R. et al. Sistema de aquisição de dados para equipamento de medida da permeabilidade intrínseca do solo ao ar. Revista Brasileira de Ciência do Solo, Viçosa, v. 35, n. 2, p. 429-436, 2011.
VAN GENUCHTEN, M. Th. A closed-form
equation for predicting the hydraulic conductivity of unsaturated soils. Soil Science Society of America Journal, Madison, v. 44, n. 5, p. 892-898, 1980.
New York, Academic Press, 1980. v. 1, p. 319-344.