ABSTRACT: No-tillage in Brazil is an effi cient agricultural system that improves crop productivity whilst controlling erosion caused to the soil by degradation. However, there is some concern regarding soil compaction. Our objective was to determine whether the function of soil structure in sustaining crop growth was dependent on row and interrow positions in long-term no-tillage. We took soil samples from a fi eld in a commercial farm under long-term no-tillage since 1979 on a clayey Oxisol in Southern Brazil. We assessed soil physical quality using the revised Peerlkamp technique and measured bulk density, air-fi lled porosity and air permeability of intact soil cores. Samples were incubated to assess in vitro N2O and CO2 production. The soil physical and struc-tural properties showed consistent differences between interrow and row positions, where the properties measured were more favorable. The revised Peerlkamp technique proved as effi cient as quantitative parameters in discriminating treatment differences. Overall, soil physical condi-tions in the interrow were less favourable than in the row. Pore continuity did not vary as regards position. This may explain why row position did not infl uence in vitro N2O and CO2 production. Soil physical quality under no-tillage system is enhanced, at least in the short term, by superfi cial disturbances in the row as a result of the action of the coulters of the no-tillage seeder.
Introduction
No-tillage is an effi cient management practice used to control soil erosion in Brazil and is considered to be one of the most important technological innovations for pro-viding agronomic, economic and environmental sustain-ability in agricultural production systems (Hobbs et al., 2008; Triplett Jr and Dick, 2008). The no-tillage system (NTS) promotes little mechanical disturbance of the soil, which keeps most crop residues on the surface, thereby increasing surface roughness. Under long-term NTS there is growing concern about the negative impact of compac-tion on the physical quality of the soil, despite the like-lihood that the increase in organic matter content may reduce soil compaction (Blanco-Canqui et al., 2009).
Physical properties that indicate dynamic processes related to water and air fl ow in the soil are more suitable for assessing the quality and physical function of soil under NTS (Cavalieri et al., 2009). Aside from these properties, semi-quantitative indicators such as the Visual Evaluation of Soil Structure (VESS) have been proposed for assessing the soil structural quality holistically (Sq) (Ball et al., 2007; Guimarães et al., 2011, 2013; Giarola et al., 2013; Munk-holm et al., 2013) and could potentially be applied to the evaluation of the soil structure in long-term NTS.
Unlike conventional tillage systems (Arshad et al., 1999), soil mobilization in NTS is limited to the plant rows, the intensity of which depends on the type of drill
coulter, which is usually equipped with either double discs or furrow openers. Lower soil density (Kaspar et al., 1991), lower soil resistance to penetration (Veiga et al., 2007) and better soil structure (Tormena et al., 2008) have been reported in the row compared to the interrow.
This study was performed to evaluate the hypoth-esis that crop position (row vs. interrow) infl uences soil structure under long-term no-tillage and that these changes in soil structure affect soil air permeability and greenhouse gas emission. The objective of this study was to evaluate soil bulk density (Bd), air-fi lled porosity (Afp), Sq through the visual evaluation of soil structure, intrinsic air permeability (Ka) as well as in vitro produc-tion of nitrous oxide (N2O) and carbon dioxide (CO2) gases in relation to row and interrow positions under a long-term NTS.
Materials and Methods
Characteristics of the study area
This study was conducted on a commercial grain production farm in Maringá, Northwest Paraná State, Southern Brazil (23°30'40" S, 51°59'48" W), at an average altitude of 454 m and a slope of between 0.03 and 0.08 m m–1. The region has a mesothermal humid subtropical climate, with average annual rainfall between 1,500 and 1,600 mm and average annual temperature between 20 and 22 °C. The Oxisol sampled in this study had a very Received March 09, 2013
Accepted December 03, 2013
1University of São Paulo/ESALQ – Dept. of Soil Science, Av. Pádua Dias, 11, C.P. 09 – 13418-900 – Piracicaba, SP – Brazil.
2Scotland's Rural College/Crop and Soil Systems Research Group, West Mains Road, Edinburgh EH9 3JG – UK. 3State University of Maringa – Dept. of Agronomy, Av. Colombo, 5790 – 87020-900 – Maringá, PR – Brazil. 4State University of Ponta Grossa – Dept. of Soil Science and Agricultural Engineering, Av. Gal. Carlos Cavalcanti, 4748 – 84030-900 – Ponta Grossa, PR – Brazil.
5Federal University of Technology-Paraná – Dept. of Agronomy, Via do Conhecimento, km 1 – 85503-390 – Pato Branco, PR – Brazil.
*Corresponding author <[email protected]>
Edited by: José Miguel Reichert/Luís Reynaldo Ferracciú Alleoni
Soil structure and greenhouse gas production differences between row and interrow
Alvaro Pires da Silva1, Bruce C. Ball2, Cássio Antonio Tormena3, Neyde Fabiola Balarezo Giarola4, Rachel Muylaert Locks
Guimarães5*
clayey texture with average contents of 800, 100 and 100 g kg–1 of clay, silt and sand, respectively, at 0-20 cm depth. The dominant components of the clay-size fraction (< 2
mm) were kaolinite, aluminium and iron oxides.Therefore, the soil was non expansive.
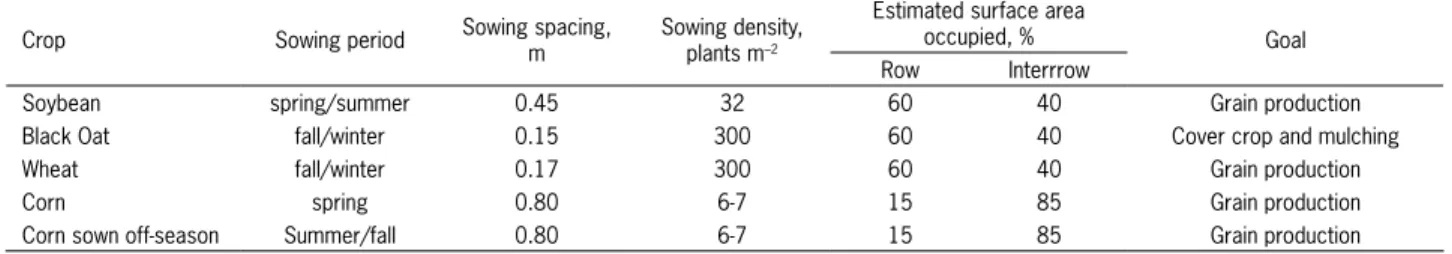
The NTS was initiated in 1979 with a crop rota-tion of soybeans (Glycine max (L.) Merr.) as summer crop, and black oats (Avena strigosa Schreb.) or wheat (Triticum aestivum L.) as winter crop. After 1990, the crop rotation included corn (Zea mays L.) as summer crop. Corn and soybeans were sown using furrow opener drills while oats and wheat were sown with double disc coulters. The sowing depth varied from 0.05 to 0.07 m. The distance between rows varied from 0.17 m to 0.8 m (Table 1). Dur-ing the thirty years of cultivation under NTS, lime was broadcast as dolomitic limestone. Fertilizers were applied at sowing, in the row in a separate coulter and at a depth of 0.12 m. Weed and pest control were performed in ac-cordance with the recommendation for each crop. The sowing periods, sowing spacing, sowing density and esti-mated area occupied of rows and interrows are indicated in Table 1. Tractors, harvester and sprayer traffi c was al-ternated throughout the area, in order to avoid heavy traf-fi c in specitraf-fi c areas and prevent soil compaction.
Sampling
Sampling was conducted at 40 locations along a transect crossing twenty crop rows, approximately thirty days after the sowing of the soybean crop in 2008. At each location (20 in rows and 20 in the adjacent inter-row positions) undisturbed soil blocks (0.15 m wide × 0.10 m height × 0.10 m thick) and intact soil cores (50 mm high × 70 mm in diameter) were collected. Blocks were taken from the topsoil through mini-trenches (0.30 m wide × 0.40 m long × 0.30 m deep) using a large spade. The cores were taken in stainless steel rings from the centre of the 0.0-0.10 m layer using an electric sam-pler that allowed the slow introduction of the volumetric cylinder in the soil without impact during sampling. We sampled this layer because (i) it is the most biologically active zone (Singh, et al. 2008), (ii) it is a possible limit-ing zone for gas transport (Ball et al., 2007), and (iii) it is the area where soil disturbance occurs under no-tillage.
Field evaluation of soil structural quality
Thirty fi ve days after the soybean sowing, the soil structure quality was evaluated in the soil blocks
as described in Ball et al. (2007). A visual soil structural quality (Sq) score was given only for the 0.0-0.1 m deep layer. The evaluation of structural quality was based on the size, strength, porosity and colour of aggregates and results ranged from 1-good to 5-poor structural quality (Ball et al., 2007; Guimarães et al., 2011).
Sample incubations and laboratory gas fl ux mea-surements
The intact cores were prepared and stored in the refrigerator at 1 °C to reduce biological activity and to maintain soil structure and were sent to the laboratory. The cores were slowly saturated by capillarity. Once saturated, samples were equilibrated at -10 kPa (fi eld capacity), on a tension table and incubated at 25 °C, a near-surface soil temperature expected in late spring in Brazil. After equilibration, the cores were put into sealed glass Kilner jars (1500 cm3 - 1 core per jar) containing
a three-way gas tap attached to the top of the jar, that was normally left open to the atmosphere. After 24 h, the tap was closed for 1 h, and a 28 mL gas sample was taken by attaching an evacuated glass (glass tubes 1 cm3
previously subjected to a vacuum) vial to the three way tap, opening the vial and allowing gas to fl ow from the jar to the vial in response to the change in pressure. An aliquot of gas from the incubation jar was moved to the glass tubes using differential pressure.
Every 1-3 days, aliquots of gas were collected and the concentration of N2O and CO2 was determined using gas chromatography. Sampling was done once per day for two days to ensure that any N2O production as a re-sult of mineralisation of N in the soil during sample pre-paration had ceased. Then, each intact core was treated with ammonium nitrate solution at an N concentration of 20 kg ha–1 by applying 1 mL as drops to the upper
sur-face to assess any priming effect of the fertilizer on N2O production. Two days later, 4 mL of the same solution of ammonium nitrate was added in the same way at an N rate of 100 kg ha–1.
The concentration of N2O and CO2 was determi-ned daily over the nine days following the fi rst fertilizer application in order to detect any production subsequent to the N application which is the period when most N2O fl ux associated with fertilizer application is likely to oc-cur (Dobbie et al., 1999). Gas production was calculated from the differences in gas concentration between the start and the end of the closure period, using the
geome-Table 1 – Sowing period, spacing and density for all crops under no-tillage system.
Crop Sowing period Sowing spacing, m
Sowing density, plants m–2
Estimated surface area
occupied, % Goal
Row Interrrow
Soybean spring/summer 0.45 32 60 40 Grain production
Black Oat fall/winter 0.15 300 60 40 Cover crop and mulching
Wheat fall/winter 0.17 300 60 40 Grain production
Corn spring 0.80 6-7 15 85 Grain production
tric properties of the incubation jar and the exposed core surface area.
Intrinsic air permeability (Ka), air-fi lled porosity (Afp) and water-fi lled pore space (WFPS) measure-ments
The intrinsic air permeability (Ka) in the undis-turbed samples of the cylindrical rings was measured at the end of the experiment. Samples were weighed and placed in an apparatus to quantify the airfl ow through the samples using the constant heat method of Ball and Schjønning (2002). At the end of the procedure, samples
were oven dried at 105 °C for 48 h to determine the soil water content, the soil bulk density (Bd) and to calculate the air-fi lled porosity (Afp) and the water-fi lled pore space (WFPS) using the methods of Ball and Schjønning (2002).
Ka and Afp were related by an exponential model (Equation 1), as follows: Log Ka = log M +Q log Afp,
where M and Q are empirical parameters and Q is a pore continuity index. Changes in Q relate to the tortuosity of the pores and surface area. The intercept on the x-axis
can be interpreted as an estimate of blocked air-fi lled pore space which does not contribute to convective fl ow (Ball et al., 1988). Statistical analysis used the procedu-res PROC TTEST (row versus interrow analysis) proce-dures and PROC REG (regression analysis) available in the SAS/STAT software package (Statistical Analysis Sys-tem, version 8, 2000).
Results
The soil and gas properties are summarized accord-ing to location in transect as interrow or row in Figure 1. Although some samples showed a sharp response in gas production to fertilizer addition, most gave small respons-es. Hence we expressed in vitro N2O and CO2 production as cumulative over the period after fertilizer application.
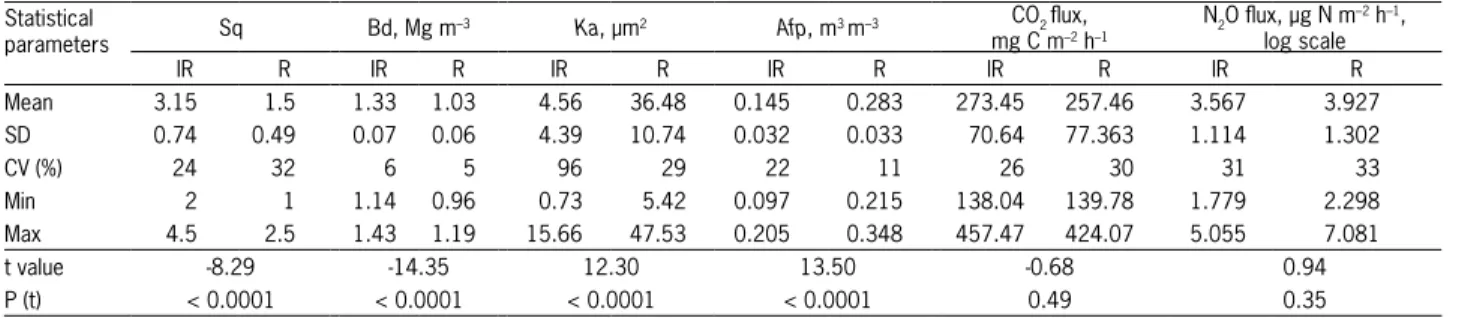
Soil physical and structural properties showed a consistent and systematic difference between interrow and row with most properties being more favorable in the rows. The sampling position effect was signifi cant (p < 0.05) for all soil physical properties (Table 2).
ertheless, some were more sensitive, as judged from the magnitude of the t-value, to the sampling position with Bd>Afp>Ka>Sq. The variability of Sq and Bd was simi-lar within rows and within interrows. The variability of Ka and Afp was greater within interrows than within rows.
The mean air permeability in the row was eight times higher than in the interrow (Table 2). The vari-ability of air permevari-ability in the interrow was 3.3 times higher than in the row, whereas the variability of air fi lled porosity was only twice as high (Table 2). There was no effect (p < 0.05) of the treatments on in vitro N2O and CO2 production. The mean total C and N contents for rows were 2.50 % and 0.21 % and for interrows were 2.47 % and 0.22 %, respectively.
Air permeability and air-fi lled porosity (Figure 2) were signifi cantly correlated (p < 0.05). The interrow and row values form two distinct populations. The re-gression slopes were not different (p = 0.95), and the blocked pores were 0.3 % for rows and 0.4 % for inter-rows. In rows, N2O and CO2 were highly correlated, but not in interrows. In rows there were signifi cant relation-ships between CO2 fl ux and bulk density and air-fi lled porosity. Soil structural quality was the only soil physi-cal property which approached a signifi cant relationship (p = 0.09) with N2O (Table 3).
Discussion
The Sq score in the rows was better than in the in-terrows. The mean value of Sq in the interrows (Sq = 3.15) was the boundary between fair and poor (Ball et al., 2007) and showed higher variation within the range of values (2 to 4.5 - Figure 1A), which was clearly observed during analysis. In this situation, 40 % of the observations presented Sq scores higher than 3, 40 % had Sq = 3 (limit of structural quality between good and bad, as Ball et al., 2007) and only 20 % of the samples were not high enough in Sq score considered to require remedial action.
Soils which have Sq score above 3 already require corrective measures to improve the quality of the soil structure for root growth (Ball et al. 2007). On the other hand, in the row position, variation range of the Sq was narrower (1 to 2.5 - Figure 1A) and 90 % had Sq less than or equal to 2. Only in interrow position Sq was
signifi cantly (p < 0.05) related to soil physical properties (Table 3), because there was a greater range of varia-tion in values than in rows (Table 2). This may be due to heterogeneity in the row caused by root growth and mechanical action by the seeder.
The method was sensitive enough to determine differences in compaction status between soils (Ball et al., 2007; Guimarães et al., 2013), clearly an important factor in the interrows which receive no loosening. The Visual Evaluation of Soil Structure was a rapid test and was shown to be as effi cient as the quantitative param-eters discriminating between row or interrow positions. The difference between treatments in bulk density was the most marked (Figure 1B), giving the highest t-value (Table 2). There were four t-values > 1.40 Mg m–3
in the interrows and for the row the highest value found was 1.25 Mg m–3.Blainski et al. (2009) estimated the least
limiting water range (LLWR) - a concept of available water that takes into account the infl uence of aeration and soil resistance to penetration (SR) in addition to soil water po-tential – and they found that at a bulk density (Bd) of 1.40 Mg m–3 the LLWR tends to zero. In other words, the
criti-cal bulk density (Bdc) was 1.40 Mg m–3, indicating severe
soil physical degradation when Bd > Bdc.
In the interrows, the mean air permeability had greater similarity than that determined by Bavoso et al. (2012) in a clay Typic Hapludox, but higher than in a sandy clay loam Typic Hapludox (Silveira Júnior et al., 2012) in the same soil water potential (-10 kPa) and man-agement. There were two values below 1 µm2 (Figure
1D), which is the value considered by Ball et al. (1988) to represent pore blockage of the system, because when Ka = 1 µm2 (log Ka = 0) the pores were blocked and would
not be part of the convective air transport (McQueen & Shepherd, 2002). This low Ka is related to the action of mechanical stresses determined by the intensive traffi c of machinery on wet soil conditions that reduce air per-meability as a consequence of reduced macroporosity (Dörner and Horn, 2009). On the other hand, the mean Ka (Table 2) was about three times higher in the rows than that measured by Bavoso et al. (2012), indicating that mobilization provoked by the implement used for seeding (furrow openers) promoted the aeration of the soil at specifi c areas.
Table 2 – Means and associated statistics for all soil and gases properties measured on undisturbed samples.
Statistical
parameters Sq Bd, Mg m
–3 Ka, µm2 Afp, m3 m–3 CO2 fl ux,
mg C m–2 h–1
N2O fl ux, µg N m–2 h–1,
log scale
IR R IR R IR R IR R IR R IR R
Mean 3.15 1.5 1.33 1.03 4.56 36.48 0.145 0.283 273.45 257.46 3.567 3.927
SD 0.74 0.49 0.07 0.06 4.39 10.74 0.032 0.033 70.64 77.363 1.114 1.302
CV (%) 24 32 6 5 96 29 22 11 26 30 31 33
Min 2 1 1.14 0.96 0.73 5.42 0.097 0.215 138.04 139.78 1.779 2.298
Max 4.5 2.5 1.43 1.19 15.66 47.53 0.205 0.348 457.47 424.07 5.055 7.081
t value -8.29 -14.35 12.30 13.50 -0.68 0.94
P (t) < 0.0001 < 0.0001 < 0.0001 < 0.0001 0.49 0.35
Air-fi lled porosity in the row was the double of that observed in the interrow. Nevertheless, there were only two values lower than 10 %, indicating that air-fi lled po-rosity and, possibly, soil aeration were mostly favorable within the rows. Air-fi lled porosity values between 0.05 and 0.15 (m³ m–³) can be used as critical limits (Chan,
2002); below this range there is insuffi cient aeration for root growth. In this case, we observed mean values of 0.145 m³ m–³, indicating root growth could be constrained
by the low aeration.
The favorable, though variable, soil physical condi-tions within rows were due to the loosening action of the chisel coulters of the no-tillage seeder. These penetrate up to 0.12 m depth, giving localized tillage. The coulter acts like a small tine cultivator to 0.12 m depth. This action helps to alleviate surface soil compaction (Veiga et al., 2007).
Despite the marked soil physical differences be-tween row and interrow there was no effect on in vitro CO2 and N2O production. The overall magnitude of the in vitro N2O production in this soil was small, though fur-ther research is needed on these soils to quantify possible emissions. Low fl uxes after fertilizer application are
usu-ally associated with satisfactory aeration (Dobbie et al., 1999). Our soil physical data gave no evidence of poor aeration conditions likely to result in denitrifi cation. In vitro CO2 productions were typical for soils with these intrinsic properties (La Scala et al., 2001). The two loca-tions with highest in vitro N2O production were from row positions 23 and 35. In vitro CO2 production was also high at these locations. These positions showed no unusual soil physical properties so that the high fl uxes were likely caused by crop residues forming hot spots of biological activity in soil conditions favoring soil respiration.
The blocked pores derived from the relationship between air permeability and air-fi lled porosity had low values compared to those given by Ball et al. (1988), Schjønning et al. (2002) and Dorner and Horn (2009). In addition, the value of the pore continuity index is also low (Figure 2) compared to those given by Ball et al. (1988) and Schjønning et al. (2002), but it indicates favor-able pore continuity. Thus, despite the disturbance of the soil within the row, the pore continuity was maintained. Furthermore, the low blocked porosity indicates that the favourable soil porosity conditions associated with mi-croaggregation typical of the Oxisol (Volland-Tuduri et al., 2005) were preserved or recovered by long-term no-tillage. Hence, the confi guration of the pore space in the soil of interrows and rows is similar.
The main difference between rows and interrows can be inferred from the differences in air permeability as a greater size (pore radius) and number of conducting air-fi lled pores in the rows than in the interrows. Neverthe-less, pore continuity was similar in interrow and row soil and this may have made up for the poorer soil physical conditions in the interrows and may be the reason for the lack of difference between them in N2O and CO2 fl ux. De-spite overall soil physical conditions in the interrow being less favorable than in the row, they are adequate to enable dynamic properties such as aeration to function, which agrees with the conclusion of Cavalieri et al. (2009).
Table 3 – Pearson’s Correlation Coeffi cient for soil and gases properties. Probability values in brackets.
Bd Ka Afp CO2 N2O
Row
Sq -0.126 0.361 0.099 0.257 0.389
(0.59) (0.12) (0.68) (0.27) (0.09)
Bd -0.722 -0.913 -0.528 -0.269
(<.0001) (<.0001) (0.017) (0.25)
Ka 0.624 0.402 0.189
(0.003) (0.079) (0.43)
Afp 0.478 0.213
(0.032) (0.37)
CO2 0.747
(0.0002) Interrow
Sq 0.520 -0.565 -0.629 0.320 -0.084
(0.019) (0.009) (0.003) (0.17) (0.73)
Bd -0.786 -0.839 -0.054 -0.235
(<.0001) (<.0001) (0.82) (0.32)
Ka 0.786 0.177 0.262
(<.0001) (0.45) (0.26)
Afp 0.268 0.198
(0.25) (0.40)
CO2 -0.071
(0.77) Sq: Soil structural quality; Bd: Bulk density; Ka: air permeability; Afp: air-fi lled porosity.
Conclusions
Soil physical parameters were more favorable in the row position. However, no difference in in vitro CO2 or N2O production was detected between positions, possibly because of the similar pore continuity in both soils maintaining satisfactory aeration status. Soil physi-cal quality under no-tillage system is enhanced, at least in the short term, by the superfi cial disturbance in the plant rows provided by the action of the coulters of the no-till seeder and roots.
Acknowledgments
To John Parker and Colin Crawford, for technical help.
References
Arshad, M.A.; Franzluebbers, A.J.; Azooz, R.H. 1999. Components of surface soil structure under conventional and no-tillage in northwestern Canada. Soil and Tillage Research 53: 41-47. Ball, B.C.; O’Sullivan, M.F.; Hunter, R. 1988. Gas diffusion, fl uid
fl ow and derived pore continuity indices in relation to vehicle traffi c and tillage. Journal of Soil Science 39: 327-339.
Ball, B.C.; Schjønning, P. 2002. Air permeability. p. 1141-1158. In: Dane, J.H.; Topp, G.C., eds. Methods of soil analysis. Part 4. Physical methods. American Society of Agronomy, Madison, WI, USA. (SSSA Book Series 5.).
Ball, B.C.; Batey, T.; Munkholm, L. 2007. Field assessment of soil structural quality: a development of the Peerlkamp test. Soil Use and Management 23:329–337.
Bavoso, M.A.; Silva, A.P.; Figueiredo, G.C.; Tormena, C.A.; Giarola, N.F.B. 2012. Physical resilience of two Oxisols under
no-tillage. Revista Brasileira de Ciência do Solo 36: 1892-1904 (in Portuguese, with English abstract).
Blainski, E.; Gonçalves, A.C.A.; Tormena, C.A.; Folegatti, M.V.; Guimarães, R.M.L. 2009. Least limiting water range of an irrigated dystroferric Red Nitosol. Revista Brasileira de Ciência do solo Solo 33: 273-281 (in Portuguese, with English abstract). Blanco-Canqui, H.; Stone, L.R.; Schlegel, A.J.; Lyon, D.J.; Vigil, M.F.;
Mikha, M.M.; Stahlman, P.W.; Rice, C. 2009. No-till induced increase in organic carbon reduces maximum bulk density of soils. Soil Science Society of American Journal 73: 1871-1879.
Cavalieri, K.M.V.; Silva, A.P.; Tormena, C.A.; Leão, T.P.; Dexter, A.R.; Hakansson, I. 2009. Long-term effects of no-tillage on dynamic soil physical properties in a Rhodic Ferralsol in Paraná, Brazil. Soil and Tillage Research 103: 158-164.
Chan, K.Y. 2002. Bulk density. p. 128-130. In: LAL, R., ed. Encyclopedia of soil science. Marcel Dekker, New York, NY, USA
Dobbie, K.E.; McTaggart, I.P.; Smith, K.A. 1999. Nitrous oxide emissions from intensive agricultural systems: variations between crops and seasons, key driving variables and mean emission factors. Journal of Geophysical Research 104: 891-899. Dörner, J.; Horn, R. 2009. Direction-dependent behaviour of
hydraulic and mechanical properties in structured soils under conventional and conservation tillage. Soil and Tillage Research 102: 225-232.
Giarola, N.F.B.; Silva, A.P.; Tormena, C.A.; Guimarães, R.M.L.; Ball, B.C. 2013. On the visual evaluation of soil structure: the Brazilian experience in Oxisols under no-tillage. Soil and Tillage Research 127: 60-64.
Guimarães, R.M.L.; Ball, B.C.; Tormena, C.A. 2011. Improvements in the visual evaluation of soil structure. Soil Use and Management 27: 395-403.
Guimarães, R.M.L.; Ball, B.C.; Tormena, C.A.; Giarola, N.F.B.; Silva, A.P. 2013. Relating visual evaluation of soil structure to other physical properties in soils of contrasting texture and management. Soil and Tillage Research 127: 92-99.
Hobbs, P.R.; Sayre, K.; Gupta, R. 2008. The role of conservation agriculture in sustainable agriculture. Philosophical Transaction of Royal Society B 363: 543-555.
Kaspar, T.C.; Brown, H.J.; Kassmeyer, E.M. 1991. Corn root distribution as affected by tillage, wheel traffi c, and fertilizer placement. Soil Science Society of American Journal 55: 1390-1394.
La Scala Jr, N.; Lopes, A.; Marques Jr, J.; Pereira, G.T. 2001. Carbon dioxide emissions after application of tillage systems for a dark Red Latosol in southern Brazil. Soil and Tillage Research 62: 163-166.
McQueen, D.J., Shepherd, T.G., 2002. Physical changes and compaction sensitivity of a fi ne-textured, poorly drained soil (Typic Endoaquept) under varying durations of cropping Manawatu Region, New Zealand. Soil and Tillage Research 63: 93-107. Munkholm, L.J.; Heck, R.J.; Deen, B. 2013. Long-term rotation
and tillage effects on soil structure and crop yield. Soil and Tillage Research 127: 85-91.
Schjønning, P.; Munkholm, L.J.; Moldrup, P.; Jacobsen, O.H. 2002. Modeling soil pore characteristics from measurements of air exchange: the long-term effects of fertilization and crop rotation. European Journal of Soil Science 53: 331-339. Singh, J.; Saggar, S.; Giltrap, D.L.; Bolan, N.S. 2008. Decomposition
of dicyandiamide (DCD) in three contrasting soils and its effect on nitrous oxide emission, soil respiratory activity, and microbial biomass: an incubation study. Australian Journal of Soil Research 46: 517-525.
Silveira Júnior, S.D.; Silva, A.P.; Figueiredo, G.C.; Tormena, C.A.; Giarola, N.F.B. 2012. Physical quality of untilled oxisol subjected to mechanical and biological decompaction = Qualidade física de um Latossolo Vermelho sob plantio direto submetido à descompactação mecânica e biológica. Revista Brasileira de Ciência do Solo 36: 1854-1867 (in Portuguese, with English abstract).
Tormena, C.A.; Silva, A.P.; Imhoff, S.C.; Dexter, A.R. 2008. Quantifi cation of the soil physical quality of a tropical Oxisol using the S index. Scientia Agricola 65: 56-60.
Triplett Jr, G.B.; Dick, W.A. 2008. No-tillage crop production: a revolution in agriculture. Agronomy Journal 100: S153-S165. Veiga, M.; Horn, R.; Reinert, D.J.; Reichert, J.M. 2007. Soil
compressibility and penetrability of an Oxisol from southern Brazil, as affected by long-term tillage systems. Soil and Tillage Research 92: 104-113.